

Key Insights
The 5G connected device market is poised for substantial growth, driven by widespread 5G network deployment and escalating demand for high-bandwidth applications. With a projected CAGR of 13.2% from 2025 to 2033, the market size is expected to reach $21.1 billion by 2025. Key growth drivers include the increasing availability of 5G-enabled smartphones, the expansion of 5G infrastructure, and the rise of innovative applications like AR/VR, IoT, and advanced telematics. Market segmentation shows strong demand for smartphones, CPE, and modules, with advancements in mmWave and sub-6 GHz spectrum technologies fueling further expansion. Leading companies are investing in R&D and strategic alliances to leverage this dynamic market. However, high infrastructure costs and coverage gaps may temper growth.
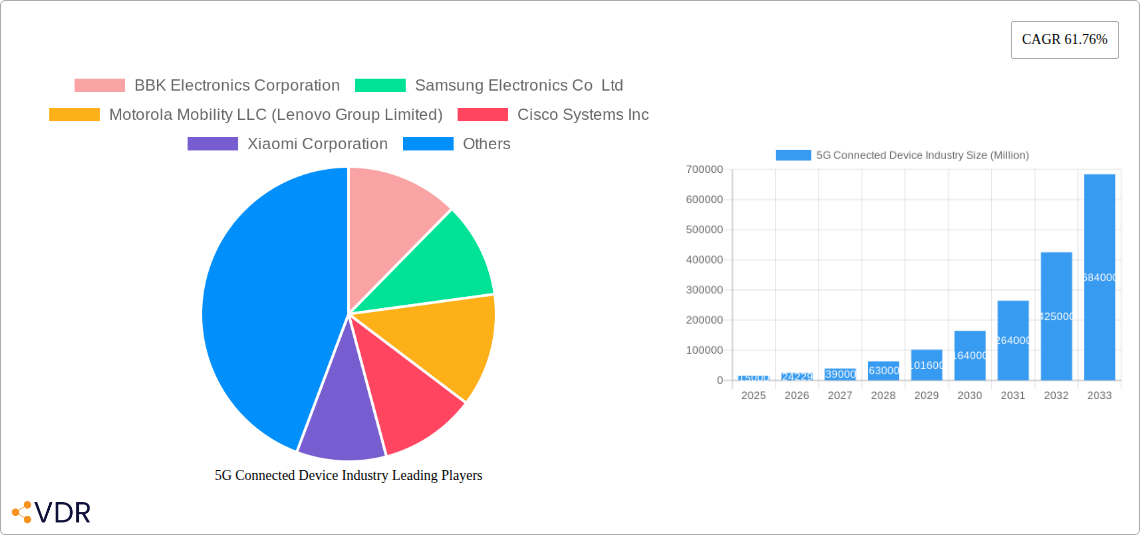
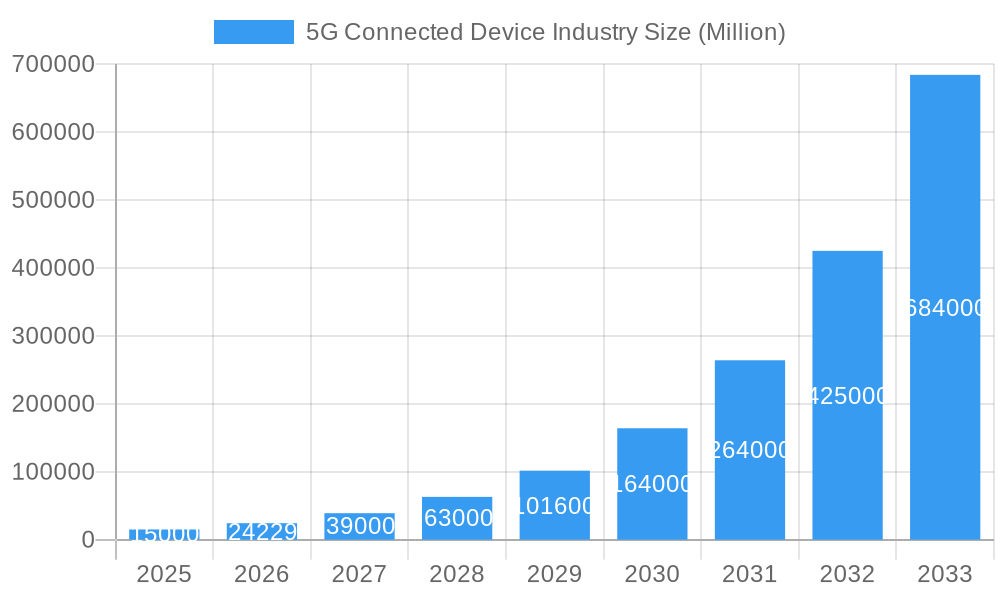
5G Connected Device Industry Market Size (In Billion)
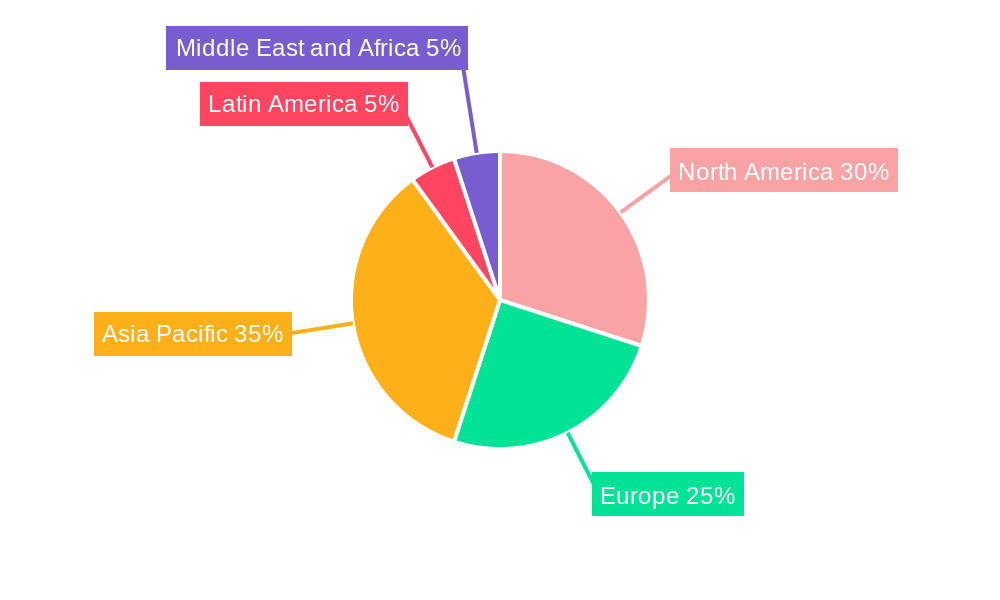
Future market expansion hinges on continued investment in 5G infrastructure, the development of affordable 5G devices, and the successful integration of 5G across sectors like healthcare, manufacturing, and transportation. Addressing data security and privacy concerns is crucial for consumer trust and sustainable growth. While North America and Europe lead adoption, emerging economies in Asia-Pacific and Latin America offer significant untapped potential.
5G Connected Device Industry Company Market Share
5G Connected Device Industry Market Report: 2019-2033
This comprehensive report provides a detailed analysis of the 5G connected device industry, encompassing market dynamics, growth trends, regional dominance, product landscape, key players, and future outlook. The study period covers 2019-2033, with a base year of 2025 and a forecast period of 2025-2033. The report utilizes data from the historical period (2019-2024) and projects future market size in million units. This report is essential for industry professionals, investors, and strategists seeking to understand and capitalize on opportunities within this rapidly evolving sector.
5G Connected Device Industry Market Dynamics & Structure
The 5G connected device market is characterized by high growth potential and intense competition among leading players. Market concentration is moderate, with key players like Samsung, Huawei, and BBK Electronics holding significant market share but facing challenges from emerging players and regional competitors. Technological innovation, particularly in areas like mmWave technology and network slicing, is a key driver. Regulatory frameworks play a crucial role in deployment and standardization, influencing market access and adoption rates. Competitive product substitutes, such as improved 4G LTE technology, present some challenges, but the superior speed and capacity of 5G are expected to maintain its dominance. End-user demographics are expanding rapidly, with increasing smartphone penetration and growing demand for high-bandwidth applications in various sectors (consumer, industrial, IoT). The pace of mergers and acquisitions (M&A) activity is currently moderate (xx deals in the last 3 years), with strategic acquisitions primarily driven by enhancing technology portfolios, market expansion, and access to new markets.
- Market Concentration: Moderate, with top 5 players holding approximately xx% of the market share in 2025.
- Innovation Drivers: mmWave technology, network slicing, AI-powered device management.
- Regulatory Frameworks: Varying across regions, impacting deployment speed and costs.
- Competitive Substitutes: 4G LTE, Wi-Fi 6E.
- End-User Demographics: Growing smartphone penetration, increasing adoption of IoT devices.
- M&A Trends: Moderate activity focused on technology enhancement and market expansion.
5G Connected Device Industry Growth Trends & Insights
The 5G connected device market is experiencing robust growth, driven by increasing 5G network deployments globally and the expanding adoption of 5G-enabled devices. The market size is projected to reach xx million units in 2025, exhibiting a Compound Annual Growth Rate (CAGR) of xx% from 2025 to 2033. This growth is fueled by several factors, including the rising demand for high-speed data, increased affordability of 5G devices, and the proliferation of applications requiring high bandwidth, low latency connectivity. Technological disruptions, like the introduction of more efficient chipsets and improved battery technology are also propelling market expansion. Consumer behavior shifts towards data-intensive activities, such as streaming video and gaming, are significant contributors to this trend. Market penetration for 5G devices is also gradually increasing, which is expected to further fuel market growth in the coming years. The rapid expansion of IoT applications and the increasing demand for higher speed and reliability are further boosting market adoption.
Dominant Regions, Countries, or Segments in 5G Connected Device Industry
The Asia-Pacific region is currently the dominant market for 5G connected devices, driven by high smartphone penetration and robust 5G network rollouts. China, India, and South Korea are key growth markets within the region. North America and Europe are also significant markets, exhibiting strong growth potential, particularly in the deployment of 5G-enabled Industrial IoT devices and FWA solutions.
Dominant Segments (2025):
- Form Factor: Smartphones (xx million units), followed by CPE (Indoor/Outdoor) (xx million units).
- Spectrum Support: Sub-6 GHz (xx million units) currently dominates, with mmWave adoption gradually increasing.
Key Drivers:
- Asia-Pacific: High smartphone penetration, extensive 5G infrastructure development.
- North America: Robust 5G network deployment, increasing demand for Industrial IoT applications.
- Europe: Focus on fixed wireless access (FWA), growing adoption in industrial segments.
5G Connected Device Industry Product Landscape
The 5G connected device landscape is characterized by a diverse range of products, encompassing smartphones, CPEs (Indoor/Outdoor), hotspots, laptops, and industrial-grade CPEs/routers/gateways. Innovative features such as advanced antenna technologies for improved signal reception, energy-efficient chipsets extending battery life, and enhanced security features are driving product differentiation. Key performance metrics include data speeds, latency, and energy consumption. Manufacturers are increasingly focusing on creating unique selling propositions through enhanced functionality, sophisticated design, and integrated applications to capture market share.
Key Drivers, Barriers & Challenges in 5G Connected Device Industry
Key Drivers:
- Increased demand for high-speed data: Streaming, gaming, and augmented/virtual reality applications.
- Falling device costs: Making 5G technology more accessible to a wider audience.
- Government initiatives and subsidies: Accelerating 5G infrastructure deployment.
Challenges & Restraints:
- Supply chain disruptions: Impacting the availability of key components.
- High initial deployment costs: Limiting rapid adoption in some regions.
- Regulatory hurdles: Varying across countries, creating complexities for manufacturers.
Emerging Opportunities in 5G Connected Device Industry
Significant opportunities exist in untapped markets, particularly in developing countries with growing smartphone penetration. Innovative applications in the automotive, healthcare, and industrial sectors are presenting lucrative avenues for growth. Evolving consumer preferences towards enhanced connectivity, seamless integration across devices, and personalized experiences drive opportunities for advanced features and services.
Growth Accelerators in the 5G Connected Device Industry
Technological breakthroughs, particularly in areas like mmWave technology and network slicing, are critical growth catalysts. Strategic partnerships between device manufacturers, network operators, and application providers are also driving market expansion. Aggressive market expansion strategies in emerging markets, combined with the development of new applications, are further fueling industry growth.
Key Players Shaping the 5G Connected Device Industry Market
- BBK Electronics Corporation
- Samsung Electronics Co Ltd
- Motorola Mobility LLC (Lenovo Group Limited)
- Cisco Systems Inc
- Xiaomi Corporation
- Keysight Technologies Inc
- Huawei Technologies Co Ltd
- ZTE Corporation
- Nokia Corporation
Notable Milestones in 5G Connected Device Industry Sector
- September 2022: Nokia and Telia Finland launched a commercial 5G standalone (SA) network with network slicing for Fixed Wireless Access (FWA).
- September 2022: ZTE Corporation and China Mobile trialled a 5G industrial comprehensive emulator and analyzer product.
- July 2022: Samsung launched the Galaxy M13 5G, a budget-friendly 5G smartphone in India.
In-Depth 5G Connected Device Industry Market Outlook
The 5G connected device market is poised for sustained growth over the next decade. Continued advancements in 5G technology, coupled with the expanding adoption of IoT and the proliferation of data-intensive applications will drive market expansion. Strategic partnerships, focusing on integrated solutions and innovative services, will be crucial for sustained success. The market presents significant opportunities for players willing to embrace technological advancements and navigate the evolving regulatory landscape.
5G Connected Device Industry Segmentation
-
1. Form Factor
- 1.1. Modules
- 1.2. CPE (Indoor/Outdoor)
- 1.3. Smartphone
- 1.4. Hotspots
- 1.5. Laptops
- 1.6. Industrial Grade CPE/Router/Gateway
- 1.7. Other Form Factors
-
2. Spectrum Support
- 2.1. Sub-6 GHz
- 2.2. mmWave
- 2.3. Both Spectrum Bands
5G Connected Device Industry Segmentation By Geography
-
1. North America
- 1.1. United States
- 1.2. Canada
-
2. Europe
- 2.1. Germany
- 2.2. UK
- 2.3. France
- 2.4. Spain
- 2.5. Rest of Europe
-
3. Asia Pacific
- 3.1. China
- 3.2. Japan
- 3.3. India
- 3.4. Australia
- 3.5. Rest of Asia Pacific
-
4. Latin America
- 4.1. Brazil
- 4.2. Mexico
- 4.3. Argentina
- 4.4. Rest of Latin America
-
5. Middle East and Africa
- 5.1. UAE
- 5.2. Saudi Arabia
- 5.3. South Africa
- 5.4. Rest of Middle East and Africa
5G Connected Device Industry Regional Market Share
Geographic Coverage of 5G Connected Device Industry
5G Connected Device Industry REPORT HIGHLIGHTS
| Aspects | Details |
|---|---|
| Study Period | 2020-2034 |
| Base Year | 2025 |
| Estimated Year | 2026 |
| Forecast Period | 2026-2034 |
| Historical Period | 2020-2025 |
| Growth Rate | CAGR of 13.2% from 2020-2034 |
| Segmentation |
|
Table of Contents
- 1. Introduction
- 1.1. Research Scope
- 1.2. Market Segmentation
- 1.3. Research Objective
- 1.4. Definitions and Assumptions
- 2. Executive Summary
- 2.1. Market Snapshot
- 3. Market Dynamics
- 3.1. Market Drivers
- 3.2. Market Restrains
- 3.3. Market Trends
- 3.4. Market Opportunities
- 4. Market Factor Analysis
- 4.1. Porters Five Forces
- 4.1.1. Bargaining Power of Suppliers
- 4.1.2. Bargaining Power of Buyers
- 4.1.3. Threat of New Entrants
- 4.1.4. Threat of Substitutes
- 4.1.5. Competitive Rivalry
- 4.2. PESTEL analysis
- 4.3. BCG Analysis
- 4.3.1. Stars (High Growth, High Market Share)
- 4.3.2. Cash Cows (Low Growth, High Market Share)
- 4.3.3. Question Mark (High Growth, Low Market Share)
- 4.3.4. Dogs (Low Growth, Low Market Share)
- 4.4. Ansoff Matrix Analysis
- 4.5. Supply Chain Analysis
- 4.6. Regulatory Landscape
- 4.7. Current Market Potential and Opportunity Assessment (TAM–SAM–SOM Framework)
- 4.8. VDR Analyst Note
- 4.1. Porters Five Forces
- 5. Market Analysis, Insights and Forecast 2021-2033
- 5.1. Market Analysis, Insights and Forecast - by Form Factor
- 5.1.1. Modules
- 5.1.2. CPE (Indoor/Outdoor)
- 5.1.3. Smartphone
- 5.1.4. Hotspots
- 5.1.5. Laptops
- 5.1.6. Industrial Grade CPE/Router/Gateway
- 5.1.7. Other Form Factors
- 5.2. Market Analysis, Insights and Forecast - by Spectrum Support
- 5.2.1. Sub-6 GHz
- 5.2.2. mmWave
- 5.2.3. Both Spectrum Bands
- 5.3. Market Analysis, Insights and Forecast - by Region
- 5.3.1. North America
- 5.3.2. Europe
- 5.3.3. Asia Pacific
- 5.3.4. Latin America
- 5.3.5. Middle East and Africa
- 5.1. Market Analysis, Insights and Forecast - by Form Factor
- 6. Global 5G Connected Device Industry Analysis, Insights and Forecast, 2021-2033
- 6.1. Market Analysis, Insights and Forecast - by Form Factor
- 6.1.1. Modules
- 6.1.2. CPE (Indoor/Outdoor)
- 6.1.3. Smartphone
- 6.1.4. Hotspots
- 6.1.5. Laptops
- 6.1.6. Industrial Grade CPE/Router/Gateway
- 6.1.7. Other Form Factors
- 6.2. Market Analysis, Insights and Forecast - by Spectrum Support
- 6.2.1. Sub-6 GHz
- 6.2.2. mmWave
- 6.2.3. Both Spectrum Bands
- 6.1. Market Analysis, Insights and Forecast - by Form Factor
- 7. North America 5G Connected Device Industry Analysis, Insights and Forecast, 2021-2033
- 7.1. Market Analysis, Insights and Forecast - by Form Factor
- 7.1.1. Modules
- 7.1.2. CPE (Indoor/Outdoor)
- 7.1.3. Smartphone
- 7.1.4. Hotspots
- 7.1.5. Laptops
- 7.1.6. Industrial Grade CPE/Router/Gateway
- 7.1.7. Other Form Factors
- 7.2. Market Analysis, Insights and Forecast - by Spectrum Support
- 7.2.1. Sub-6 GHz
- 7.2.2. mmWave
- 7.2.3. Both Spectrum Bands
- 7.1. Market Analysis, Insights and Forecast - by Form Factor
- 8. Europe 5G Connected Device Industry Analysis, Insights and Forecast, 2021-2033
- 8.1. Market Analysis, Insights and Forecast - by Form Factor
- 8.1.1. Modules
- 8.1.2. CPE (Indoor/Outdoor)
- 8.1.3. Smartphone
- 8.1.4. Hotspots
- 8.1.5. Laptops
- 8.1.6. Industrial Grade CPE/Router/Gateway
- 8.1.7. Other Form Factors
- 8.2. Market Analysis, Insights and Forecast - by Spectrum Support
- 8.2.1. Sub-6 GHz
- 8.2.2. mmWave
- 8.2.3. Both Spectrum Bands
- 8.1. Market Analysis, Insights and Forecast - by Form Factor
- 9. Asia Pacific 5G Connected Device Industry Analysis, Insights and Forecast, 2021-2033
- 9.1. Market Analysis, Insights and Forecast - by Form Factor
- 9.1.1. Modules
- 9.1.2. CPE (Indoor/Outdoor)
- 9.1.3. Smartphone
- 9.1.4. Hotspots
- 9.1.5. Laptops
- 9.1.6. Industrial Grade CPE/Router/Gateway
- 9.1.7. Other Form Factors
- 9.2. Market Analysis, Insights and Forecast - by Spectrum Support
- 9.2.1. Sub-6 GHz
- 9.2.2. mmWave
- 9.2.3. Both Spectrum Bands
- 9.1. Market Analysis, Insights and Forecast - by Form Factor
- 10. Latin America 5G Connected Device Industry Analysis, Insights and Forecast, 2021-2033
- 10.1. Market Analysis, Insights and Forecast - by Form Factor
- 10.1.1. Modules
- 10.1.2. CPE (Indoor/Outdoor)
- 10.1.3. Smartphone
- 10.1.4. Hotspots
- 10.1.5. Laptops
- 10.1.6. Industrial Grade CPE/Router/Gateway
- 10.1.7. Other Form Factors
- 10.2. Market Analysis, Insights and Forecast - by Spectrum Support
- 10.2.1. Sub-6 GHz
- 10.2.2. mmWave
- 10.2.3. Both Spectrum Bands
- 10.1. Market Analysis, Insights and Forecast - by Form Factor
- 11. Middle East and Africa 5G Connected Device Industry Analysis, Insights and Forecast, 2021-2033
- 11.1. Market Analysis, Insights and Forecast - by Form Factor
- 11.1.1. Modules
- 11.1.2. CPE (Indoor/Outdoor)
- 11.1.3. Smartphone
- 11.1.4. Hotspots
- 11.1.5. Laptops
- 11.1.6. Industrial Grade CPE/Router/Gateway
- 11.1.7. Other Form Factors
- 11.2. Market Analysis, Insights and Forecast - by Spectrum Support
- 11.2.1. Sub-6 GHz
- 11.2.2. mmWave
- 11.2.3. Both Spectrum Bands
- 11.1. Market Analysis, Insights and Forecast - by Form Factor
- 12. Competitive Analysis
- 12.1. Company Profiles
- 12.1.1 BBK Electronics Corporation
- 12.1.1.1. Company Overview
- 12.1.1.2. Products
- 12.1.1.3. Company Financials
- 12.1.1.4. SWOT Analysis
- 12.1.2 Samsung Electronics Co Ltd
- 12.1.2.1. Company Overview
- 12.1.2.2. Products
- 12.1.2.3. Company Financials
- 12.1.2.4. SWOT Analysis
- 12.1.3 Motorola Mobility LLC (Lenovo Group Limited)
- 12.1.3.1. Company Overview
- 12.1.3.2. Products
- 12.1.3.3. Company Financials
- 12.1.3.4. SWOT Analysis
- 12.1.4 Cisco Systems Inc
- 12.1.4.1. Company Overview
- 12.1.4.2. Products
- 12.1.4.3. Company Financials
- 12.1.4.4. SWOT Analysis
- 12.1.5 Xiaomi Corporation
- 12.1.5.1. Company Overview
- 12.1.5.2. Products
- 12.1.5.3. Company Financials
- 12.1.5.4. SWOT Analysis
- 12.1.6 Keysight Technologies Inc *List Not Exhaustive
- 12.1.6.1. Company Overview
- 12.1.6.2. Products
- 12.1.6.3. Company Financials
- 12.1.6.4. SWOT Analysis
- 12.1.7 Huawei Technologies Co Ltd
- 12.1.7.1. Company Overview
- 12.1.7.2. Products
- 12.1.7.3. Company Financials
- 12.1.7.4. SWOT Analysis
- 12.1.8 ZTE Corporation
- 12.1.8.1. Company Overview
- 12.1.8.2. Products
- 12.1.8.3. Company Financials
- 12.1.8.4. SWOT Analysis
- 12.1.9 Nokia Corporation
- 12.1.9.1. Company Overview
- 12.1.9.2. Products
- 12.1.9.3. Company Financials
- 12.1.9.4. SWOT Analysis
- 12.1.1 BBK Electronics Corporation
- 12.2. Market Entropy
- 12.2.1 Company's Key Areas Served
- 12.2.2 Recent Developments
- 12.3. Company Market Share Analysis 2025
- 12.3.1 Top 5 Companies Market Share Analysis
- 12.3.2 Top 3 Companies Market Share Analysis
- 12.4. List of Potential Customers
- 13. Research Methodology
List of Figures
- Figure 1: Global 5G Connected Device Industry Revenue Breakdown (billion, %) by Region 2025 & 2033
- Figure 2: Global 5G Connected Device Industry Volume Breakdown (Billion, %) by Region 2025 & 2033
- Figure 3: North America 5G Connected Device Industry Revenue (billion), by Form Factor 2025 & 2033
- Figure 4: North America 5G Connected Device Industry Volume (Billion), by Form Factor 2025 & 2033
- Figure 5: North America 5G Connected Device Industry Revenue Share (%), by Form Factor 2025 & 2033
- Figure 6: North America 5G Connected Device Industry Volume Share (%), by Form Factor 2025 & 2033
- Figure 7: North America 5G Connected Device Industry Revenue (billion), by Spectrum Support 2025 & 2033
- Figure 8: North America 5G Connected Device Industry Volume (Billion), by Spectrum Support 2025 & 2033
- Figure 9: North America 5G Connected Device Industry Revenue Share (%), by Spectrum Support 2025 & 2033
- Figure 10: North America 5G Connected Device Industry Volume Share (%), by Spectrum Support 2025 & 2033
- Figure 11: North America 5G Connected Device Industry Revenue (billion), by Country 2025 & 2033
- Figure 12: North America 5G Connected Device Industry Volume (Billion), by Country 2025 & 2033
- Figure 13: North America 5G Connected Device Industry Revenue Share (%), by Country 2025 & 2033
- Figure 14: North America 5G Connected Device Industry Volume Share (%), by Country 2025 & 2033
- Figure 15: Europe 5G Connected Device Industry Revenue (billion), by Form Factor 2025 & 2033
- Figure 16: Europe 5G Connected Device Industry Volume (Billion), by Form Factor 2025 & 2033
- Figure 17: Europe 5G Connected Device Industry Revenue Share (%), by Form Factor 2025 & 2033
- Figure 18: Europe 5G Connected Device Industry Volume Share (%), by Form Factor 2025 & 2033
- Figure 19: Europe 5G Connected Device Industry Revenue (billion), by Spectrum Support 2025 & 2033
- Figure 20: Europe 5G Connected Device Industry Volume (Billion), by Spectrum Support 2025 & 2033
- Figure 21: Europe 5G Connected Device Industry Revenue Share (%), by Spectrum Support 2025 & 2033
- Figure 22: Europe 5G Connected Device Industry Volume Share (%), by Spectrum Support 2025 & 2033
- Figure 23: Europe 5G Connected Device Industry Revenue (billion), by Country 2025 & 2033
- Figure 24: Europe 5G Connected Device Industry Volume (Billion), by Country 2025 & 2033
- Figure 25: Europe 5G Connected Device Industry Revenue Share (%), by Country 2025 & 2033
- Figure 26: Europe 5G Connected Device Industry Volume Share (%), by Country 2025 & 2033
- Figure 27: Asia Pacific 5G Connected Device Industry Revenue (billion), by Form Factor 2025 & 2033
- Figure 28: Asia Pacific 5G Connected Device Industry Volume (Billion), by Form Factor 2025 & 2033
- Figure 29: Asia Pacific 5G Connected Device Industry Revenue Share (%), by Form Factor 2025 & 2033
- Figure 30: Asia Pacific 5G Connected Device Industry Volume Share (%), by Form Factor 2025 & 2033
- Figure 31: Asia Pacific 5G Connected Device Industry Revenue (billion), by Spectrum Support 2025 & 2033
- Figure 32: Asia Pacific 5G Connected Device Industry Volume (Billion), by Spectrum Support 2025 & 2033
- Figure 33: Asia Pacific 5G Connected Device Industry Revenue Share (%), by Spectrum Support 2025 & 2033
- Figure 34: Asia Pacific 5G Connected Device Industry Volume Share (%), by Spectrum Support 2025 & 2033
- Figure 35: Asia Pacific 5G Connected Device Industry Revenue (billion), by Country 2025 & 2033
- Figure 36: Asia Pacific 5G Connected Device Industry Volume (Billion), by Country 2025 & 2033
- Figure 37: Asia Pacific 5G Connected Device Industry Revenue Share (%), by Country 2025 & 2033
- Figure 38: Asia Pacific 5G Connected Device Industry Volume Share (%), by Country 2025 & 2033
- Figure 39: Latin America 5G Connected Device Industry Revenue (billion), by Form Factor 2025 & 2033
- Figure 40: Latin America 5G Connected Device Industry Volume (Billion), by Form Factor 2025 & 2033
- Figure 41: Latin America 5G Connected Device Industry Revenue Share (%), by Form Factor 2025 & 2033
- Figure 42: Latin America 5G Connected Device Industry Volume Share (%), by Form Factor 2025 & 2033
- Figure 43: Latin America 5G Connected Device Industry Revenue (billion), by Spectrum Support 2025 & 2033
- Figure 44: Latin America 5G Connected Device Industry Volume (Billion), by Spectrum Support 2025 & 2033
- Figure 45: Latin America 5G Connected Device Industry Revenue Share (%), by Spectrum Support 2025 & 2033
- Figure 46: Latin America 5G Connected Device Industry Volume Share (%), by Spectrum Support 2025 & 2033
- Figure 47: Latin America 5G Connected Device Industry Revenue (billion), by Country 2025 & 2033
- Figure 48: Latin America 5G Connected Device Industry Volume (Billion), by Country 2025 & 2033
- Figure 49: Latin America 5G Connected Device Industry Revenue Share (%), by Country 2025 & 2033
- Figure 50: Latin America 5G Connected Device Industry Volume Share (%), by Country 2025 & 2033
- Figure 51: Middle East and Africa 5G Connected Device Industry Revenue (billion), by Form Factor 2025 & 2033
- Figure 52: Middle East and Africa 5G Connected Device Industry Volume (Billion), by Form Factor 2025 & 2033
- Figure 53: Middle East and Africa 5G Connected Device Industry Revenue Share (%), by Form Factor 2025 & 2033
- Figure 54: Middle East and Africa 5G Connected Device Industry Volume Share (%), by Form Factor 2025 & 2033
- Figure 55: Middle East and Africa 5G Connected Device Industry Revenue (billion), by Spectrum Support 2025 & 2033
- Figure 56: Middle East and Africa 5G Connected Device Industry Volume (Billion), by Spectrum Support 2025 & 2033
- Figure 57: Middle East and Africa 5G Connected Device Industry Revenue Share (%), by Spectrum Support 2025 & 2033
- Figure 58: Middle East and Africa 5G Connected Device Industry Volume Share (%), by Spectrum Support 2025 & 2033
- Figure 59: Middle East and Africa 5G Connected Device Industry Revenue (billion), by Country 2025 & 2033
- Figure 60: Middle East and Africa 5G Connected Device Industry Volume (Billion), by Country 2025 & 2033
- Figure 61: Middle East and Africa 5G Connected Device Industry Revenue Share (%), by Country 2025 & 2033
- Figure 62: Middle East and Africa 5G Connected Device Industry Volume Share (%), by Country 2025 & 2033
List of Tables
- Table 1: Global 5G Connected Device Industry Revenue billion Forecast, by Form Factor 2020 & 2033
- Table 2: Global 5G Connected Device Industry Volume Billion Forecast, by Form Factor 2020 & 2033
- Table 3: Global 5G Connected Device Industry Revenue billion Forecast, by Spectrum Support 2020 & 2033
- Table 4: Global 5G Connected Device Industry Volume Billion Forecast, by Spectrum Support 2020 & 2033
- Table 5: Global 5G Connected Device Industry Revenue billion Forecast, by Region 2020 & 2033
- Table 6: Global 5G Connected Device Industry Volume Billion Forecast, by Region 2020 & 2033
- Table 7: Global 5G Connected Device Industry Revenue billion Forecast, by Form Factor 2020 & 2033
- Table 8: Global 5G Connected Device Industry Volume Billion Forecast, by Form Factor 2020 & 2033
- Table 9: Global 5G Connected Device Industry Revenue billion Forecast, by Spectrum Support 2020 & 2033
- Table 10: Global 5G Connected Device Industry Volume Billion Forecast, by Spectrum Support 2020 & 2033
- Table 11: Global 5G Connected Device Industry Revenue billion Forecast, by Country 2020 & 2033
- Table 12: Global 5G Connected Device Industry Volume Billion Forecast, by Country 2020 & 2033
- Table 13: United States 5G Connected Device Industry Revenue (billion) Forecast, by Application 2020 & 2033
- Table 14: United States 5G Connected Device Industry Volume (Billion) Forecast, by Application 2020 & 2033
- Table 15: Canada 5G Connected Device Industry Revenue (billion) Forecast, by Application 2020 & 2033
- Table 16: Canada 5G Connected Device Industry Volume (Billion) Forecast, by Application 2020 & 2033
- Table 17: Global 5G Connected Device Industry Revenue billion Forecast, by Form Factor 2020 & 2033
- Table 18: Global 5G Connected Device Industry Volume Billion Forecast, by Form Factor 2020 & 2033
- Table 19: Global 5G Connected Device Industry Revenue billion Forecast, by Spectrum Support 2020 & 2033
- Table 20: Global 5G Connected Device Industry Volume Billion Forecast, by Spectrum Support 2020 & 2033
- Table 21: Global 5G Connected Device Industry Revenue billion Forecast, by Country 2020 & 2033
- Table 22: Global 5G Connected Device Industry Volume Billion Forecast, by Country 2020 & 2033
- Table 23: Germany 5G Connected Device Industry Revenue (billion) Forecast, by Application 2020 & 2033
- Table 24: Germany 5G Connected Device Industry Volume (Billion) Forecast, by Application 2020 & 2033
- Table 25: UK 5G Connected Device Industry Revenue (billion) Forecast, by Application 2020 & 2033
- Table 26: UK 5G Connected Device Industry Volume (Billion) Forecast, by Application 2020 & 2033
- Table 27: France 5G Connected Device Industry Revenue (billion) Forecast, by Application 2020 & 2033
- Table 28: France 5G Connected Device Industry Volume (Billion) Forecast, by Application 2020 & 2033
- Table 29: Spain 5G Connected Device Industry Revenue (billion) Forecast, by Application 2020 & 2033
- Table 30: Spain 5G Connected Device Industry Volume (Billion) Forecast, by Application 2020 & 2033
- Table 31: Rest of Europe 5G Connected Device Industry Revenue (billion) Forecast, by Application 2020 & 2033
- Table 32: Rest of Europe 5G Connected Device Industry Volume (Billion) Forecast, by Application 2020 & 2033
- Table 33: Global 5G Connected Device Industry Revenue billion Forecast, by Form Factor 2020 & 2033
- Table 34: Global 5G Connected Device Industry Volume Billion Forecast, by Form Factor 2020 & 2033
- Table 35: Global 5G Connected Device Industry Revenue billion Forecast, by Spectrum Support 2020 & 2033
- Table 36: Global 5G Connected Device Industry Volume Billion Forecast, by Spectrum Support 2020 & 2033
- Table 37: Global 5G Connected Device Industry Revenue billion Forecast, by Country 2020 & 2033
- Table 38: Global 5G Connected Device Industry Volume Billion Forecast, by Country 2020 & 2033
- Table 39: China 5G Connected Device Industry Revenue (billion) Forecast, by Application 2020 & 2033
- Table 40: China 5G Connected Device Industry Volume (Billion) Forecast, by Application 2020 & 2033
- Table 41: Japan 5G Connected Device Industry Revenue (billion) Forecast, by Application 2020 & 2033
- Table 42: Japan 5G Connected Device Industry Volume (Billion) Forecast, by Application 2020 & 2033
- Table 43: India 5G Connected Device Industry Revenue (billion) Forecast, by Application 2020 & 2033
- Table 44: India 5G Connected Device Industry Volume (Billion) Forecast, by Application 2020 & 2033
- Table 45: Australia 5G Connected Device Industry Revenue (billion) Forecast, by Application 2020 & 2033
- Table 46: Australia 5G Connected Device Industry Volume (Billion) Forecast, by Application 2020 & 2033
- Table 47: Rest of Asia Pacific 5G Connected Device Industry Revenue (billion) Forecast, by Application 2020 & 2033
- Table 48: Rest of Asia Pacific 5G Connected Device Industry Volume (Billion) Forecast, by Application 2020 & 2033
- Table 49: Global 5G Connected Device Industry Revenue billion Forecast, by Form Factor 2020 & 2033
- Table 50: Global 5G Connected Device Industry Volume Billion Forecast, by Form Factor 2020 & 2033
- Table 51: Global 5G Connected Device Industry Revenue billion Forecast, by Spectrum Support 2020 & 2033
- Table 52: Global 5G Connected Device Industry Volume Billion Forecast, by Spectrum Support 2020 & 2033
- Table 53: Global 5G Connected Device Industry Revenue billion Forecast, by Country 2020 & 2033
- Table 54: Global 5G Connected Device Industry Volume Billion Forecast, by Country 2020 & 2033
- Table 55: Brazil 5G Connected Device Industry Revenue (billion) Forecast, by Application 2020 & 2033
- Table 56: Brazil 5G Connected Device Industry Volume (Billion) Forecast, by Application 2020 & 2033
- Table 57: Mexico 5G Connected Device Industry Revenue (billion) Forecast, by Application 2020 & 2033
- Table 58: Mexico 5G Connected Device Industry Volume (Billion) Forecast, by Application 2020 & 2033
- Table 59: Argentina 5G Connected Device Industry Revenue (billion) Forecast, by Application 2020 & 2033
- Table 60: Argentina 5G Connected Device Industry Volume (Billion) Forecast, by Application 2020 & 2033
- Table 61: Rest of Latin America 5G Connected Device Industry Revenue (billion) Forecast, by Application 2020 & 2033
- Table 62: Rest of Latin America 5G Connected Device Industry Volume (Billion) Forecast, by Application 2020 & 2033
- Table 63: Global 5G Connected Device Industry Revenue billion Forecast, by Form Factor 2020 & 2033
- Table 64: Global 5G Connected Device Industry Volume Billion Forecast, by Form Factor 2020 & 2033
- Table 65: Global 5G Connected Device Industry Revenue billion Forecast, by Spectrum Support 2020 & 2033
- Table 66: Global 5G Connected Device Industry Volume Billion Forecast, by Spectrum Support 2020 & 2033
- Table 67: Global 5G Connected Device Industry Revenue billion Forecast, by Country 2020 & 2033
- Table 68: Global 5G Connected Device Industry Volume Billion Forecast, by Country 2020 & 2033
- Table 69: UAE 5G Connected Device Industry Revenue (billion) Forecast, by Application 2020 & 2033
- Table 70: UAE 5G Connected Device Industry Volume (Billion) Forecast, by Application 2020 & 2033
- Table 71: Saudi Arabia 5G Connected Device Industry Revenue (billion) Forecast, by Application 2020 & 2033
- Table 72: Saudi Arabia 5G Connected Device Industry Volume (Billion) Forecast, by Application 2020 & 2033
- Table 73: South Africa 5G Connected Device Industry Revenue (billion) Forecast, by Application 2020 & 2033
- Table 74: South Africa 5G Connected Device Industry Volume (Billion) Forecast, by Application 2020 & 2033
- Table 75: Rest of Middle East and Africa 5G Connected Device Industry Revenue (billion) Forecast, by Application 2020 & 2033
- Table 76: Rest of Middle East and Africa 5G Connected Device Industry Volume (Billion) Forecast, by Application 2020 & 2033
Frequently Asked Questions
1. What is the projected Compound Annual Growth Rate (CAGR) of the 5G Connected Device Industry?
The projected CAGR is approximately 13.2%.
2. Which companies are prominent players in the 5G Connected Device Industry?
Key companies in the market include BBK Electronics Corporation, Samsung Electronics Co Ltd, Motorola Mobility LLC (Lenovo Group Limited), Cisco Systems Inc, Xiaomi Corporation, Keysight Technologies Inc *List Not Exhaustive, Huawei Technologies Co Ltd, ZTE Corporation, Nokia Corporation.
3. What are the main segments of the 5G Connected Device Industry?
The market segments include Form Factor, Spectrum Support.
4. Can you provide details about the market size?
The market size is estimated to be USD 21.1 billion as of 2022.
5. What are some drivers contributing to market growth?
Sustained Increase in Number of Devices and Endpoints Worldwide; Technological Innovations at a Component and Device Level to Aid Adoption; Increasing use of Smart Phones and rising Technological advancement in the smart phones is expected to drive market..
6. What are the notable trends driving market growth?
Smartphone Segment is Expected to Witness the Highest Growth.
7. Are there any restraints impacting market growth?
Regulatory and Standardization Delays; Design and Operational Challenges.
8. Can you provide examples of recent developments in the market?
September 2022 - Nokia and Telia Finland launched one of the first commercial 5G standalone (SA) networks with network slicing for Fixed Wireless Access (FWA) services. Telia would introduce 5G SA to its 5G Fixed Wireless Access (FWA) home broadband services and be able to start offering a range of broadband deals with guaranteed service levels to its customers in Finland. The solutions would enable Telia to build on its existing position, delivering enhanced connectivity and capacity benefits to its customers through ongoing deployment.
9. What pricing options are available for accessing the report?
Pricing options include single-user, multi-user, and enterprise licenses priced at USD 4750, USD 5250, and USD 8750 respectively.
10. Is the market size provided in terms of value or volume?
The market size is provided in terms of value, measured in billion and volume, measured in Billion.
11. Are there any specific market keywords associated with the report?
Yes, the market keyword associated with the report is "5G Connected Device Industry," which aids in identifying and referencing the specific market segment covered.
12. How do I determine which pricing option suits my needs best?
The pricing options vary based on user requirements and access needs. Individual users may opt for single-user licenses, while businesses requiring broader access may choose multi-user or enterprise licenses for cost-effective access to the report.
13. Are there any additional resources or data provided in the 5G Connected Device Industry report?
While the report offers comprehensive insights, it's advisable to review the specific contents or supplementary materials provided to ascertain if additional resources or data are available.
14. How can I stay updated on further developments or reports in the 5G Connected Device Industry?
To stay informed about further developments, trends, and reports in the 5G Connected Device Industry, consider subscribing to industry newsletters, following relevant companies and organizations, or regularly checking reputable industry news sources and publications.
Methodology
Step 1 - Identification of Relevant Samples Size from Population Database


Step 2 - Approaches for Defining Global Market Size (Value, Volume* & Price*)

Note*: In applicable scenarios
Step 3 - Data Sources
Primary Research
- Web Analytics
- Survey Reports
- Research Institute
- Latest Research Reports
- Opinion Leaders
Secondary Research
- Annual Reports
- White Paper
- Latest Press Release
- Industry Association
- Paid Database
- Investor Presentations

Step 4 - Data Triangulation
Involves using different sources of information in order to increase the validity of a study
These sources are likely to be stakeholders in a program - participants, other researchers, program staff, other community members, and so on.
Then we put all data in single framework & apply various statistical tools to find out the dynamic on the market.
During the analysis stage, feedback from the stakeholder groups would be compared to determine areas of agreement as well as areas of divergence