

Key Insights
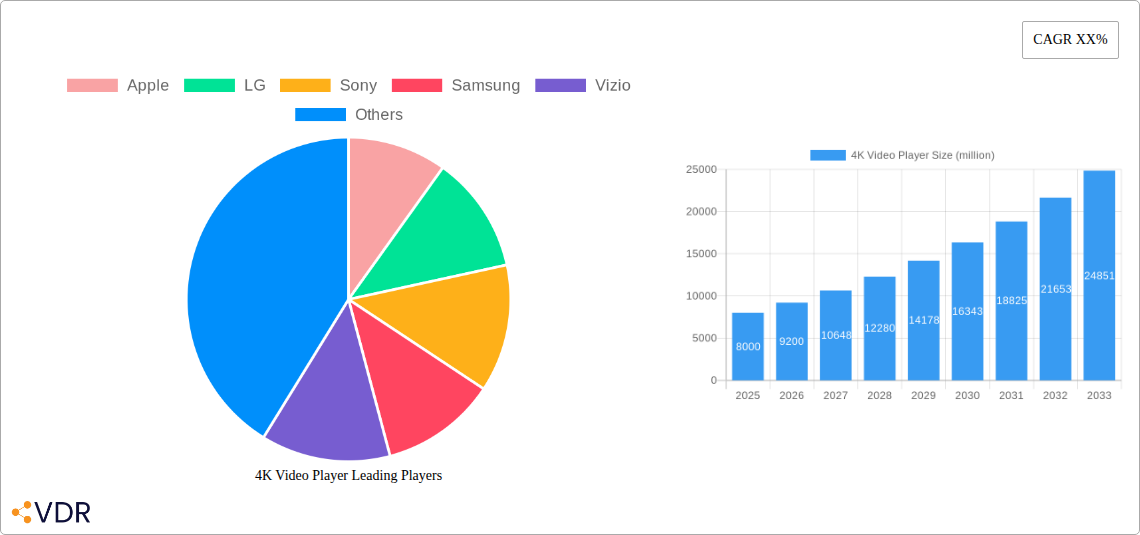
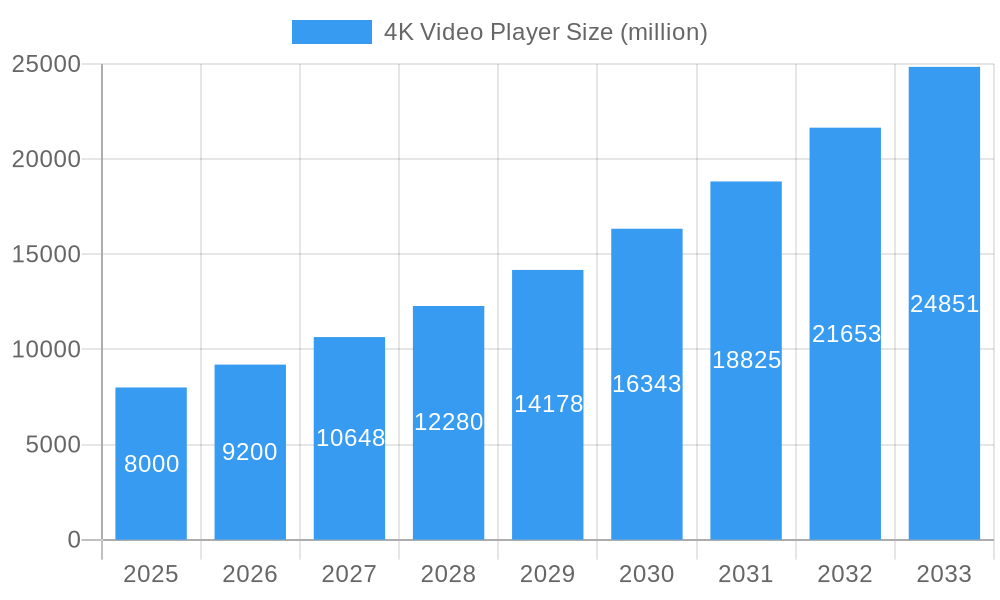
The 4K video player market is experiencing robust growth, driven by increasing demand for high-resolution video content and the proliferation of large-screen TVs. The market, estimated at $8 billion in 2025, is projected to exhibit a healthy Compound Annual Growth Rate (CAGR) of 15% from 2025 to 2033, reaching an estimated value of $25 billion by 2033. This expansion is fueled by several key factors. The rising affordability of 4K displays and streaming services offering 4K content are making high-resolution viewing more accessible to consumers. Furthermore, advancements in technology are leading to more compact and energy-efficient 4K video players with enhanced features like HDR support and improved streaming capabilities. The market's competitive landscape includes established players like Apple, Sony, Samsung, and LG, alongside emerging brands like TCL and Hisense, fostering innovation and driving price competitiveness.
4K Video Player Market Size (In Billion)
However, market growth is not without challenges. The increasing prevalence of smart TVs with built-in streaming capabilities presents a significant restraint, potentially reducing the need for standalone 4K video players. Additionally, the continuous evolution of video streaming technologies and the potential emergence of higher resolution formats beyond 4K could impact the market's long-term trajectory. Despite these restraints, the continued demand for superior video quality and the ongoing development of advanced features will ensure sustained growth for the 4K video player market throughout the forecast period. Segmentation within the market includes various form factors (streaming sticks, standalone players, etc.) and pricing tiers, catering to a diverse range of consumer needs and preferences. Geographic distribution shows strong performance in North America and Europe, with growth potential in emerging Asian markets.
4K Video Player Company Market Share
4K Video Player Market Report: 2019-2033
This comprehensive report provides a detailed analysis of the global 4K video player market, offering invaluable insights for industry professionals, investors, and strategic decision-makers. The study covers the historical period (2019-2024), base year (2025), and forecast period (2025-2033), providing a complete picture of market dynamics and future trends. The report segments the market by key players (Apple, LG, Sony, Samsung, Vizio, TCL, Hisense, Sharp, Panasonic, JVC, WINHI, Haloview, Navori Labs, BrightSign), and geographic regions, offering granular data on market size, growth rates, and key trends. This report is essential for understanding the evolving landscape of 4K video players and capitalizing on emerging opportunities.
4K Video Player Market Dynamics & Structure
The global 4K video player market, valued at $XX million in 2024, exhibits a moderately concentrated structure, with a few major players holding significant market share. Technological innovation, particularly in areas like HDR (High Dynamic Range) and AI-powered upscaling, is a key driver. However, regulatory frameworks concerning video content licensing and streaming services influence market expansion. Competitive substitutes, such as streaming services and smart TVs with built-in players, pose challenges. The end-user demographics are broad, ranging from individual consumers to commercial establishments. M&A activity has been moderate in recent years, with approximately XX deals completed between 2019 and 2024.
- Market Concentration: Moderately concentrated, with top 5 players holding approximately XX% market share in 2024.
- Technological Innovation: HDR, AI upscaling, and improved processing power are key drivers.
- Regulatory Landscape: Licensing agreements and streaming regulations impact market growth.
- Competitive Substitutes: Streaming services and smart TVs pose significant competition.
- End-User Demographics: Consumers, commercial venues, and educational institutions.
- M&A Activity: Approximately XX M&A deals between 2019 and 2024.
4K Video Player Growth Trends & Insights
The 4K video player market experienced significant growth during the historical period (2019-2024), driven by increasing adoption of 4K content and improved affordability. The market is expected to continue its growth trajectory, with a Compound Annual Growth Rate (CAGR) of XX% from 2025 to 2033, reaching a value of $XX million by 2033. This growth is fueled by several factors, including the rising availability of 4K content across various streaming platforms, the growing adoption of large-screen TVs, and advancements in video player technology that deliver enhanced viewing experiences. Consumer behavior shifts towards higher resolution viewing and premium home entertainment setups further bolster market demand. Market penetration is expected to reach XX% by 2033, indicating significant growth potential in untapped markets. Technological disruptions, such as the introduction of 8K technology, could influence market dynamics in the latter part of the forecast period.
Dominant Regions, Countries, or Segments in 4K Video Player
North America currently dominates the 4K video player market, holding the largest market share in 2024 due to high disposable incomes, early adoption of advanced technologies, and strong demand for high-quality home entertainment systems. However, Asia-Pacific is projected to exhibit the highest CAGR during the forecast period, driven by rapid economic growth, increasing urbanization, and rising demand for superior entertainment experiences. Specific countries like China, Japan, and South Korea are key contributors to this regional growth.
- North America: High disposable incomes, early adoption of new technologies, strong demand.
- Asia-Pacific: Rapid economic growth, increasing urbanization, rising disposable incomes.
- Europe: Moderate growth, driven by stable economies and increasing adoption of 4K content.
4K Video Player Product Landscape
The 4K video player market offers a range of products, from standalone players supporting various formats to integrated solutions within smart TVs and streaming devices. Key innovations include support for HDR10+, Dolby Vision, and advanced audio codecs, enhancing visual and auditory fidelity. Furthermore, many players now incorporate AI upscaling for improved image quality, regardless of the source material's resolution. Competition focuses on features like ease of use, seamless integration with streaming services, and advanced connectivity options.
Key Drivers, Barriers & Challenges in 4K Video Player
Key Drivers:
- Increasing affordability of 4K TVs and players.
- Rising availability of 4K content on streaming platforms.
- Growing demand for enhanced home entertainment experiences.
- Advancements in video compression technologies.
Key Challenges:
- Competition from integrated smart TV functionalities.
- The emergence of 8K technology as a potential long-term threat.
- Supply chain disruptions impacting manufacturing and distribution.
- Cybersecurity threats to connected devices.
Emerging Opportunities in 4K Video Player
Emerging opportunities lie in the integration of 4K video players with other smart home devices, creating a unified entertainment ecosystem. The growing adoption of virtual reality (VR) and augmented reality (AR) technologies offers potential for innovative applications of 4K video players in immersive entertainment experiences. Furthermore, untapped markets in developing economies present significant growth potential as incomes rise and consumer preferences shift.
Growth Accelerators in the 4K Video Player Industry
Technological advancements in video processing, compression, and display technologies will be significant growth accelerators. Strategic partnerships between 4K video player manufacturers and content providers will ensure wider access to high-quality 4K content. Expanding into emerging markets and promoting the value proposition of 4K playback will fuel market growth in untapped regions.
Notable Milestones in 4K Video Player Sector
- 2020: Significant increase in 4K content availability on streaming platforms.
- 2021: Launch of several new 4K video players with advanced features like AI upscaling.
- 2022: First commercially available 8K video players are introduced, though still niche.
- 2023: Increased focus on eco-friendly manufacturing practices across the industry.
- 2024: Several major M&A activities consolidate market share among key players.
In-Depth 4K Video Player Market Outlook
The 4K video player market is poised for continued growth, driven by technological advancements and expanding consumer demand. Strategic partnerships, investment in R&D, and expansion into new markets will be crucial for continued success. The emergence of 8K technology presents both challenges and opportunities, potentially reshaping the market landscape in the long term. The focus on user experience, seamless integration with other smart home devices, and robust cybersecurity features will become increasingly important.
4K Video Player Segmentation
-
1. Application
- 1.1. Commercial
- 1.2. Household Use
- 1.3. Others
-
2. Types
- 2.1. Professional Grade
- 2.2. Ordinary Grade
4K Video Player Segmentation By Geography
-
1. North America
- 1.1. United States
- 1.2. Canada
- 1.3. Mexico
-
2. South America
- 2.1. Brazil
- 2.2. Argentina
- 2.3. Rest of South America
-
3. Europe
- 3.1. United Kingdom
- 3.2. Germany
- 3.3. France
- 3.4. Italy
- 3.5. Spain
- 3.6. Russia
- 3.7. Benelux
- 3.8. Nordics
- 3.9. Rest of Europe
-
4. Middle East & Africa
- 4.1. Turkey
- 4.2. Israel
- 4.3. GCC
- 4.4. North Africa
- 4.5. South Africa
- 4.6. Rest of Middle East & Africa
-
5. Asia Pacific
- 5.1. China
- 5.2. India
- 5.3. Japan
- 5.4. South Korea
- 5.5. ASEAN
- 5.6. Oceania
- 5.7. Rest of Asia Pacific

4K Video Player Regional Market Share
Geographic Coverage of 4K Video Player
4K Video Player REPORT HIGHLIGHTS
| Aspects | Details |
|---|---|
| Study Period | 2020-2034 |
| Base Year | 2025 |
| Estimated Year | 2026 |
| Forecast Period | 2026-2034 |
| Historical Period | 2020-2025 |
| Growth Rate | CAGR of 7.4% from 2020-2034 |
| Segmentation |
|
Table of Contents
- 1. Introduction
- 1.1. Research Scope
- 1.2. Market Segmentation
- 1.3. Research Objective
- 1.4. Definitions and Assumptions
- 2. Executive Summary
- 2.1. Market Snapshot
- 3. Market Dynamics
- 3.1. Market Drivers
- 3.2. Market Restrains
- 3.3. Market Trends
- 3.4. Market Opportunities
- 4. Market Factor Analysis
- 4.1. Porters Five Forces
- 4.1.1. Bargaining Power of Suppliers
- 4.1.2. Bargaining Power of Buyers
- 4.1.3. Threat of New Entrants
- 4.1.4. Threat of Substitutes
- 4.1.5. Competitive Rivalry
- 4.2. PESTEL analysis
- 4.3. BCG Analysis
- 4.3.1. Stars (High Growth, High Market Share)
- 4.3.2. Cash Cows (Low Growth, High Market Share)
- 4.3.3. Question Mark (High Growth, Low Market Share)
- 4.3.4. Dogs (Low Growth, Low Market Share)
- 4.4. Ansoff Matrix Analysis
- 4.5. Supply Chain Analysis
- 4.6. Regulatory Landscape
- 4.7. Current Market Potential and Opportunity Assessment (TAM–SAM–SOM Framework)
- 4.8. VDR Analyst Note
- 4.1. Porters Five Forces
- 5. Market Analysis, Insights and Forecast 2021-2033
- 5.1. Market Analysis, Insights and Forecast - by Application
- 5.1.1. Commercial
- 5.1.2. Household Use
- 5.1.3. Others
- 5.2. Market Analysis, Insights and Forecast - by Types
- 5.2.1. Professional Grade
- 5.2.2. Ordinary Grade
- 5.3. Market Analysis, Insights and Forecast - by Region
- 5.3.1. North America
- 5.3.2. South America
- 5.3.3. Europe
- 5.3.4. Middle East & Africa
- 5.3.5. Asia Pacific
- 5.1. Market Analysis, Insights and Forecast - by Application
- 6. Global 4K Video Player Analysis, Insights and Forecast, 2021-2033
- 6.1. Market Analysis, Insights and Forecast - by Application
- 6.1.1. Commercial
- 6.1.2. Household Use
- 6.1.3. Others
- 6.2. Market Analysis, Insights and Forecast - by Types
- 6.2.1. Professional Grade
- 6.2.2. Ordinary Grade
- 6.1. Market Analysis, Insights and Forecast - by Application
- 7. North America 4K Video Player Analysis, Insights and Forecast, 2021-2033
- 7.1. Market Analysis, Insights and Forecast - by Application
- 7.1.1. Commercial
- 7.1.2. Household Use
- 7.1.3. Others
- 7.2. Market Analysis, Insights and Forecast - by Types
- 7.2.1. Professional Grade
- 7.2.2. Ordinary Grade
- 7.1. Market Analysis, Insights and Forecast - by Application
- 8. South America 4K Video Player Analysis, Insights and Forecast, 2021-2033
- 8.1. Market Analysis, Insights and Forecast - by Application
- 8.1.1. Commercial
- 8.1.2. Household Use
- 8.1.3. Others
- 8.2. Market Analysis, Insights and Forecast - by Types
- 8.2.1. Professional Grade
- 8.2.2. Ordinary Grade
- 8.1. Market Analysis, Insights and Forecast - by Application
- 9. Europe 4K Video Player Analysis, Insights and Forecast, 2021-2033
- 9.1. Market Analysis, Insights and Forecast - by Application
- 9.1.1. Commercial
- 9.1.2. Household Use
- 9.1.3. Others
- 9.2. Market Analysis, Insights and Forecast - by Types
- 9.2.1. Professional Grade
- 9.2.2. Ordinary Grade
- 9.1. Market Analysis, Insights and Forecast - by Application
- 10. Middle East & Africa 4K Video Player Analysis, Insights and Forecast, 2021-2033
- 10.1. Market Analysis, Insights and Forecast - by Application
- 10.1.1. Commercial
- 10.1.2. Household Use
- 10.1.3. Others
- 10.2. Market Analysis, Insights and Forecast - by Types
- 10.2.1. Professional Grade
- 10.2.2. Ordinary Grade
- 10.1. Market Analysis, Insights and Forecast - by Application
- 11. Asia Pacific 4K Video Player Analysis, Insights and Forecast, 2021-2033
- 11.1. Market Analysis, Insights and Forecast - by Application
- 11.1.1. Commercial
- 11.1.2. Household Use
- 11.1.3. Others
- 11.2. Market Analysis, Insights and Forecast - by Types
- 11.2.1. Professional Grade
- 11.2.2. Ordinary Grade
- 11.1. Market Analysis, Insights and Forecast - by Application
- 12. Competitive Analysis
- 12.1. Company Profiles
- 12.1.1 Apple
- 12.1.1.1. Company Overview
- 12.1.1.2. Products
- 12.1.1.3. Company Financials
- 12.1.1.4. SWOT Analysis
- 12.1.2 LG
- 12.1.2.1. Company Overview
- 12.1.2.2. Products
- 12.1.2.3. Company Financials
- 12.1.2.4. SWOT Analysis
- 12.1.3 Sony
- 12.1.3.1. Company Overview
- 12.1.3.2. Products
- 12.1.3.3. Company Financials
- 12.1.3.4. SWOT Analysis
- 12.1.4 Samsung
- 12.1.4.1. Company Overview
- 12.1.4.2. Products
- 12.1.4.3. Company Financials
- 12.1.4.4. SWOT Analysis
- 12.1.5 Vizio
- 12.1.5.1. Company Overview
- 12.1.5.2. Products
- 12.1.5.3. Company Financials
- 12.1.5.4. SWOT Analysis
- 12.1.6 TCL
- 12.1.6.1. Company Overview
- 12.1.6.2. Products
- 12.1.6.3. Company Financials
- 12.1.6.4. SWOT Analysis
- 12.1.7 Hisense
- 12.1.7.1. Company Overview
- 12.1.7.2. Products
- 12.1.7.3. Company Financials
- 12.1.7.4. SWOT Analysis
- 12.1.8 Sharp
- 12.1.8.1. Company Overview
- 12.1.8.2. Products
- 12.1.8.3. Company Financials
- 12.1.8.4. SWOT Analysis
- 12.1.9 Panasonic
- 12.1.9.1. Company Overview
- 12.1.9.2. Products
- 12.1.9.3. Company Financials
- 12.1.9.4. SWOT Analysis
- 12.1.10 JVC
- 12.1.10.1. Company Overview
- 12.1.10.2. Products
- 12.1.10.3. Company Financials
- 12.1.10.4. SWOT Analysis
- 12.1.11 WINHI
- 12.1.11.1. Company Overview
- 12.1.11.2. Products
- 12.1.11.3. Company Financials
- 12.1.11.4. SWOT Analysis
- 12.1.12 Haloview
- 12.1.12.1. Company Overview
- 12.1.12.2. Products
- 12.1.12.3. Company Financials
- 12.1.12.4. SWOT Analysis
- 12.1.13 Navori Labs
- 12.1.13.1. Company Overview
- 12.1.13.2. Products
- 12.1.13.3. Company Financials
- 12.1.13.4. SWOT Analysis
- 12.1.14 BrightSign
- 12.1.14.1. Company Overview
- 12.1.14.2. Products
- 12.1.14.3. Company Financials
- 12.1.14.4. SWOT Analysis
- 12.1.1 Apple
- 12.2. Market Entropy
- 12.2.1 Company's Key Areas Served
- 12.2.2 Recent Developments
- 12.3. Company Market Share Analysis 2025
- 12.3.1 Top 5 Companies Market Share Analysis
- 12.3.2 Top 3 Companies Market Share Analysis
- 12.4. List of Potential Customers
- 13. Research Methodology
List of Figures
- Figure 1: Global 4K Video Player Revenue Breakdown (billion, %) by Region 2025 & 2033
- Figure 2: Global 4K Video Player Volume Breakdown (K, %) by Region 2025 & 2033
- Figure 3: North America 4K Video Player Revenue (billion), by Application 2025 & 2033
- Figure 4: North America 4K Video Player Volume (K), by Application 2025 & 2033
- Figure 5: North America 4K Video Player Revenue Share (%), by Application 2025 & 2033
- Figure 6: North America 4K Video Player Volume Share (%), by Application 2025 & 2033
- Figure 7: North America 4K Video Player Revenue (billion), by Types 2025 & 2033
- Figure 8: North America 4K Video Player Volume (K), by Types 2025 & 2033
- Figure 9: North America 4K Video Player Revenue Share (%), by Types 2025 & 2033
- Figure 10: North America 4K Video Player Volume Share (%), by Types 2025 & 2033
- Figure 11: North America 4K Video Player Revenue (billion), by Country 2025 & 2033
- Figure 12: North America 4K Video Player Volume (K), by Country 2025 & 2033
- Figure 13: North America 4K Video Player Revenue Share (%), by Country 2025 & 2033
- Figure 14: North America 4K Video Player Volume Share (%), by Country 2025 & 2033
- Figure 15: South America 4K Video Player Revenue (billion), by Application 2025 & 2033
- Figure 16: South America 4K Video Player Volume (K), by Application 2025 & 2033
- Figure 17: South America 4K Video Player Revenue Share (%), by Application 2025 & 2033
- Figure 18: South America 4K Video Player Volume Share (%), by Application 2025 & 2033
- Figure 19: South America 4K Video Player Revenue (billion), by Types 2025 & 2033
- Figure 20: South America 4K Video Player Volume (K), by Types 2025 & 2033
- Figure 21: South America 4K Video Player Revenue Share (%), by Types 2025 & 2033
- Figure 22: South America 4K Video Player Volume Share (%), by Types 2025 & 2033
- Figure 23: South America 4K Video Player Revenue (billion), by Country 2025 & 2033
- Figure 24: South America 4K Video Player Volume (K), by Country 2025 & 2033
- Figure 25: South America 4K Video Player Revenue Share (%), by Country 2025 & 2033
- Figure 26: South America 4K Video Player Volume Share (%), by Country 2025 & 2033
- Figure 27: Europe 4K Video Player Revenue (billion), by Application 2025 & 2033
- Figure 28: Europe 4K Video Player Volume (K), by Application 2025 & 2033
- Figure 29: Europe 4K Video Player Revenue Share (%), by Application 2025 & 2033
- Figure 30: Europe 4K Video Player Volume Share (%), by Application 2025 & 2033
- Figure 31: Europe 4K Video Player Revenue (billion), by Types 2025 & 2033
- Figure 32: Europe 4K Video Player Volume (K), by Types 2025 & 2033
- Figure 33: Europe 4K Video Player Revenue Share (%), by Types 2025 & 2033
- Figure 34: Europe 4K Video Player Volume Share (%), by Types 2025 & 2033
- Figure 35: Europe 4K Video Player Revenue (billion), by Country 2025 & 2033
- Figure 36: Europe 4K Video Player Volume (K), by Country 2025 & 2033
- Figure 37: Europe 4K Video Player Revenue Share (%), by Country 2025 & 2033
- Figure 38: Europe 4K Video Player Volume Share (%), by Country 2025 & 2033
- Figure 39: Middle East & Africa 4K Video Player Revenue (billion), by Application 2025 & 2033
- Figure 40: Middle East & Africa 4K Video Player Volume (K), by Application 2025 & 2033
- Figure 41: Middle East & Africa 4K Video Player Revenue Share (%), by Application 2025 & 2033
- Figure 42: Middle East & Africa 4K Video Player Volume Share (%), by Application 2025 & 2033
- Figure 43: Middle East & Africa 4K Video Player Revenue (billion), by Types 2025 & 2033
- Figure 44: Middle East & Africa 4K Video Player Volume (K), by Types 2025 & 2033
- Figure 45: Middle East & Africa 4K Video Player Revenue Share (%), by Types 2025 & 2033
- Figure 46: Middle East & Africa 4K Video Player Volume Share (%), by Types 2025 & 2033
- Figure 47: Middle East & Africa 4K Video Player Revenue (billion), by Country 2025 & 2033
- Figure 48: Middle East & Africa 4K Video Player Volume (K), by Country 2025 & 2033
- Figure 49: Middle East & Africa 4K Video Player Revenue Share (%), by Country 2025 & 2033
- Figure 50: Middle East & Africa 4K Video Player Volume Share (%), by Country 2025 & 2033
- Figure 51: Asia Pacific 4K Video Player Revenue (billion), by Application 2025 & 2033
- Figure 52: Asia Pacific 4K Video Player Volume (K), by Application 2025 & 2033
- Figure 53: Asia Pacific 4K Video Player Revenue Share (%), by Application 2025 & 2033
- Figure 54: Asia Pacific 4K Video Player Volume Share (%), by Application 2025 & 2033
- Figure 55: Asia Pacific 4K Video Player Revenue (billion), by Types 2025 & 2033
- Figure 56: Asia Pacific 4K Video Player Volume (K), by Types 2025 & 2033
- Figure 57: Asia Pacific 4K Video Player Revenue Share (%), by Types 2025 & 2033
- Figure 58: Asia Pacific 4K Video Player Volume Share (%), by Types 2025 & 2033
- Figure 59: Asia Pacific 4K Video Player Revenue (billion), by Country 2025 & 2033
- Figure 60: Asia Pacific 4K Video Player Volume (K), by Country 2025 & 2033
- Figure 61: Asia Pacific 4K Video Player Revenue Share (%), by Country 2025 & 2033
- Figure 62: Asia Pacific 4K Video Player Volume Share (%), by Country 2025 & 2033
List of Tables
- Table 1: Global 4K Video Player Revenue billion Forecast, by Application 2020 & 2033
- Table 2: Global 4K Video Player Volume K Forecast, by Application 2020 & 2033
- Table 3: Global 4K Video Player Revenue billion Forecast, by Types 2020 & 2033
- Table 4: Global 4K Video Player Volume K Forecast, by Types 2020 & 2033
- Table 5: Global 4K Video Player Revenue billion Forecast, by Region 2020 & 2033
- Table 6: Global 4K Video Player Volume K Forecast, by Region 2020 & 2033
- Table 7: Global 4K Video Player Revenue billion Forecast, by Application 2020 & 2033
- Table 8: Global 4K Video Player Volume K Forecast, by Application 2020 & 2033
- Table 9: Global 4K Video Player Revenue billion Forecast, by Types 2020 & 2033
- Table 10: Global 4K Video Player Volume K Forecast, by Types 2020 & 2033
- Table 11: Global 4K Video Player Revenue billion Forecast, by Country 2020 & 2033
- Table 12: Global 4K Video Player Volume K Forecast, by Country 2020 & 2033
- Table 13: United States 4K Video Player Revenue (billion) Forecast, by Application 2020 & 2033
- Table 14: United States 4K Video Player Volume (K) Forecast, by Application 2020 & 2033
- Table 15: Canada 4K Video Player Revenue (billion) Forecast, by Application 2020 & 2033
- Table 16: Canada 4K Video Player Volume (K) Forecast, by Application 2020 & 2033
- Table 17: Mexico 4K Video Player Revenue (billion) Forecast, by Application 2020 & 2033
- Table 18: Mexico 4K Video Player Volume (K) Forecast, by Application 2020 & 2033
- Table 19: Global 4K Video Player Revenue billion Forecast, by Application 2020 & 2033
- Table 20: Global 4K Video Player Volume K Forecast, by Application 2020 & 2033
- Table 21: Global 4K Video Player Revenue billion Forecast, by Types 2020 & 2033
- Table 22: Global 4K Video Player Volume K Forecast, by Types 2020 & 2033
- Table 23: Global 4K Video Player Revenue billion Forecast, by Country 2020 & 2033
- Table 24: Global 4K Video Player Volume K Forecast, by Country 2020 & 2033
- Table 25: Brazil 4K Video Player Revenue (billion) Forecast, by Application 2020 & 2033
- Table 26: Brazil 4K Video Player Volume (K) Forecast, by Application 2020 & 2033
- Table 27: Argentina 4K Video Player Revenue (billion) Forecast, by Application 2020 & 2033
- Table 28: Argentina 4K Video Player Volume (K) Forecast, by Application 2020 & 2033
- Table 29: Rest of South America 4K Video Player Revenue (billion) Forecast, by Application 2020 & 2033
- Table 30: Rest of South America 4K Video Player Volume (K) Forecast, by Application 2020 & 2033
- Table 31: Global 4K Video Player Revenue billion Forecast, by Application 2020 & 2033
- Table 32: Global 4K Video Player Volume K Forecast, by Application 2020 & 2033
- Table 33: Global 4K Video Player Revenue billion Forecast, by Types 2020 & 2033
- Table 34: Global 4K Video Player Volume K Forecast, by Types 2020 & 2033
- Table 35: Global 4K Video Player Revenue billion Forecast, by Country 2020 & 2033
- Table 36: Global 4K Video Player Volume K Forecast, by Country 2020 & 2033
- Table 37: United Kingdom 4K Video Player Revenue (billion) Forecast, by Application 2020 & 2033
- Table 38: United Kingdom 4K Video Player Volume (K) Forecast, by Application 2020 & 2033
- Table 39: Germany 4K Video Player Revenue (billion) Forecast, by Application 2020 & 2033
- Table 40: Germany 4K Video Player Volume (K) Forecast, by Application 2020 & 2033
- Table 41: France 4K Video Player Revenue (billion) Forecast, by Application 2020 & 2033
- Table 42: France 4K Video Player Volume (K) Forecast, by Application 2020 & 2033
- Table 43: Italy 4K Video Player Revenue (billion) Forecast, by Application 2020 & 2033
- Table 44: Italy 4K Video Player Volume (K) Forecast, by Application 2020 & 2033
- Table 45: Spain 4K Video Player Revenue (billion) Forecast, by Application 2020 & 2033
- Table 46: Spain 4K Video Player Volume (K) Forecast, by Application 2020 & 2033
- Table 47: Russia 4K Video Player Revenue (billion) Forecast, by Application 2020 & 2033
- Table 48: Russia 4K Video Player Volume (K) Forecast, by Application 2020 & 2033
- Table 49: Benelux 4K Video Player Revenue (billion) Forecast, by Application 2020 & 2033
- Table 50: Benelux 4K Video Player Volume (K) Forecast, by Application 2020 & 2033
- Table 51: Nordics 4K Video Player Revenue (billion) Forecast, by Application 2020 & 2033
- Table 52: Nordics 4K Video Player Volume (K) Forecast, by Application 2020 & 2033
- Table 53: Rest of Europe 4K Video Player Revenue (billion) Forecast, by Application 2020 & 2033
- Table 54: Rest of Europe 4K Video Player Volume (K) Forecast, by Application 2020 & 2033
- Table 55: Global 4K Video Player Revenue billion Forecast, by Application 2020 & 2033
- Table 56: Global 4K Video Player Volume K Forecast, by Application 2020 & 2033
- Table 57: Global 4K Video Player Revenue billion Forecast, by Types 2020 & 2033
- Table 58: Global 4K Video Player Volume K Forecast, by Types 2020 & 2033
- Table 59: Global 4K Video Player Revenue billion Forecast, by Country 2020 & 2033
- Table 60: Global 4K Video Player Volume K Forecast, by Country 2020 & 2033
- Table 61: Turkey 4K Video Player Revenue (billion) Forecast, by Application 2020 & 2033
- Table 62: Turkey 4K Video Player Volume (K) Forecast, by Application 2020 & 2033
- Table 63: Israel 4K Video Player Revenue (billion) Forecast, by Application 2020 & 2033
- Table 64: Israel 4K Video Player Volume (K) Forecast, by Application 2020 & 2033
- Table 65: GCC 4K Video Player Revenue (billion) Forecast, by Application 2020 & 2033
- Table 66: GCC 4K Video Player Volume (K) Forecast, by Application 2020 & 2033
- Table 67: North Africa 4K Video Player Revenue (billion) Forecast, by Application 2020 & 2033
- Table 68: North Africa 4K Video Player Volume (K) Forecast, by Application 2020 & 2033
- Table 69: South Africa 4K Video Player Revenue (billion) Forecast, by Application 2020 & 2033
- Table 70: South Africa 4K Video Player Volume (K) Forecast, by Application 2020 & 2033
- Table 71: Rest of Middle East & Africa 4K Video Player Revenue (billion) Forecast, by Application 2020 & 2033
- Table 72: Rest of Middle East & Africa 4K Video Player Volume (K) Forecast, by Application 2020 & 2033
- Table 73: Global 4K Video Player Revenue billion Forecast, by Application 2020 & 2033
- Table 74: Global 4K Video Player Volume K Forecast, by Application 2020 & 2033
- Table 75: Global 4K Video Player Revenue billion Forecast, by Types 2020 & 2033
- Table 76: Global 4K Video Player Volume K Forecast, by Types 2020 & 2033
- Table 77: Global 4K Video Player Revenue billion Forecast, by Country 2020 & 2033
- Table 78: Global 4K Video Player Volume K Forecast, by Country 2020 & 2033
- Table 79: China 4K Video Player Revenue (billion) Forecast, by Application 2020 & 2033
- Table 80: China 4K Video Player Volume (K) Forecast, by Application 2020 & 2033
- Table 81: India 4K Video Player Revenue (billion) Forecast, by Application 2020 & 2033
- Table 82: India 4K Video Player Volume (K) Forecast, by Application 2020 & 2033
- Table 83: Japan 4K Video Player Revenue (billion) Forecast, by Application 2020 & 2033
- Table 84: Japan 4K Video Player Volume (K) Forecast, by Application 2020 & 2033
- Table 85: South Korea 4K Video Player Revenue (billion) Forecast, by Application 2020 & 2033
- Table 86: South Korea 4K Video Player Volume (K) Forecast, by Application 2020 & 2033
- Table 87: ASEAN 4K Video Player Revenue (billion) Forecast, by Application 2020 & 2033
- Table 88: ASEAN 4K Video Player Volume (K) Forecast, by Application 2020 & 2033
- Table 89: Oceania 4K Video Player Revenue (billion) Forecast, by Application 2020 & 2033
- Table 90: Oceania 4K Video Player Volume (K) Forecast, by Application 2020 & 2033
- Table 91: Rest of Asia Pacific 4K Video Player Revenue (billion) Forecast, by Application 2020 & 2033
- Table 92: Rest of Asia Pacific 4K Video Player Volume (K) Forecast, by Application 2020 & 2033
Frequently Asked Questions
1. What is the projected Compound Annual Growth Rate (CAGR) of the 4K Video Player?
The projected CAGR is approximately 7.4%.
2. Which companies are prominent players in the 4K Video Player?
Key companies in the market include Apple, LG, Sony, Samsung, Vizio, TCL, Hisense, Sharp, Panasonic, JVC, WINHI, Haloview, Navori Labs, BrightSign.
3. What are the main segments of the 4K Video Player?
The market segments include Application, Types.
4. Can you provide details about the market size?
The market size is estimated to be USD 24.8 billion as of 2022.
5. What are some drivers contributing to market growth?
N/A
6. What are the notable trends driving market growth?
N/A
7. Are there any restraints impacting market growth?
N/A
8. Can you provide examples of recent developments in the market?
N/A
9. What pricing options are available for accessing the report?
Pricing options include single-user, multi-user, and enterprise licenses priced at USD 3350.00, USD 5025.00, and USD 6700.00 respectively.
10. Is the market size provided in terms of value or volume?
The market size is provided in terms of value, measured in billion and volume, measured in K.
11. Are there any specific market keywords associated with the report?
Yes, the market keyword associated with the report is "4K Video Player," which aids in identifying and referencing the specific market segment covered.
12. How do I determine which pricing option suits my needs best?
The pricing options vary based on user requirements and access needs. Individual users may opt for single-user licenses, while businesses requiring broader access may choose multi-user or enterprise licenses for cost-effective access to the report.
13. Are there any additional resources or data provided in the 4K Video Player report?
While the report offers comprehensive insights, it's advisable to review the specific contents or supplementary materials provided to ascertain if additional resources or data are available.
14. How can I stay updated on further developments or reports in the 4K Video Player?
To stay informed about further developments, trends, and reports in the 4K Video Player, consider subscribing to industry newsletters, following relevant companies and organizations, or regularly checking reputable industry news sources and publications.
Methodology
Step 1 - Identification of Relevant Samples Size from Population Database


Step 2 - Approaches for Defining Global Market Size (Value, Volume* & Price*)

Note*: In applicable scenarios
Step 3 - Data Sources
Primary Research
- Web Analytics
- Survey Reports
- Research Institute
- Latest Research Reports
- Opinion Leaders
Secondary Research
- Annual Reports
- White Paper
- Latest Press Release
- Industry Association
- Paid Database
- Investor Presentations

Step 4 - Data Triangulation
Involves using different sources of information in order to increase the validity of a study
These sources are likely to be stakeholders in a program - participants, other researchers, program staff, other community members, and so on.
Then we put all data in single framework & apply various statistical tools to find out the dynamic on the market.
During the analysis stage, feedback from the stakeholder groups would be compared to determine areas of agreement as well as areas of divergence