Key Insights
The global 10 Gigabit Ethernet Interface Module market is poised for substantial expansion, projected to reach an estimated market size of approximately $7.8 billion by 2025, with a robust Compound Annual Growth Rate (CAGR) of 12.5%. This impressive growth trajectory is primarily fueled by the escalating demand for higher bandwidth and faster data transmission across a multitude of sectors. The burgeoning Internet of Things (IoT) ecosystem, with its ever-increasing number of connected devices generating vast amounts of data, is a significant driver. Similarly, the relentless advancement in scientific research, particularly in fields like high-performance computing and big data analytics, necessitates the superior capabilities offered by 10 Gigabit Ethernet modules. Furthermore, the widespread adoption of cloud computing and the expansion of data center infrastructure worldwide are creating a continuous need for high-speed networking solutions, directly benefiting the market.
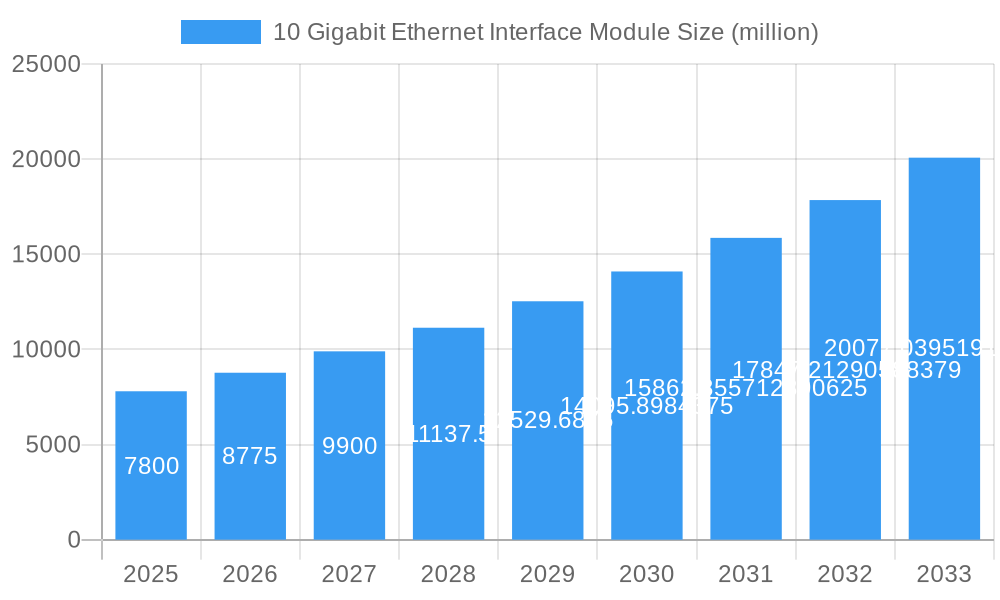
10 Gigabit Ethernet Interface Module Market Size (In Billion)
The market landscape is further shaped by key trends such as the increasing integration of advanced features like Software-Defined Networking (SDN) compatibility and enhanced security protocols within these modules. The development of more cost-effective and power-efficient solutions is also a critical focus for manufacturers, addressing potential market restraints related to affordability and energy consumption. Geographically, Asia Pacific, led by China and India, is expected to emerge as a dominant region, driven by rapid industrialization, significant investments in digital infrastructure, and a growing number of tech-savvy businesses. North America and Europe also represent mature yet expanding markets, with substantial adoption in enterprise networks and data centers. Key players like Cisco Systems, Intel, and Huawei are actively innovating, introducing new product lines and strategic partnerships to capture market share and address the evolving needs of their diverse customer base across applications ranging from communications and IoT to scientific research.
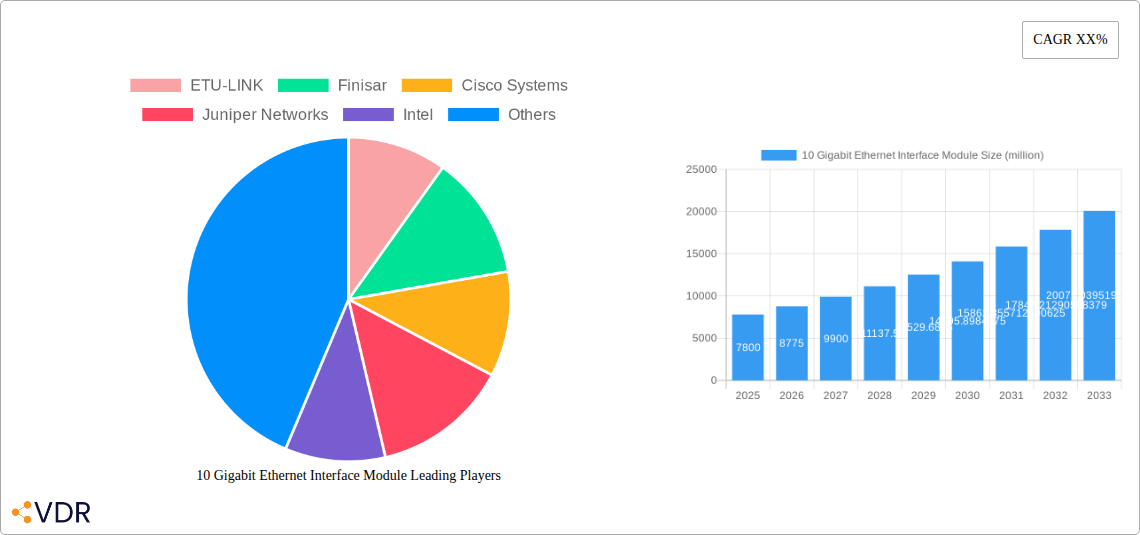
10 Gigabit Ethernet Interface Module Company Market Share
10 Gigabit Ethernet Interface Module Market Dynamics & Structure
The 10 Gigabit Ethernet Interface Module market is characterized by a moderate level of concentration, with key players like Cisco Systems, Juniper Networks, Intel, and Broadcom holding significant market shares. Technological innovation remains a primary driver, fueled by the escalating demand for higher bandwidth in data centers, enterprise networks, and telecommunications infrastructure. Emerging advancements in optical transceiver technology and integrated circuit design are pushing the performance envelope and reducing the cost per gigabit. Regulatory frameworks, while generally supportive of network infrastructure upgrades, can introduce compliance challenges related to interoperability and environmental standards. Competitive product substitutes, though less prevalent at the 10GbE speed, include lower-speed Ethernet options and alternative networking technologies for specific niche applications. End-user demographics are increasingly diverse, encompassing cloud service providers, large enterprises, telecommunications operators, and research institutions, all seeking enhanced connectivity. Mergers and acquisitions (M&A) trends are evident, as larger players acquire smaller, innovative companies to expand their product portfolios and market reach. For instance, recent M&A activity has focused on acquiring companies with expertise in advanced optical components and high-speed networking solutions.
- Market Concentration: Moderate, with a few dominant players.
- Technological Innovation Drivers: Demand for higher bandwidth, advancements in optical transceivers, integrated circuit design.
- Regulatory Frameworks: Generally supportive, but with compliance considerations.
- Competitive Product Substitutes: Lower-speed Ethernet, niche networking alternatives.
- End-User Demographics: Cloud providers, enterprises, telcos, research institutions.
- M&A Trends: Acquisitions of specialized technology firms.
10 Gigabit Ethernet Interface Module Growth Trends & Insights
The 10 Gigabit Ethernet Interface Module market is poised for robust growth, driven by an insatiable appetite for faster and more efficient data transfer across all sectors. The market size evolution is projected to witness a significant upward trajectory, transitioning from an estimated $15.2 billion in 2025 to an impressive $30.5 billion by 2033, indicating a Compound Annual Growth Rate (CAGR) of approximately 9.2% during the forecast period. This expansion is underpinned by increasing adoption rates across a spectrum of applications, from core networking in hyperscale data centers to enabling high-speed connections for the burgeoning Internet of Things (IoT) ecosystem and facilitating complex simulations in scientific research.
Technological disruptions, such as the continuous miniaturization of components and the development of more energy-efficient modules, are further accelerating this trend. The shift towards software-defined networking (SDN) and network function virtualization (NFV) also necessitates higher-performance physical interfaces, creating a sustained demand for 10GbE modules. Consumer behavior shifts, while less direct for interface modules, manifest in the demand for richer digital experiences, faster cloud services, and seamless connectivity, all of which rely on underlying network infrastructure upgrades. Market penetration for 10GbE technology is expected to deepen, moving beyond core enterprise and data center deployments to penetrate more edge computing environments and specialized industrial applications. The increasing prevalence of 4K/8K video streaming, augmented reality (AR), and virtual reality (VR) applications also contributes to the demand for higher bandwidth, directly benefiting the 10 Gigabit Ethernet Interface Module market.
The transition from legacy infrastructure to next-generation networks is a critical factor, with organizations actively upgrading their network backbones to accommodate the ever-growing data traffic. This includes the widespread deployment of 10GbE in server connections, storage area networks (SANs), and inter-switch links. The increasing adoption of AI and machine learning, which require massive datasets for training and inference, further fuels the need for high-speed data transfer capabilities. The cost-effectiveness and established ecosystem of Ethernet technology make 10GbE a compelling choice for these demanding applications. Furthermore, the ongoing digital transformation initiatives across various industries are pushing the boundaries of what's possible with data connectivity, making the role of high-performance interface modules indispensable.
Dominant Regions, Countries, or Segments in 10 Gigabit Ethernet Interface Module
The Communications segment, particularly within the Application category, is the undisputed leader driving growth in the 10 Gigabit Ethernet Interface Module market. This dominance stems from the foundational role of high-speed networking in modern telecommunications infrastructure, including mobile backhaul, fixed-line broadband, and the expansion of 5G networks. The relentless demand for increased bandwidth to support the ever-growing volume of data traffic generated by billions of connected devices, coupled with the rollout of next-generation wireless technologies, makes this segment a critical growth engine.
Within the Communications segment, specific areas like enterprise networking and data center interconnects are experiencing substantial adoption. Companies like Cisco Systems and Juniper Networks are key enablers of this growth, providing the core networking hardware that leverages these high-performance interface modules. The sheer volume of data flowing through carrier networks, internet service providers (ISPs), and content delivery networks (CDNs) necessitates the widespread deployment of 10GbE to ensure seamless and efficient data transmission.
Geographically, North America and Asia Pacific are emerging as dominant regions, driven by substantial investments in digital infrastructure, the presence of major technology companies, and the rapid adoption of advanced networking solutions.
- Communications Segment:
- Key Drivers: 5G network expansion, mobile backhaul, fixed-line broadband upgrades, enterprise network modernization, data center interconnects.
- Market Share: Holds the largest market share within the application segments.
- Growth Potential: High, fueled by ongoing digital transformation and data traffic growth.
- RJ45 Module Type:
- Key Drivers: Widespread compatibility with existing copper cabling infrastructure, cost-effectiveness for shorter reaches, ease of deployment in enterprise environments.
- Market Share: Significant market share, especially in enterprise and data center edge deployments.
- Growth Potential: Sustained growth, particularly for in-rack server connectivity and desktop access.
- North America & Asia Pacific Regions:
- Key Drivers: Significant investments in digital infrastructure, presence of major technology hubs, rapid adoption of cloud computing and IoT.
- Market Share: Leading market share in terms of revenue and unit shipments.
- Growth Potential: Continual expansion driven by technological innovation and increasing data demands.
The RJ45 Module type within the Types category also plays a crucial role. Its widespread compatibility with established copper cabling infrastructure makes it a cost-effective and readily deployable solution for many enterprise and data center edge applications, contributing significantly to the overall market volume.
10 Gigabit Ethernet Interface Module Product Landscape
The 10 Gigabit Ethernet Interface Module product landscape is defined by continuous innovation in transceiver technology, form factors, and power efficiency. Modules such as the SFP+ (Small Form-Factor Pluggable Plus) and the ubiquitous RJ45 offer versatile connectivity options for a wide range of network devices. Advancements are focused on increasing reach, reducing latency, and enhancing signal integrity, enabling seamless data transfer over various media, including fiber optic and copper cables. These modules are critical components in high-performance networking equipment from leading vendors like ETU-LINK, Finisar, and Broadcom, powering everything from hyperscale data centers to enterprise server rooms. Unique selling propositions include plug-and-play functionality, hot-swappable capabilities, and compliance with industry standards, ensuring interoperability and ease of integration.
Key Drivers, Barriers & Challenges in 10 Gigabit Ethernet Interface Module
Key Drivers:
The 10 Gigabit Ethernet Interface Module market is propelled by the insatiable demand for higher bandwidth driven by cloud computing adoption, big data analytics, and the proliferation of IoT devices. The ongoing digital transformation across industries necessitates robust network infrastructure, making 10GbE a crucial component. Advancements in optical and networking technologies, such as improved transceiver efficiency and smaller form factors, further drive adoption. Government initiatives supporting digital infrastructure development and the growing need for faster data transfer in scientific research and high-performance computing also contribute significantly.
Barriers & Challenges:
Despite strong growth, the market faces challenges. The increasing complexity of network deployments can pose integration hurdles. While the cost of 10GbE has decreased, the initial capital expenditure for widespread upgrades can be a barrier for some smaller organizations. Supply chain disruptions, particularly for critical components like optical transceivers, can impact availability and pricing. Furthermore, the emergence of even higher speed Ethernet standards (e.g., 25GbE, 40GbE, 100GbE) presents a competitive challenge, though 10GbE remains a dominant force for many applications due to its balance of performance and cost. Regulatory compliance and interoperability standards also require continuous attention.
Emerging Opportunities in 10 Gigabit Ethernet Interface Module
Emerging opportunities lie in the increasing demand for 10GbE in edge computing environments, where low latency and high bandwidth are critical for real-time data processing. The expansion of smart cities and industrial IoT (IIoT) applications presents a significant untapped market for robust and reliable network connectivity. Furthermore, the development of specialized 10GbE modules designed for harsh industrial environments or specific telecommunications use cases offers niche growth avenues. The growing adoption of AI and machine learning at the edge also necessitates high-speed data handling, creating further demand for advanced interface modules.
Growth Accelerators in the 10 Gigabit Ethernet Interface Module Industry
Technological breakthroughs in transceiver miniaturization and power efficiency are key growth accelerators, enabling more cost-effective and dense deployments. Strategic partnerships between module manufacturers and networking equipment vendors, like those between Broadcom and Nvidia, are crucial for integrating cutting-edge solutions into broader product offerings. Market expansion strategies targeting emerging economies and specific industry verticals, such as healthcare and finance, are also fueling long-term growth. The continued evolution of Ethernet standards and the ongoing need for network upgrades across all sectors will persistently drive demand for 10 Gigabit Ethernet Interface Modules.
Key Players Shaping the 10 Gigabit Ethernet Interface Module Market
- ETU-LINK
- Finisar
- Cisco Systems
- Juniper Networks
- Intel
- Arista Networks
- Dell EMC
- Broadcom
- Nvidia
- Hewlett Packard Enterprise
- Huawei
- Extreme Networks
Notable Milestones in 10 Gigabit Ethernet Interface Module Sector
- 2019: Widespread adoption of 10GbE SFP+ modules in enterprise data centers for server and switch connectivity.
- 2020: Increased focus on cost optimization and power efficiency for 10GbE modules to meet growing data center demands.
- 2021: Growth in demand for 10GbE RJ45 modules for enhanced desktop connectivity and lab environments.
- 2022: Advancements in copper-based 10GbE solutions, offering competitive alternatives for shorter distances.
- 2023: Integration of 10GbE into networking solutions for emerging IoT and edge computing applications.
- 2024: Continued innovation in optical transceiver technology, leading to higher density and improved performance of 10GbE modules.
In-Depth 10 Gigabit Ethernet Interface Module Market Outlook
The future of the 10 Gigabit Ethernet Interface Module market is exceptionally bright, driven by sustained demand from core networking applications and expanding into newer frontiers like edge computing and advanced IoT. Growth accelerators, including ongoing technological innovations, strategic alliances between key players, and proactive market expansion efforts, will continue to propel the industry forward. The market's ability to offer a compelling balance of performance, cost-effectiveness, and broad compatibility ensures its relevance for the foreseeable future. Strategic opportunities abound in catering to the evolving needs of data-intensive industries and supporting the infrastructure for next-generation digital services, solidifying 10GbE's position as a vital networking component.
10 Gigabit Ethernet Interface Module Segmentation
-
1. Application
- 1.1. Communications
- 1.2. Internet of Things
- 1.3. Scientific Research
- 1.4. Others
-
2. Types
- 2.1. RJ45 Module
- 2.2. SFP+ Module
- 2.3. Others
10 Gigabit Ethernet Interface Module Segmentation By Geography
-
1. North America
- 1.1. United States
- 1.2. Canada
- 1.3. Mexico
-
2. South America
- 2.1. Brazil
- 2.2. Argentina
- 2.3. Rest of South America
-
3. Europe
- 3.1. United Kingdom
- 3.2. Germany
- 3.3. France
- 3.4. Italy
- 3.5. Spain
- 3.6. Russia
- 3.7. Benelux
- 3.8. Nordics
- 3.9. Rest of Europe
-
4. Middle East & Africa
- 4.1. Turkey
- 4.2. Israel
- 4.3. GCC
- 4.4. North Africa
- 4.5. South Africa
- 4.6. Rest of Middle East & Africa
-
5. Asia Pacific
- 5.1. China
- 5.2. India
- 5.3. Japan
- 5.4. South Korea
- 5.5. ASEAN
- 5.6. Oceania
- 5.7. Rest of Asia Pacific
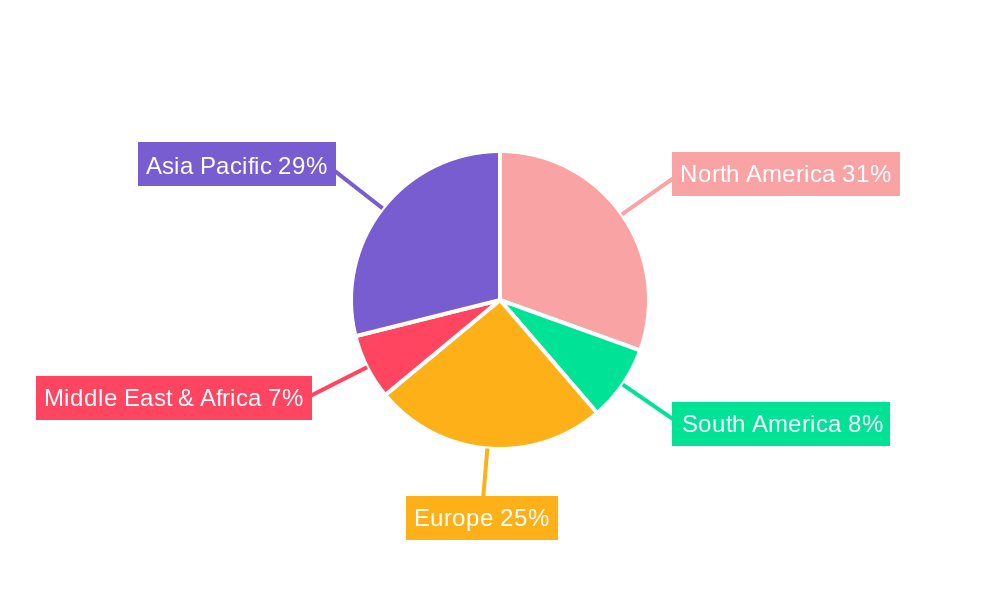
10 Gigabit Ethernet Interface Module Regional Market Share
Geographic Coverage of 10 Gigabit Ethernet Interface Module
10 Gigabit Ethernet Interface Module REPORT HIGHLIGHTS
| Aspects | Details |
|---|---|
| Study Period | 2020-2034 |
| Base Year | 2025 |
| Estimated Year | 2026 |
| Forecast Period | 2026-2034 |
| Historical Period | 2020-2025 |
| Growth Rate | CAGR of 6.48% from 2020-2034 |
| Segmentation |
|
Table of Contents
- 1. Introduction
- 1.1. Research Scope
- 1.2. Market Segmentation
- 1.3. Research Objective
- 1.4. Definitions and Assumptions
- 2. Executive Summary
- 2.1. Market Snapshot
- 3. Market Dynamics
- 3.1. Market Drivers
- 3.2. Market Restrains
- 3.3. Market Trends
- 3.4. Market Opportunities
- 4. Market Factor Analysis
- 4.1. Porters Five Forces
- 4.1.1. Bargaining Power of Suppliers
- 4.1.2. Bargaining Power of Buyers
- 4.1.3. Threat of New Entrants
- 4.1.4. Threat of Substitutes
- 4.1.5. Competitive Rivalry
- 4.2. PESTEL analysis
- 4.3. BCG Analysis
- 4.3.1. Stars (High Growth, High Market Share)
- 4.3.2. Cash Cows (Low Growth, High Market Share)
- 4.3.3. Question Mark (High Growth, Low Market Share)
- 4.3.4. Dogs (Low Growth, Low Market Share)
- 4.4. Ansoff Matrix Analysis
- 4.5. Supply Chain Analysis
- 4.6. Regulatory Landscape
- 4.7. Current Market Potential and Opportunity Assessment (TAM–SAM–SOM Framework)
- 4.8. VDR Analyst Note
- 4.1. Porters Five Forces
- 5. Market Analysis, Insights and Forecast 2021-2033
- 5.1. Market Analysis, Insights and Forecast - by Application
- 5.1.1. Communications
- 5.1.2. Internet of Things
- 5.1.3. Scientific Research
- 5.1.4. Others
- 5.2. Market Analysis, Insights and Forecast - by Types
- 5.2.1. RJ45 Module
- 5.2.2. SFP+ Module
- 5.2.3. Others
- 5.3. Market Analysis, Insights and Forecast - by Region
- 5.3.1. North America
- 5.3.2. South America
- 5.3.3. Europe
- 5.3.4. Middle East & Africa
- 5.3.5. Asia Pacific
- 5.1. Market Analysis, Insights and Forecast - by Application
- 6. Global 10 Gigabit Ethernet Interface Module Analysis, Insights and Forecast, 2021-2033
- 6.1. Market Analysis, Insights and Forecast - by Application
- 6.1.1. Communications
- 6.1.2. Internet of Things
- 6.1.3. Scientific Research
- 6.1.4. Others
- 6.2. Market Analysis, Insights and Forecast - by Types
- 6.2.1. RJ45 Module
- 6.2.2. SFP+ Module
- 6.2.3. Others
- 6.1. Market Analysis, Insights and Forecast - by Application
- 7. North America 10 Gigabit Ethernet Interface Module Analysis, Insights and Forecast, 2021-2033
- 7.1. Market Analysis, Insights and Forecast - by Application
- 7.1.1. Communications
- 7.1.2. Internet of Things
- 7.1.3. Scientific Research
- 7.1.4. Others
- 7.2. Market Analysis, Insights and Forecast - by Types
- 7.2.1. RJ45 Module
- 7.2.2. SFP+ Module
- 7.2.3. Others
- 7.1. Market Analysis, Insights and Forecast - by Application
- 8. South America 10 Gigabit Ethernet Interface Module Analysis, Insights and Forecast, 2021-2033
- 8.1. Market Analysis, Insights and Forecast - by Application
- 8.1.1. Communications
- 8.1.2. Internet of Things
- 8.1.3. Scientific Research
- 8.1.4. Others
- 8.2. Market Analysis, Insights and Forecast - by Types
- 8.2.1. RJ45 Module
- 8.2.2. SFP+ Module
- 8.2.3. Others
- 8.1. Market Analysis, Insights and Forecast - by Application
- 9. Europe 10 Gigabit Ethernet Interface Module Analysis, Insights and Forecast, 2021-2033
- 9.1. Market Analysis, Insights and Forecast - by Application
- 9.1.1. Communications
- 9.1.2. Internet of Things
- 9.1.3. Scientific Research
- 9.1.4. Others
- 9.2. Market Analysis, Insights and Forecast - by Types
- 9.2.1. RJ45 Module
- 9.2.2. SFP+ Module
- 9.2.3. Others
- 9.1. Market Analysis, Insights and Forecast - by Application
- 10. Middle East & Africa 10 Gigabit Ethernet Interface Module Analysis, Insights and Forecast, 2021-2033
- 10.1. Market Analysis, Insights and Forecast - by Application
- 10.1.1. Communications
- 10.1.2. Internet of Things
- 10.1.3. Scientific Research
- 10.1.4. Others
- 10.2. Market Analysis, Insights and Forecast - by Types
- 10.2.1. RJ45 Module
- 10.2.2. SFP+ Module
- 10.2.3. Others
- 10.1. Market Analysis, Insights and Forecast - by Application
- 11. Asia Pacific 10 Gigabit Ethernet Interface Module Analysis, Insights and Forecast, 2021-2033
- 11.1. Market Analysis, Insights and Forecast - by Application
- 11.1.1. Communications
- 11.1.2. Internet of Things
- 11.1.3. Scientific Research
- 11.1.4. Others
- 11.2. Market Analysis, Insights and Forecast - by Types
- 11.2.1. RJ45 Module
- 11.2.2. SFP+ Module
- 11.2.3. Others
- 11.1. Market Analysis, Insights and Forecast - by Application
- 12. Competitive Analysis
- 12.1. Company Profiles
- 12.1.1 ETU-LINK
- 12.1.1.1. Company Overview
- 12.1.1.2. Products
- 12.1.1.3. Company Financials
- 12.1.1.4. SWOT Analysis
- 12.1.2 Finisar
- 12.1.2.1. Company Overview
- 12.1.2.2. Products
- 12.1.2.3. Company Financials
- 12.1.2.4. SWOT Analysis
- 12.1.3 Cisco Systems
- 12.1.3.1. Company Overview
- 12.1.3.2. Products
- 12.1.3.3. Company Financials
- 12.1.3.4. SWOT Analysis
- 12.1.4 Juniper Networks
- 12.1.4.1. Company Overview
- 12.1.4.2. Products
- 12.1.4.3. Company Financials
- 12.1.4.4. SWOT Analysis
- 12.1.5 Intel
- 12.1.5.1. Company Overview
- 12.1.5.2. Products
- 12.1.5.3. Company Financials
- 12.1.5.4. SWOT Analysis
- 12.1.6 Arista Networks
- 12.1.6.1. Company Overview
- 12.1.6.2. Products
- 12.1.6.3. Company Financials
- 12.1.6.4. SWOT Analysis
- 12.1.7 Dell EMC
- 12.1.7.1. Company Overview
- 12.1.7.2. Products
- 12.1.7.3. Company Financials
- 12.1.7.4. SWOT Analysis
- 12.1.8 Broadcom
- 12.1.8.1. Company Overview
- 12.1.8.2. Products
- 12.1.8.3. Company Financials
- 12.1.8.4. SWOT Analysis
- 12.1.9 Nvidia
- 12.1.9.1. Company Overview
- 12.1.9.2. Products
- 12.1.9.3. Company Financials
- 12.1.9.4. SWOT Analysis
- 12.1.10 Hewlett Packard Enterprise
- 12.1.10.1. Company Overview
- 12.1.10.2. Products
- 12.1.10.3. Company Financials
- 12.1.10.4. SWOT Analysis
- 12.1.11 Huawei
- 12.1.11.1. Company Overview
- 12.1.11.2. Products
- 12.1.11.3. Company Financials
- 12.1.11.4. SWOT Analysis
- 12.1.12 Extreme Networks
- 12.1.12.1. Company Overview
- 12.1.12.2. Products
- 12.1.12.3. Company Financials
- 12.1.12.4. SWOT Analysis
- 12.1.1 ETU-LINK
- 12.2. Market Entropy
- 12.2.1 Company's Key Areas Served
- 12.2.2 Recent Developments
- 12.3. Company Market Share Analysis 2025
- 12.3.1 Top 5 Companies Market Share Analysis
- 12.3.2 Top 3 Companies Market Share Analysis
- 12.4. List of Potential Customers
- 13. Research Methodology
List of Figures
- Figure 1: Global 10 Gigabit Ethernet Interface Module Revenue Breakdown (undefined, %) by Region 2025 & 2033
- Figure 2: Global 10 Gigabit Ethernet Interface Module Volume Breakdown (K, %) by Region 2025 & 2033
- Figure 3: North America 10 Gigabit Ethernet Interface Module Revenue (undefined), by Application 2025 & 2033
- Figure 4: North America 10 Gigabit Ethernet Interface Module Volume (K), by Application 2025 & 2033
- Figure 5: North America 10 Gigabit Ethernet Interface Module Revenue Share (%), by Application 2025 & 2033
- Figure 6: North America 10 Gigabit Ethernet Interface Module Volume Share (%), by Application 2025 & 2033
- Figure 7: North America 10 Gigabit Ethernet Interface Module Revenue (undefined), by Types 2025 & 2033
- Figure 8: North America 10 Gigabit Ethernet Interface Module Volume (K), by Types 2025 & 2033
- Figure 9: North America 10 Gigabit Ethernet Interface Module Revenue Share (%), by Types 2025 & 2033
- Figure 10: North America 10 Gigabit Ethernet Interface Module Volume Share (%), by Types 2025 & 2033
- Figure 11: North America 10 Gigabit Ethernet Interface Module Revenue (undefined), by Country 2025 & 2033
- Figure 12: North America 10 Gigabit Ethernet Interface Module Volume (K), by Country 2025 & 2033
- Figure 13: North America 10 Gigabit Ethernet Interface Module Revenue Share (%), by Country 2025 & 2033
- Figure 14: North America 10 Gigabit Ethernet Interface Module Volume Share (%), by Country 2025 & 2033
- Figure 15: South America 10 Gigabit Ethernet Interface Module Revenue (undefined), by Application 2025 & 2033
- Figure 16: South America 10 Gigabit Ethernet Interface Module Volume (K), by Application 2025 & 2033
- Figure 17: South America 10 Gigabit Ethernet Interface Module Revenue Share (%), by Application 2025 & 2033
- Figure 18: South America 10 Gigabit Ethernet Interface Module Volume Share (%), by Application 2025 & 2033
- Figure 19: South America 10 Gigabit Ethernet Interface Module Revenue (undefined), by Types 2025 & 2033
- Figure 20: South America 10 Gigabit Ethernet Interface Module Volume (K), by Types 2025 & 2033
- Figure 21: South America 10 Gigabit Ethernet Interface Module Revenue Share (%), by Types 2025 & 2033
- Figure 22: South America 10 Gigabit Ethernet Interface Module Volume Share (%), by Types 2025 & 2033
- Figure 23: South America 10 Gigabit Ethernet Interface Module Revenue (undefined), by Country 2025 & 2033
- Figure 24: South America 10 Gigabit Ethernet Interface Module Volume (K), by Country 2025 & 2033
- Figure 25: South America 10 Gigabit Ethernet Interface Module Revenue Share (%), by Country 2025 & 2033
- Figure 26: South America 10 Gigabit Ethernet Interface Module Volume Share (%), by Country 2025 & 2033
- Figure 27: Europe 10 Gigabit Ethernet Interface Module Revenue (undefined), by Application 2025 & 2033
- Figure 28: Europe 10 Gigabit Ethernet Interface Module Volume (K), by Application 2025 & 2033
- Figure 29: Europe 10 Gigabit Ethernet Interface Module Revenue Share (%), by Application 2025 & 2033
- Figure 30: Europe 10 Gigabit Ethernet Interface Module Volume Share (%), by Application 2025 & 2033
- Figure 31: Europe 10 Gigabit Ethernet Interface Module Revenue (undefined), by Types 2025 & 2033
- Figure 32: Europe 10 Gigabit Ethernet Interface Module Volume (K), by Types 2025 & 2033
- Figure 33: Europe 10 Gigabit Ethernet Interface Module Revenue Share (%), by Types 2025 & 2033
- Figure 34: Europe 10 Gigabit Ethernet Interface Module Volume Share (%), by Types 2025 & 2033
- Figure 35: Europe 10 Gigabit Ethernet Interface Module Revenue (undefined), by Country 2025 & 2033
- Figure 36: Europe 10 Gigabit Ethernet Interface Module Volume (K), by Country 2025 & 2033
- Figure 37: Europe 10 Gigabit Ethernet Interface Module Revenue Share (%), by Country 2025 & 2033
- Figure 38: Europe 10 Gigabit Ethernet Interface Module Volume Share (%), by Country 2025 & 2033
- Figure 39: Middle East & Africa 10 Gigabit Ethernet Interface Module Revenue (undefined), by Application 2025 & 2033
- Figure 40: Middle East & Africa 10 Gigabit Ethernet Interface Module Volume (K), by Application 2025 & 2033
- Figure 41: Middle East & Africa 10 Gigabit Ethernet Interface Module Revenue Share (%), by Application 2025 & 2033
- Figure 42: Middle East & Africa 10 Gigabit Ethernet Interface Module Volume Share (%), by Application 2025 & 2033
- Figure 43: Middle East & Africa 10 Gigabit Ethernet Interface Module Revenue (undefined), by Types 2025 & 2033
- Figure 44: Middle East & Africa 10 Gigabit Ethernet Interface Module Volume (K), by Types 2025 & 2033
- Figure 45: Middle East & Africa 10 Gigabit Ethernet Interface Module Revenue Share (%), by Types 2025 & 2033
- Figure 46: Middle East & Africa 10 Gigabit Ethernet Interface Module Volume Share (%), by Types 2025 & 2033
- Figure 47: Middle East & Africa 10 Gigabit Ethernet Interface Module Revenue (undefined), by Country 2025 & 2033
- Figure 48: Middle East & Africa 10 Gigabit Ethernet Interface Module Volume (K), by Country 2025 & 2033
- Figure 49: Middle East & Africa 10 Gigabit Ethernet Interface Module Revenue Share (%), by Country 2025 & 2033
- Figure 50: Middle East & Africa 10 Gigabit Ethernet Interface Module Volume Share (%), by Country 2025 & 2033
- Figure 51: Asia Pacific 10 Gigabit Ethernet Interface Module Revenue (undefined), by Application 2025 & 2033
- Figure 52: Asia Pacific 10 Gigabit Ethernet Interface Module Volume (K), by Application 2025 & 2033
- Figure 53: Asia Pacific 10 Gigabit Ethernet Interface Module Revenue Share (%), by Application 2025 & 2033
- Figure 54: Asia Pacific 10 Gigabit Ethernet Interface Module Volume Share (%), by Application 2025 & 2033
- Figure 55: Asia Pacific 10 Gigabit Ethernet Interface Module Revenue (undefined), by Types 2025 & 2033
- Figure 56: Asia Pacific 10 Gigabit Ethernet Interface Module Volume (K), by Types 2025 & 2033
- Figure 57: Asia Pacific 10 Gigabit Ethernet Interface Module Revenue Share (%), by Types 2025 & 2033
- Figure 58: Asia Pacific 10 Gigabit Ethernet Interface Module Volume Share (%), by Types 2025 & 2033
- Figure 59: Asia Pacific 10 Gigabit Ethernet Interface Module Revenue (undefined), by Country 2025 & 2033
- Figure 60: Asia Pacific 10 Gigabit Ethernet Interface Module Volume (K), by Country 2025 & 2033
- Figure 61: Asia Pacific 10 Gigabit Ethernet Interface Module Revenue Share (%), by Country 2025 & 2033
- Figure 62: Asia Pacific 10 Gigabit Ethernet Interface Module Volume Share (%), by Country 2025 & 2033
List of Tables
- Table 1: Global 10 Gigabit Ethernet Interface Module Revenue undefined Forecast, by Application 2020 & 2033
- Table 2: Global 10 Gigabit Ethernet Interface Module Volume K Forecast, by Application 2020 & 2033
- Table 3: Global 10 Gigabit Ethernet Interface Module Revenue undefined Forecast, by Types 2020 & 2033
- Table 4: Global 10 Gigabit Ethernet Interface Module Volume K Forecast, by Types 2020 & 2033
- Table 5: Global 10 Gigabit Ethernet Interface Module Revenue undefined Forecast, by Region 2020 & 2033
- Table 6: Global 10 Gigabit Ethernet Interface Module Volume K Forecast, by Region 2020 & 2033
- Table 7: Global 10 Gigabit Ethernet Interface Module Revenue undefined Forecast, by Application 2020 & 2033
- Table 8: Global 10 Gigabit Ethernet Interface Module Volume K Forecast, by Application 2020 & 2033
- Table 9: Global 10 Gigabit Ethernet Interface Module Revenue undefined Forecast, by Types 2020 & 2033
- Table 10: Global 10 Gigabit Ethernet Interface Module Volume K Forecast, by Types 2020 & 2033
- Table 11: Global 10 Gigabit Ethernet Interface Module Revenue undefined Forecast, by Country 2020 & 2033
- Table 12: Global 10 Gigabit Ethernet Interface Module Volume K Forecast, by Country 2020 & 2033
- Table 13: United States 10 Gigabit Ethernet Interface Module Revenue (undefined) Forecast, by Application 2020 & 2033
- Table 14: United States 10 Gigabit Ethernet Interface Module Volume (K) Forecast, by Application 2020 & 2033
- Table 15: Canada 10 Gigabit Ethernet Interface Module Revenue (undefined) Forecast, by Application 2020 & 2033
- Table 16: Canada 10 Gigabit Ethernet Interface Module Volume (K) Forecast, by Application 2020 & 2033
- Table 17: Mexico 10 Gigabit Ethernet Interface Module Revenue (undefined) Forecast, by Application 2020 & 2033
- Table 18: Mexico 10 Gigabit Ethernet Interface Module Volume (K) Forecast, by Application 2020 & 2033
- Table 19: Global 10 Gigabit Ethernet Interface Module Revenue undefined Forecast, by Application 2020 & 2033
- Table 20: Global 10 Gigabit Ethernet Interface Module Volume K Forecast, by Application 2020 & 2033
- Table 21: Global 10 Gigabit Ethernet Interface Module Revenue undefined Forecast, by Types 2020 & 2033
- Table 22: Global 10 Gigabit Ethernet Interface Module Volume K Forecast, by Types 2020 & 2033
- Table 23: Global 10 Gigabit Ethernet Interface Module Revenue undefined Forecast, by Country 2020 & 2033
- Table 24: Global 10 Gigabit Ethernet Interface Module Volume K Forecast, by Country 2020 & 2033
- Table 25: Brazil 10 Gigabit Ethernet Interface Module Revenue (undefined) Forecast, by Application 2020 & 2033
- Table 26: Brazil 10 Gigabit Ethernet Interface Module Volume (K) Forecast, by Application 2020 & 2033
- Table 27: Argentina 10 Gigabit Ethernet Interface Module Revenue (undefined) Forecast, by Application 2020 & 2033
- Table 28: Argentina 10 Gigabit Ethernet Interface Module Volume (K) Forecast, by Application 2020 & 2033
- Table 29: Rest of South America 10 Gigabit Ethernet Interface Module Revenue (undefined) Forecast, by Application 2020 & 2033
- Table 30: Rest of South America 10 Gigabit Ethernet Interface Module Volume (K) Forecast, by Application 2020 & 2033
- Table 31: Global 10 Gigabit Ethernet Interface Module Revenue undefined Forecast, by Application 2020 & 2033
- Table 32: Global 10 Gigabit Ethernet Interface Module Volume K Forecast, by Application 2020 & 2033
- Table 33: Global 10 Gigabit Ethernet Interface Module Revenue undefined Forecast, by Types 2020 & 2033
- Table 34: Global 10 Gigabit Ethernet Interface Module Volume K Forecast, by Types 2020 & 2033
- Table 35: Global 10 Gigabit Ethernet Interface Module Revenue undefined Forecast, by Country 2020 & 2033
- Table 36: Global 10 Gigabit Ethernet Interface Module Volume K Forecast, by Country 2020 & 2033
- Table 37: United Kingdom 10 Gigabit Ethernet Interface Module Revenue (undefined) Forecast, by Application 2020 & 2033
- Table 38: United Kingdom 10 Gigabit Ethernet Interface Module Volume (K) Forecast, by Application 2020 & 2033
- Table 39: Germany 10 Gigabit Ethernet Interface Module Revenue (undefined) Forecast, by Application 2020 & 2033
- Table 40: Germany 10 Gigabit Ethernet Interface Module Volume (K) Forecast, by Application 2020 & 2033
- Table 41: France 10 Gigabit Ethernet Interface Module Revenue (undefined) Forecast, by Application 2020 & 2033
- Table 42: France 10 Gigabit Ethernet Interface Module Volume (K) Forecast, by Application 2020 & 2033
- Table 43: Italy 10 Gigabit Ethernet Interface Module Revenue (undefined) Forecast, by Application 2020 & 2033
- Table 44: Italy 10 Gigabit Ethernet Interface Module Volume (K) Forecast, by Application 2020 & 2033
- Table 45: Spain 10 Gigabit Ethernet Interface Module Revenue (undefined) Forecast, by Application 2020 & 2033
- Table 46: Spain 10 Gigabit Ethernet Interface Module Volume (K) Forecast, by Application 2020 & 2033
- Table 47: Russia 10 Gigabit Ethernet Interface Module Revenue (undefined) Forecast, by Application 2020 & 2033
- Table 48: Russia 10 Gigabit Ethernet Interface Module Volume (K) Forecast, by Application 2020 & 2033
- Table 49: Benelux 10 Gigabit Ethernet Interface Module Revenue (undefined) Forecast, by Application 2020 & 2033
- Table 50: Benelux 10 Gigabit Ethernet Interface Module Volume (K) Forecast, by Application 2020 & 2033
- Table 51: Nordics 10 Gigabit Ethernet Interface Module Revenue (undefined) Forecast, by Application 2020 & 2033
- Table 52: Nordics 10 Gigabit Ethernet Interface Module Volume (K) Forecast, by Application 2020 & 2033
- Table 53: Rest of Europe 10 Gigabit Ethernet Interface Module Revenue (undefined) Forecast, by Application 2020 & 2033
- Table 54: Rest of Europe 10 Gigabit Ethernet Interface Module Volume (K) Forecast, by Application 2020 & 2033
- Table 55: Global 10 Gigabit Ethernet Interface Module Revenue undefined Forecast, by Application 2020 & 2033
- Table 56: Global 10 Gigabit Ethernet Interface Module Volume K Forecast, by Application 2020 & 2033
- Table 57: Global 10 Gigabit Ethernet Interface Module Revenue undefined Forecast, by Types 2020 & 2033
- Table 58: Global 10 Gigabit Ethernet Interface Module Volume K Forecast, by Types 2020 & 2033
- Table 59: Global 10 Gigabit Ethernet Interface Module Revenue undefined Forecast, by Country 2020 & 2033
- Table 60: Global 10 Gigabit Ethernet Interface Module Volume K Forecast, by Country 2020 & 2033
- Table 61: Turkey 10 Gigabit Ethernet Interface Module Revenue (undefined) Forecast, by Application 2020 & 2033
- Table 62: Turkey 10 Gigabit Ethernet Interface Module Volume (K) Forecast, by Application 2020 & 2033
- Table 63: Israel 10 Gigabit Ethernet Interface Module Revenue (undefined) Forecast, by Application 2020 & 2033
- Table 64: Israel 10 Gigabit Ethernet Interface Module Volume (K) Forecast, by Application 2020 & 2033
- Table 65: GCC 10 Gigabit Ethernet Interface Module Revenue (undefined) Forecast, by Application 2020 & 2033
- Table 66: GCC 10 Gigabit Ethernet Interface Module Volume (K) Forecast, by Application 2020 & 2033
- Table 67: North Africa 10 Gigabit Ethernet Interface Module Revenue (undefined) Forecast, by Application 2020 & 2033
- Table 68: North Africa 10 Gigabit Ethernet Interface Module Volume (K) Forecast, by Application 2020 & 2033
- Table 69: South Africa 10 Gigabit Ethernet Interface Module Revenue (undefined) Forecast, by Application 2020 & 2033
- Table 70: South Africa 10 Gigabit Ethernet Interface Module Volume (K) Forecast, by Application 2020 & 2033
- Table 71: Rest of Middle East & Africa 10 Gigabit Ethernet Interface Module Revenue (undefined) Forecast, by Application 2020 & 2033
- Table 72: Rest of Middle East & Africa 10 Gigabit Ethernet Interface Module Volume (K) Forecast, by Application 2020 & 2033
- Table 73: Global 10 Gigabit Ethernet Interface Module Revenue undefined Forecast, by Application 2020 & 2033
- Table 74: Global 10 Gigabit Ethernet Interface Module Volume K Forecast, by Application 2020 & 2033
- Table 75: Global 10 Gigabit Ethernet Interface Module Revenue undefined Forecast, by Types 2020 & 2033
- Table 76: Global 10 Gigabit Ethernet Interface Module Volume K Forecast, by Types 2020 & 2033
- Table 77: Global 10 Gigabit Ethernet Interface Module Revenue undefined Forecast, by Country 2020 & 2033
- Table 78: Global 10 Gigabit Ethernet Interface Module Volume K Forecast, by Country 2020 & 2033
- Table 79: China 10 Gigabit Ethernet Interface Module Revenue (undefined) Forecast, by Application 2020 & 2033
- Table 80: China 10 Gigabit Ethernet Interface Module Volume (K) Forecast, by Application 2020 & 2033
- Table 81: India 10 Gigabit Ethernet Interface Module Revenue (undefined) Forecast, by Application 2020 & 2033
- Table 82: India 10 Gigabit Ethernet Interface Module Volume (K) Forecast, by Application 2020 & 2033
- Table 83: Japan 10 Gigabit Ethernet Interface Module Revenue (undefined) Forecast, by Application 2020 & 2033
- Table 84: Japan 10 Gigabit Ethernet Interface Module Volume (K) Forecast, by Application 2020 & 2033
- Table 85: South Korea 10 Gigabit Ethernet Interface Module Revenue (undefined) Forecast, by Application 2020 & 2033
- Table 86: South Korea 10 Gigabit Ethernet Interface Module Volume (K) Forecast, by Application 2020 & 2033
- Table 87: ASEAN 10 Gigabit Ethernet Interface Module Revenue (undefined) Forecast, by Application 2020 & 2033
- Table 88: ASEAN 10 Gigabit Ethernet Interface Module Volume (K) Forecast, by Application 2020 & 2033
- Table 89: Oceania 10 Gigabit Ethernet Interface Module Revenue (undefined) Forecast, by Application 2020 & 2033
- Table 90: Oceania 10 Gigabit Ethernet Interface Module Volume (K) Forecast, by Application 2020 & 2033
- Table 91: Rest of Asia Pacific 10 Gigabit Ethernet Interface Module Revenue (undefined) Forecast, by Application 2020 & 2033
- Table 92: Rest of Asia Pacific 10 Gigabit Ethernet Interface Module Volume (K) Forecast, by Application 2020 & 2033
Frequently Asked Questions
1. What is the projected Compound Annual Growth Rate (CAGR) of the 10 Gigabit Ethernet Interface Module?
The projected CAGR is approximately 6.48%.
2. Which companies are prominent players in the 10 Gigabit Ethernet Interface Module?
Key companies in the market include ETU-LINK, Finisar, Cisco Systems, Juniper Networks, Intel, Arista Networks, Dell EMC, Broadcom, Nvidia, Hewlett Packard Enterprise, Huawei, Extreme Networks.
3. What are the main segments of the 10 Gigabit Ethernet Interface Module?
The market segments include Application, Types.
4. Can you provide details about the market size?
The market size is estimated to be USD XXX N/A as of 2022.
5. What are some drivers contributing to market growth?
N/A
6. What are the notable trends driving market growth?
N/A
7. Are there any restraints impacting market growth?
N/A
8. Can you provide examples of recent developments in the market?
N/A
9. What pricing options are available for accessing the report?
Pricing options include single-user, multi-user, and enterprise licenses priced at USD 3950.00, USD 5925.00, and USD 7900.00 respectively.
10. Is the market size provided in terms of value or volume?
The market size is provided in terms of value, measured in N/A and volume, measured in K.
11. Are there any specific market keywords associated with the report?
Yes, the market keyword associated with the report is "10 Gigabit Ethernet Interface Module," which aids in identifying and referencing the specific market segment covered.
12. How do I determine which pricing option suits my needs best?
The pricing options vary based on user requirements and access needs. Individual users may opt for single-user licenses, while businesses requiring broader access may choose multi-user or enterprise licenses for cost-effective access to the report.
13. Are there any additional resources or data provided in the 10 Gigabit Ethernet Interface Module report?
While the report offers comprehensive insights, it's advisable to review the specific contents or supplementary materials provided to ascertain if additional resources or data are available.
14. How can I stay updated on further developments or reports in the 10 Gigabit Ethernet Interface Module?
To stay informed about further developments, trends, and reports in the 10 Gigabit Ethernet Interface Module, consider subscribing to industry newsletters, following relevant companies and organizations, or regularly checking reputable industry news sources and publications.
Methodology
Step 1 - Identification of Relevant Samples Size from Population Database


Step 2 - Approaches for Defining Global Market Size (Value, Volume* & Price*)

Note*: In applicable scenarios
Step 3 - Data Sources
Primary Research
- Web Analytics
- Survey Reports
- Research Institute
- Latest Research Reports
- Opinion Leaders
Secondary Research
- Annual Reports
- White Paper
- Latest Press Release
- Industry Association
- Paid Database
- Investor Presentations

Step 4 - Data Triangulation
Involves using different sources of information in order to increase the validity of a study
These sources are likely to be stakeholders in a program - participants, other researchers, program staff, other community members, and so on.
Then we put all data in single framework & apply various statistical tools to find out the dynamic on the market.
During the analysis stage, feedback from the stakeholder groups would be compared to determine areas of agreement as well as areas of divergence

