

Key Insights
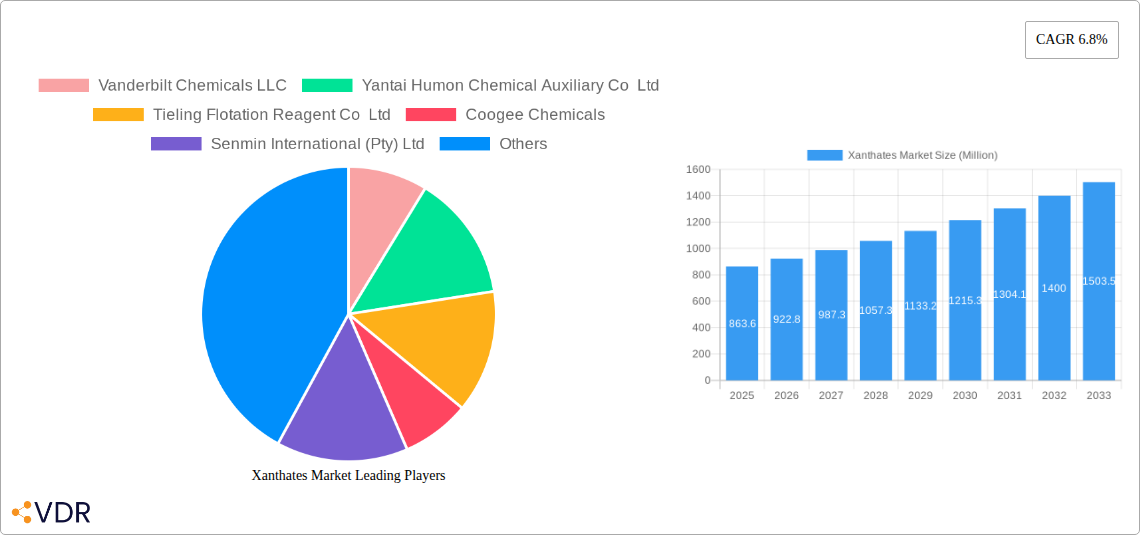
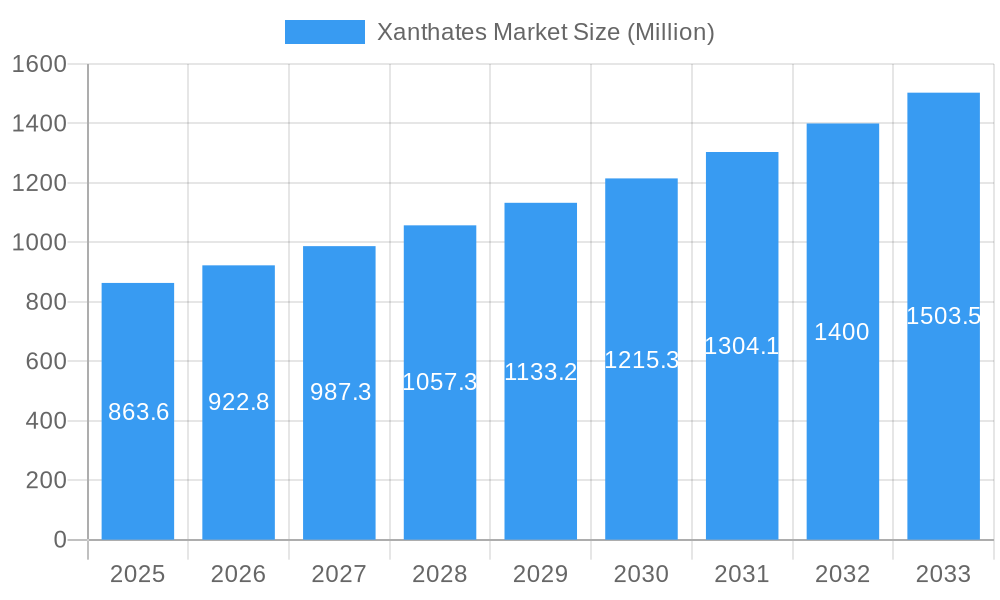
The global xanthates market, valued at $863.6 million in 2025, is projected to experience robust growth, driven by a compound annual growth rate (CAGR) of 6.8% from 2025 to 2033. This expansion is fueled by the increasing demand for xanthates in the mining industry, particularly in gold and copper extraction, where they serve as crucial flotation reagents enhancing ore processing efficiency. The rising global mining activities, coupled with the exploration of new mineral reserves, significantly contributes to this market's growth trajectory. Furthermore, the expanding application of xanthates in rubber processing, specifically in the production of synthetic rubber, is another key driver. While the agrochemical sector represents a smaller segment currently, the potential for application in specific agricultural practices warrants attention as a future growth area. Growth is also spurred by technological advancements in xanthate production and improved formulations leading to enhanced performance and reduced environmental impact.
Xanthates Market Market Size (In Million)
However, the market faces certain restraints. Fluctuations in raw material prices, particularly those of alcohols and carbon disulfide, can impact production costs and profitability. Stringent environmental regulations regarding the use of chemicals in mining and other applications impose challenges on market players. The need for compliance with safety standards and the potential for stricter regulations in the future also pose a considerable restraint to market expansion. Nevertheless, the continued growth in mining and industrial activities, coupled with ongoing research and development efforts focused on sustainable and efficient xanthate production, points towards a positive outlook for this market in the coming years. The market is segmented by product type (Sodium Ethyl Xanthate, Sodium Isopropyl Xanthate, Sodium Isobutyl Xanthate, Potassium Amyl Xanthate, and Others) and application (Mining, Rubber Processing, Agrochemicals, and Others), with mining currently dominating the application segment. Geographical regions such as Asia-Pacific, fueled by significant mining operations in China and other countries, show the highest growth potential.
Xanthates Market Company Market Share
Xanthates Market: A Comprehensive Report (2019-2033)
This comprehensive report provides an in-depth analysis of the global Xanthates market, encompassing historical data (2019-2024), current estimates (2025), and future projections (2025-2033). The study segments the market by product type (Sodium Ethyl Xanthate, Sodium Isopropyl Xanthate, Sodium Isobutyl Xanthate, Potassium Amyl Xanthate, Other Product Types) and application (Mining, Rubber Processing, Agrochemicals, Other Applications), providing a granular understanding of market dynamics and growth drivers. The report is crucial for industry professionals, investors, and researchers seeking a detailed overview of this vital chemical market. The total market size in 2025 is estimated at xx Million.
Xanthates Market Dynamics & Structure
The Xanthates market exhibits a moderately concentrated structure, with a few major players holding significant market share. Technological innovation, particularly in improving the efficiency and sustainability of xanthate production and application, is a key driver. Stringent environmental regulations regarding the use of chemicals in mining and other applications present both challenges and opportunities, prompting the development of more eco-friendly xanthates. The market faces competition from alternative flotation reagents and other chemical processing agents. M&A activity has been moderate, with larger players consolidating market share through acquisitions of smaller companies.
- Market Concentration: The top 5 players account for approximately xx% of the global market share in 2025.
- Technological Innovation: Focus on developing biodegradable and higher-performance xanthates.
- Regulatory Framework: Stringent environmental regulations in key markets impact production and application.
- Competitive Substitutes: Alternative flotation reagents and processing technologies present competitive pressure.
- End-User Demographics: Growth is primarily driven by the mining and rubber processing industries.
- M&A Trends: A moderate number of M&A deals were observed in the historical period (2019-2024), with an average of xx deals per year.
Xanthates Market Growth Trends & Insights
The global Xanthates market has demonstrated robust and consistent growth over the historical period (2019-2024), significantly fueled by the burgeoning expansion of the mining industry, particularly within dynamic emerging economies. The market size, estimated at approximately **XX Million in 2025**, is projected to experience a Compound Annual Growth Rate (CAGR) of **XX%** from 2025 to 2033. This upward trajectory is further amplified by continuous technological advancements in xanthate production, yielding more efficient and environmentally responsible manufacturing processes. The increasing adoption rates in key emerging markets, coupled with evolving consumer preferences leaning towards sustainable and eco-friendly products, are significant influencers shaping the market's expansion. However, the market's growth can be influenced by external factors such as volatility in commodity prices and prevailing economic downturns.
- Market Size Evolution: The market achieved a notable CAGR of XX% during the historical period spanning from 2019 to 2024.
- Adoption Rates: Significant increases in adoption are observed in emerging markets, predominantly within large-scale mining operations.
- Technological Disruptions: Ongoing innovation in production methodologies is leading to enhanced efficiency, improved product performance, and a stronger emphasis on sustainability.
- Consumer Behavior Shifts: A discernible and growing preference for environmentally conscious and sustainable products is a key trend influencing the market.
Dominant Regions, Countries, or Segments in Xanthates Market
The mining sector dominates the application segment, with xx% market share in 2025, largely due to the extensive use of xanthates in mineral flotation processes. Asia-Pacific is the leading region, accounting for xx% of the global market share in 2025, driven by rapid industrialization and substantial mining activities in countries like China and Australia. Among product types, Sodium Ethyl Xanthate holds the largest market share due to its cost-effectiveness and wide applicability.
- Key Drivers (Asia-Pacific):
- Rapid industrialization and infrastructure development.
- Growing mining and metal processing activities.
- Government support for mining sector expansion.
- Dominance Factors: High mining activity and industrialization in the Asia-Pacific region.
- Growth Potential: Significant growth potential in emerging economies in Africa and South America.
Xanthates Market Product Landscape
The xanthate market offers a range of products tailored to specific applications. Innovations focus on improving performance metrics such as selectivity and efficiency in mineral flotation, alongside efforts to enhance biodegradability and reduce environmental impact. Unique selling propositions center around improved performance, cost-effectiveness, and environmental sustainability. Advancements include the development of customized xanthate formulations for specific ore types and improved production processes for higher purity and yield.
Key Drivers, Barriers & Challenges in Xanthates Market
Key Drivers: The expansion of the global mining industry, with a particular emphasis on emerging economies, stands as a primary catalyst for market growth. Furthermore, the escalating demand from the rubber processing sector plays a crucial role in driving market expansion. Technological advancements that facilitate more efficient and sustainable production processes are also instrumental in propelling market growth.
Challenges & Restraints: The market faces several challenges, including the inherent fluctuations in raw material prices, the imposition of stringent environmental regulations across various regions, and the competitive landscape presented by substitute products. Disruptions within the supply chain, coupled with escalating transportation costs, have also exerted a negative influence on market dynamics. The market's inherent sensitivity to economic downturns further compounds these challenges.
Emerging Opportunities in Xanthates Market
Untapped markets in developing economies, particularly in Africa and South America, present significant growth opportunities. The development of bio-based or biodegradable xanthates represents a major avenue for innovation and market expansion. Exploring new applications beyond traditional uses (mining and rubber processing), like in specialized agrochemicals, is another key opportunity.
Growth Accelerators in the Xanthates Market Industry
Technological breakthroughs in xanthate synthesis and application are crucial growth catalysts. Strategic partnerships between xanthate manufacturers and mining companies can unlock significant growth potential. Market expansion strategies focused on emerging markets, particularly through joint ventures or local manufacturing partnerships, are also essential for sustained market growth.
Key Players Shaping the Xanthates Market Market
- Vanderbilt Chemicals LLC
- Yantai Humon Chemical Auxiliary Co Ltd
- Tieling Flotation Reagent Co Ltd
- Coogee Chemicals
- Senmin International (Pty) Ltd
- QiXia TongDa Flotation Reagent Co Ltd
- CTC Energy & Mining Company
- Orica Limited
- Amruta Industries
- SNF Group
Notable Milestones in Xanthates Market Sector
- 2021: Introduction of a novel, biodegradable xanthate formulation by [Company Name], marking a significant step towards sustainability.
- 2022: Strategic acquisition of [Company A] by [Company B], resulting in increased market consolidation and a stronger competitive presence.
- 2023: Launch of a high-efficiency xanthate formulation by [Company Name], designed to optimize mineral recovery rates. (Further significant milestones are anticipated and will be integrated as data becomes available).
In-Depth Xanthates Market Market Outlook
The Xanthates market is strategically positioned for sustained and promising growth in the foreseeable future. This positive outlook is underpinned by several key factors, including the continued expansion of the global mining sector, a robust increase in demand from the versatile rubber industry, and the ongoing wave of innovations within xanthate technology. To effectively capitalize on this expanding market, companies will need to focus on forging strategic partnerships, making substantial investments in research and development (R&D), and actively pursuing expansion into new and underserved geographical markets. The escalating global emphasis on sustainability will undoubtedly continue to spur the development of innovative and environmentally responsible xanthate alternatives, shaping the future of the industry.
Xanthates Market Segmentation
-
1. Product Type
- 1.1. Sodium Ethyl Xanthate
- 1.2. Sodium Isopropyl Xanthate
- 1.3. Sodium Isobutyl Xanthate
- 1.4. Potassium Amyl Xanthate
- 1.5. Other Product Types
-
2. Application
- 2.1. Mining
- 2.2. Rubber Processing
- 2.3. Agrochemicals
- 2.4. Other Applications
Xanthates Market Segmentation By Geography
-
1. Asia Pacific
- 1.1. China
- 1.2. India
- 1.3. Japan
- 1.4. South Korea
- 1.5. Rest of Asia Pacific
-
2. North America
- 2.1. United States
- 2.2. Canada
- 2.3. Mexico
-
3. Europe
- 3.1. Germany
- 3.2. United Kingdom
- 3.3. Italy
- 3.4. France
- 3.5. Rest of Europe
-
4. South America
- 4.1. Brazil
- 4.2. Argentina
- 4.3. Rest of South America
-
5. Middle East and Africa
- 5.1. Saudi Arabia
- 5.2. South Africa
- 5.3. Rest of Middle East and Africa
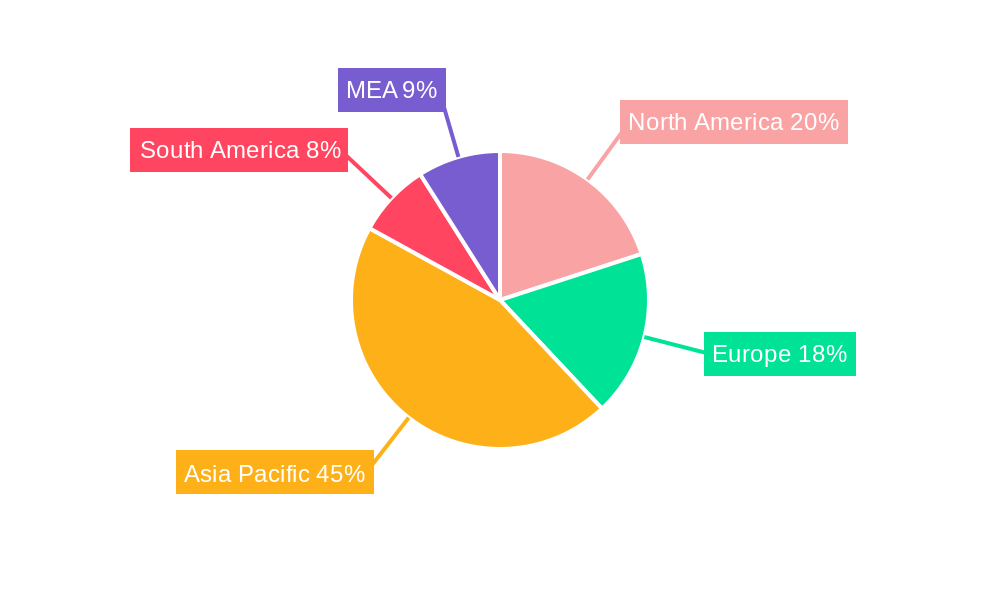
Xanthates Market Regional Market Share
Geographic Coverage of Xanthates Market
Xanthates Market REPORT HIGHLIGHTS
| Aspects | Details |
|---|---|
| Study Period | 2020-2034 |
| Base Year | 2025 |
| Estimated Year | 2026 |
| Forecast Period | 2026-2034 |
| Historical Period | 2020-2025 |
| Growth Rate | CAGR of 6.8% from 2020-2034 |
| Segmentation |
|
Table of Contents
- 1. Introduction
- 1.1. Research Scope
- 1.2. Market Segmentation
- 1.3. Research Objective
- 1.4. Definitions and Assumptions
- 2. Executive Summary
- 2.1. Market Snapshot
- 3. Market Dynamics
- 3.1. Market Drivers
- 3.2. Market Restrains
- 3.3. Market Trends
- 3.4. Market Opportunities
- 4. Market Factor Analysis
- 4.1. Porters Five Forces
- 4.1.1. Bargaining Power of Suppliers
- 4.1.2. Bargaining Power of Buyers
- 4.1.3. Threat of New Entrants
- 4.1.4. Threat of Substitutes
- 4.1.5. Competitive Rivalry
- 4.2. PESTEL analysis
- 4.3. BCG Analysis
- 4.3.1. Stars (High Growth, High Market Share)
- 4.3.2. Cash Cows (Low Growth, High Market Share)
- 4.3.3. Question Mark (High Growth, Low Market Share)
- 4.3.4. Dogs (Low Growth, Low Market Share)
- 4.4. Ansoff Matrix Analysis
- 4.5. Supply Chain Analysis
- 4.6. Regulatory Landscape
- 4.7. Current Market Potential and Opportunity Assessment (TAM–SAM–SOM Framework)
- 4.8. VDR Analyst Note
- 4.1. Porters Five Forces
- 5. Market Analysis, Insights and Forecast 2021-2033
- 5.1. Market Analysis, Insights and Forecast - by Product Type
- 5.1.1. Sodium Ethyl Xanthate
- 5.1.2. Sodium Isopropyl Xanthate
- 5.1.3. Sodium Isobutyl Xanthate
- 5.1.4. Potassium Amyl Xanthate
- 5.1.5. Other Product Types
- 5.2. Market Analysis, Insights and Forecast - by Application
- 5.2.1. Mining
- 5.2.2. Rubber Processing
- 5.2.3. Agrochemicals
- 5.2.4. Other Applications
- 5.3. Market Analysis, Insights and Forecast - by Region
- 5.3.1. Asia Pacific
- 5.3.2. North America
- 5.3.3. Europe
- 5.3.4. South America
- 5.3.5. Middle East and Africa
- 5.1. Market Analysis, Insights and Forecast - by Product Type
- 6. Global Xanthates Market Analysis, Insights and Forecast, 2021-2033
- 6.1. Market Analysis, Insights and Forecast - by Product Type
- 6.1.1. Sodium Ethyl Xanthate
- 6.1.2. Sodium Isopropyl Xanthate
- 6.1.3. Sodium Isobutyl Xanthate
- 6.1.4. Potassium Amyl Xanthate
- 6.1.5. Other Product Types
- 6.2. Market Analysis, Insights and Forecast - by Application
- 6.2.1. Mining
- 6.2.2. Rubber Processing
- 6.2.3. Agrochemicals
- 6.2.4. Other Applications
- 6.1. Market Analysis, Insights and Forecast - by Product Type
- 7. Asia Pacific Xanthates Market Analysis, Insights and Forecast, 2021-2033
- 7.1. Market Analysis, Insights and Forecast - by Product Type
- 7.1.1. Sodium Ethyl Xanthate
- 7.1.2. Sodium Isopropyl Xanthate
- 7.1.3. Sodium Isobutyl Xanthate
- 7.1.4. Potassium Amyl Xanthate
- 7.1.5. Other Product Types
- 7.2. Market Analysis, Insights and Forecast - by Application
- 7.2.1. Mining
- 7.2.2. Rubber Processing
- 7.2.3. Agrochemicals
- 7.2.4. Other Applications
- 7.1. Market Analysis, Insights and Forecast - by Product Type
- 8. North America Xanthates Market Analysis, Insights and Forecast, 2021-2033
- 8.1. Market Analysis, Insights and Forecast - by Product Type
- 8.1.1. Sodium Ethyl Xanthate
- 8.1.2. Sodium Isopropyl Xanthate
- 8.1.3. Sodium Isobutyl Xanthate
- 8.1.4. Potassium Amyl Xanthate
- 8.1.5. Other Product Types
- 8.2. Market Analysis, Insights and Forecast - by Application
- 8.2.1. Mining
- 8.2.2. Rubber Processing
- 8.2.3. Agrochemicals
- 8.2.4. Other Applications
- 8.1. Market Analysis, Insights and Forecast - by Product Type
- 9. Europe Xanthates Market Analysis, Insights and Forecast, 2021-2033
- 9.1. Market Analysis, Insights and Forecast - by Product Type
- 9.1.1. Sodium Ethyl Xanthate
- 9.1.2. Sodium Isopropyl Xanthate
- 9.1.3. Sodium Isobutyl Xanthate
- 9.1.4. Potassium Amyl Xanthate
- 9.1.5. Other Product Types
- 9.2. Market Analysis, Insights and Forecast - by Application
- 9.2.1. Mining
- 9.2.2. Rubber Processing
- 9.2.3. Agrochemicals
- 9.2.4. Other Applications
- 9.1. Market Analysis, Insights and Forecast - by Product Type
- 10. South America Xanthates Market Analysis, Insights and Forecast, 2021-2033
- 10.1. Market Analysis, Insights and Forecast - by Product Type
- 10.1.1. Sodium Ethyl Xanthate
- 10.1.2. Sodium Isopropyl Xanthate
- 10.1.3. Sodium Isobutyl Xanthate
- 10.1.4. Potassium Amyl Xanthate
- 10.1.5. Other Product Types
- 10.2. Market Analysis, Insights and Forecast - by Application
- 10.2.1. Mining
- 10.2.2. Rubber Processing
- 10.2.3. Agrochemicals
- 10.2.4. Other Applications
- 10.1. Market Analysis, Insights and Forecast - by Product Type
- 11. Middle East and Africa Xanthates Market Analysis, Insights and Forecast, 2021-2033
- 11.1. Market Analysis, Insights and Forecast - by Product Type
- 11.1.1. Sodium Ethyl Xanthate
- 11.1.2. Sodium Isopropyl Xanthate
- 11.1.3. Sodium Isobutyl Xanthate
- 11.1.4. Potassium Amyl Xanthate
- 11.1.5. Other Product Types
- 11.2. Market Analysis, Insights and Forecast - by Application
- 11.2.1. Mining
- 11.2.2. Rubber Processing
- 11.2.3. Agrochemicals
- 11.2.4. Other Applications
- 11.1. Market Analysis, Insights and Forecast - by Product Type
- 12. Competitive Analysis
- 12.1. Company Profiles
- 12.1.1 Vanderbilt Chemicals LLC
- 12.1.1.1. Company Overview
- 12.1.1.2. Products
- 12.1.1.3. Company Financials
- 12.1.1.4. SWOT Analysis
- 12.1.2 Yantai Humon Chemical Auxiliary Co Ltd
- 12.1.2.1. Company Overview
- 12.1.2.2. Products
- 12.1.2.3. Company Financials
- 12.1.2.4. SWOT Analysis
- 12.1.3 Tieling Flotation Reagent Co Ltd
- 12.1.3.1. Company Overview
- 12.1.3.2. Products
- 12.1.3.3. Company Financials
- 12.1.3.4. SWOT Analysis
- 12.1.4 Coogee Chemicals
- 12.1.4.1. Company Overview
- 12.1.4.2. Products
- 12.1.4.3. Company Financials
- 12.1.4.4. SWOT Analysis
- 12.1.5 Senmin International (Pty) Ltd
- 12.1.5.1. Company Overview
- 12.1.5.2. Products
- 12.1.5.3. Company Financials
- 12.1.5.4. SWOT Analysis
- 12.1.6 QiXia TongDa Flotation Reagent Co Ltd
- 12.1.6.1. Company Overview
- 12.1.6.2. Products
- 12.1.6.3. Company Financials
- 12.1.6.4. SWOT Analysis
- 12.1.7 CTC Energy & Mining Company
- 12.1.7.1. Company Overview
- 12.1.7.2. Products
- 12.1.7.3. Company Financials
- 12.1.7.4. SWOT Analysis
- 12.1.8 Orica Limited
- 12.1.8.1. Company Overview
- 12.1.8.2. Products
- 12.1.8.3. Company Financials
- 12.1.8.4. SWOT Analysis
- 12.1.9 Amruta Industries
- 12.1.9.1. Company Overview
- 12.1.9.2. Products
- 12.1.9.3. Company Financials
- 12.1.9.4. SWOT Analysis
- 12.1.10 SNF Group
- 12.1.10.1. Company Overview
- 12.1.10.2. Products
- 12.1.10.3. Company Financials
- 12.1.10.4. SWOT Analysis
- 12.1.1 Vanderbilt Chemicals LLC
- 12.2. Market Entropy
- 12.2.1 Company's Key Areas Served
- 12.2.2 Recent Developments
- 12.3. Company Market Share Analysis 2025
- 12.3.1 Top 5 Companies Market Share Analysis
- 12.3.2 Top 3 Companies Market Share Analysis
- 12.4. List of Potential Customers
- 13. Research Methodology
List of Figures
- Figure 1: Global Xanthates Market Revenue Breakdown (Million, %) by Region 2025 & 2033
- Figure 2: Global Xanthates Market Volume Breakdown (K Tons, %) by Region 2025 & 2033
- Figure 3: Asia Pacific Xanthates Market Revenue (Million), by Product Type 2025 & 2033
- Figure 4: Asia Pacific Xanthates Market Volume (K Tons), by Product Type 2025 & 2033
- Figure 5: Asia Pacific Xanthates Market Revenue Share (%), by Product Type 2025 & 2033
- Figure 6: Asia Pacific Xanthates Market Volume Share (%), by Product Type 2025 & 2033
- Figure 7: Asia Pacific Xanthates Market Revenue (Million), by Application 2025 & 2033
- Figure 8: Asia Pacific Xanthates Market Volume (K Tons), by Application 2025 & 2033
- Figure 9: Asia Pacific Xanthates Market Revenue Share (%), by Application 2025 & 2033
- Figure 10: Asia Pacific Xanthates Market Volume Share (%), by Application 2025 & 2033
- Figure 11: Asia Pacific Xanthates Market Revenue (Million), by Country 2025 & 2033
- Figure 12: Asia Pacific Xanthates Market Volume (K Tons), by Country 2025 & 2033
- Figure 13: Asia Pacific Xanthates Market Revenue Share (%), by Country 2025 & 2033
- Figure 14: Asia Pacific Xanthates Market Volume Share (%), by Country 2025 & 2033
- Figure 15: North America Xanthates Market Revenue (Million), by Product Type 2025 & 2033
- Figure 16: North America Xanthates Market Volume (K Tons), by Product Type 2025 & 2033
- Figure 17: North America Xanthates Market Revenue Share (%), by Product Type 2025 & 2033
- Figure 18: North America Xanthates Market Volume Share (%), by Product Type 2025 & 2033
- Figure 19: North America Xanthates Market Revenue (Million), by Application 2025 & 2033
- Figure 20: North America Xanthates Market Volume (K Tons), by Application 2025 & 2033
- Figure 21: North America Xanthates Market Revenue Share (%), by Application 2025 & 2033
- Figure 22: North America Xanthates Market Volume Share (%), by Application 2025 & 2033
- Figure 23: North America Xanthates Market Revenue (Million), by Country 2025 & 2033
- Figure 24: North America Xanthates Market Volume (K Tons), by Country 2025 & 2033
- Figure 25: North America Xanthates Market Revenue Share (%), by Country 2025 & 2033
- Figure 26: North America Xanthates Market Volume Share (%), by Country 2025 & 2033
- Figure 27: Europe Xanthates Market Revenue (Million), by Product Type 2025 & 2033
- Figure 28: Europe Xanthates Market Volume (K Tons), by Product Type 2025 & 2033
- Figure 29: Europe Xanthates Market Revenue Share (%), by Product Type 2025 & 2033
- Figure 30: Europe Xanthates Market Volume Share (%), by Product Type 2025 & 2033
- Figure 31: Europe Xanthates Market Revenue (Million), by Application 2025 & 2033
- Figure 32: Europe Xanthates Market Volume (K Tons), by Application 2025 & 2033
- Figure 33: Europe Xanthates Market Revenue Share (%), by Application 2025 & 2033
- Figure 34: Europe Xanthates Market Volume Share (%), by Application 2025 & 2033
- Figure 35: Europe Xanthates Market Revenue (Million), by Country 2025 & 2033
- Figure 36: Europe Xanthates Market Volume (K Tons), by Country 2025 & 2033
- Figure 37: Europe Xanthates Market Revenue Share (%), by Country 2025 & 2033
- Figure 38: Europe Xanthates Market Volume Share (%), by Country 2025 & 2033
- Figure 39: South America Xanthates Market Revenue (Million), by Product Type 2025 & 2033
- Figure 40: South America Xanthates Market Volume (K Tons), by Product Type 2025 & 2033
- Figure 41: South America Xanthates Market Revenue Share (%), by Product Type 2025 & 2033
- Figure 42: South America Xanthates Market Volume Share (%), by Product Type 2025 & 2033
- Figure 43: South America Xanthates Market Revenue (Million), by Application 2025 & 2033
- Figure 44: South America Xanthates Market Volume (K Tons), by Application 2025 & 2033
- Figure 45: South America Xanthates Market Revenue Share (%), by Application 2025 & 2033
- Figure 46: South America Xanthates Market Volume Share (%), by Application 2025 & 2033
- Figure 47: South America Xanthates Market Revenue (Million), by Country 2025 & 2033
- Figure 48: South America Xanthates Market Volume (K Tons), by Country 2025 & 2033
- Figure 49: South America Xanthates Market Revenue Share (%), by Country 2025 & 2033
- Figure 50: South America Xanthates Market Volume Share (%), by Country 2025 & 2033
- Figure 51: Middle East and Africa Xanthates Market Revenue (Million), by Product Type 2025 & 2033
- Figure 52: Middle East and Africa Xanthates Market Volume (K Tons), by Product Type 2025 & 2033
- Figure 53: Middle East and Africa Xanthates Market Revenue Share (%), by Product Type 2025 & 2033
- Figure 54: Middle East and Africa Xanthates Market Volume Share (%), by Product Type 2025 & 2033
- Figure 55: Middle East and Africa Xanthates Market Revenue (Million), by Application 2025 & 2033
- Figure 56: Middle East and Africa Xanthates Market Volume (K Tons), by Application 2025 & 2033
- Figure 57: Middle East and Africa Xanthates Market Revenue Share (%), by Application 2025 & 2033
- Figure 58: Middle East and Africa Xanthates Market Volume Share (%), by Application 2025 & 2033
- Figure 59: Middle East and Africa Xanthates Market Revenue (Million), by Country 2025 & 2033
- Figure 60: Middle East and Africa Xanthates Market Volume (K Tons), by Country 2025 & 2033
- Figure 61: Middle East and Africa Xanthates Market Revenue Share (%), by Country 2025 & 2033
- Figure 62: Middle East and Africa Xanthates Market Volume Share (%), by Country 2025 & 2033
List of Tables
- Table 1: Global Xanthates Market Revenue Million Forecast, by Product Type 2020 & 2033
- Table 2: Global Xanthates Market Volume K Tons Forecast, by Product Type 2020 & 2033
- Table 3: Global Xanthates Market Revenue Million Forecast, by Application 2020 & 2033
- Table 4: Global Xanthates Market Volume K Tons Forecast, by Application 2020 & 2033
- Table 5: Global Xanthates Market Revenue Million Forecast, by Region 2020 & 2033
- Table 6: Global Xanthates Market Volume K Tons Forecast, by Region 2020 & 2033
- Table 7: Global Xanthates Market Revenue Million Forecast, by Product Type 2020 & 2033
- Table 8: Global Xanthates Market Volume K Tons Forecast, by Product Type 2020 & 2033
- Table 9: Global Xanthates Market Revenue Million Forecast, by Application 2020 & 2033
- Table 10: Global Xanthates Market Volume K Tons Forecast, by Application 2020 & 2033
- Table 11: Global Xanthates Market Revenue Million Forecast, by Country 2020 & 2033
- Table 12: Global Xanthates Market Volume K Tons Forecast, by Country 2020 & 2033
- Table 13: China Xanthates Market Revenue (Million) Forecast, by Application 2020 & 2033
- Table 14: China Xanthates Market Volume (K Tons) Forecast, by Application 2020 & 2033
- Table 15: India Xanthates Market Revenue (Million) Forecast, by Application 2020 & 2033
- Table 16: India Xanthates Market Volume (K Tons) Forecast, by Application 2020 & 2033
- Table 17: Japan Xanthates Market Revenue (Million) Forecast, by Application 2020 & 2033
- Table 18: Japan Xanthates Market Volume (K Tons) Forecast, by Application 2020 & 2033
- Table 19: South Korea Xanthates Market Revenue (Million) Forecast, by Application 2020 & 2033
- Table 20: South Korea Xanthates Market Volume (K Tons) Forecast, by Application 2020 & 2033
- Table 21: Rest of Asia Pacific Xanthates Market Revenue (Million) Forecast, by Application 2020 & 2033
- Table 22: Rest of Asia Pacific Xanthates Market Volume (K Tons) Forecast, by Application 2020 & 2033
- Table 23: Global Xanthates Market Revenue Million Forecast, by Product Type 2020 & 2033
- Table 24: Global Xanthates Market Volume K Tons Forecast, by Product Type 2020 & 2033
- Table 25: Global Xanthates Market Revenue Million Forecast, by Application 2020 & 2033
- Table 26: Global Xanthates Market Volume K Tons Forecast, by Application 2020 & 2033
- Table 27: Global Xanthates Market Revenue Million Forecast, by Country 2020 & 2033
- Table 28: Global Xanthates Market Volume K Tons Forecast, by Country 2020 & 2033
- Table 29: United States Xanthates Market Revenue (Million) Forecast, by Application 2020 & 2033
- Table 30: United States Xanthates Market Volume (K Tons) Forecast, by Application 2020 & 2033
- Table 31: Canada Xanthates Market Revenue (Million) Forecast, by Application 2020 & 2033
- Table 32: Canada Xanthates Market Volume (K Tons) Forecast, by Application 2020 & 2033
- Table 33: Mexico Xanthates Market Revenue (Million) Forecast, by Application 2020 & 2033
- Table 34: Mexico Xanthates Market Volume (K Tons) Forecast, by Application 2020 & 2033
- Table 35: Global Xanthates Market Revenue Million Forecast, by Product Type 2020 & 2033
- Table 36: Global Xanthates Market Volume K Tons Forecast, by Product Type 2020 & 2033
- Table 37: Global Xanthates Market Revenue Million Forecast, by Application 2020 & 2033
- Table 38: Global Xanthates Market Volume K Tons Forecast, by Application 2020 & 2033
- Table 39: Global Xanthates Market Revenue Million Forecast, by Country 2020 & 2033
- Table 40: Global Xanthates Market Volume K Tons Forecast, by Country 2020 & 2033
- Table 41: Germany Xanthates Market Revenue (Million) Forecast, by Application 2020 & 2033
- Table 42: Germany Xanthates Market Volume (K Tons) Forecast, by Application 2020 & 2033
- Table 43: United Kingdom Xanthates Market Revenue (Million) Forecast, by Application 2020 & 2033
- Table 44: United Kingdom Xanthates Market Volume (K Tons) Forecast, by Application 2020 & 2033
- Table 45: Italy Xanthates Market Revenue (Million) Forecast, by Application 2020 & 2033
- Table 46: Italy Xanthates Market Volume (K Tons) Forecast, by Application 2020 & 2033
- Table 47: France Xanthates Market Revenue (Million) Forecast, by Application 2020 & 2033
- Table 48: France Xanthates Market Volume (K Tons) Forecast, by Application 2020 & 2033
- Table 49: Rest of Europe Xanthates Market Revenue (Million) Forecast, by Application 2020 & 2033
- Table 50: Rest of Europe Xanthates Market Volume (K Tons) Forecast, by Application 2020 & 2033
- Table 51: Global Xanthates Market Revenue Million Forecast, by Product Type 2020 & 2033
- Table 52: Global Xanthates Market Volume K Tons Forecast, by Product Type 2020 & 2033
- Table 53: Global Xanthates Market Revenue Million Forecast, by Application 2020 & 2033
- Table 54: Global Xanthates Market Volume K Tons Forecast, by Application 2020 & 2033
- Table 55: Global Xanthates Market Revenue Million Forecast, by Country 2020 & 2033
- Table 56: Global Xanthates Market Volume K Tons Forecast, by Country 2020 & 2033
- Table 57: Brazil Xanthates Market Revenue (Million) Forecast, by Application 2020 & 2033
- Table 58: Brazil Xanthates Market Volume (K Tons) Forecast, by Application 2020 & 2033
- Table 59: Argentina Xanthates Market Revenue (Million) Forecast, by Application 2020 & 2033
- Table 60: Argentina Xanthates Market Volume (K Tons) Forecast, by Application 2020 & 2033
- Table 61: Rest of South America Xanthates Market Revenue (Million) Forecast, by Application 2020 & 2033
- Table 62: Rest of South America Xanthates Market Volume (K Tons) Forecast, by Application 2020 & 2033
- Table 63: Global Xanthates Market Revenue Million Forecast, by Product Type 2020 & 2033
- Table 64: Global Xanthates Market Volume K Tons Forecast, by Product Type 2020 & 2033
- Table 65: Global Xanthates Market Revenue Million Forecast, by Application 2020 & 2033
- Table 66: Global Xanthates Market Volume K Tons Forecast, by Application 2020 & 2033
- Table 67: Global Xanthates Market Revenue Million Forecast, by Country 2020 & 2033
- Table 68: Global Xanthates Market Volume K Tons Forecast, by Country 2020 & 2033
- Table 69: Saudi Arabia Xanthates Market Revenue (Million) Forecast, by Application 2020 & 2033
- Table 70: Saudi Arabia Xanthates Market Volume (K Tons) Forecast, by Application 2020 & 2033
- Table 71: South Africa Xanthates Market Revenue (Million) Forecast, by Application 2020 & 2033
- Table 72: South Africa Xanthates Market Volume (K Tons) Forecast, by Application 2020 & 2033
- Table 73: Rest of Middle East and Africa Xanthates Market Revenue (Million) Forecast, by Application 2020 & 2033
- Table 74: Rest of Middle East and Africa Xanthates Market Volume (K Tons) Forecast, by Application 2020 & 2033
Frequently Asked Questions
1. What is the projected Compound Annual Growth Rate (CAGR) of the Xanthates Market?
The projected CAGR is approximately 6.8%.
2. Which companies are prominent players in the Xanthates Market?
Key companies in the market include Vanderbilt Chemicals LLC, Yantai Humon Chemical Auxiliary Co Ltd, Tieling Flotation Reagent Co Ltd, Coogee Chemicals, Senmin International (Pty) Ltd, QiXia TongDa Flotation Reagent Co Ltd, CTC Energy & Mining Company, Orica Limited, Amruta Industries, SNF Group.
3. What are the main segments of the Xanthates Market?
The market segments include Product Type, Application.
4. Can you provide details about the market size?
The market size is estimated to be USD 863.6 Million as of 2022.
5. What are some drivers contributing to market growth?
Rising Mining Activities Across the Globe; Widening Use of Xanthates in Rubber Industry.
6. What are the notable trends driving market growth?
Rising Mining Activities Across the Globe.
7. Are there any restraints impacting market growth?
Emergence of Xanthates Replacement Technology; Environmental Regulations Associated with Mining Activities.
8. Can you provide examples of recent developments in the market?
N/A
9. What pricing options are available for accessing the report?
Pricing options include single-user, multi-user, and enterprise licenses priced at USD 4750, USD 5250, and USD 8750 respectively.
10. Is the market size provided in terms of value or volume?
The market size is provided in terms of value, measured in Million and volume, measured in K Tons.
11. Are there any specific market keywords associated with the report?
Yes, the market keyword associated with the report is "Xanthates Market," which aids in identifying and referencing the specific market segment covered.
12. How do I determine which pricing option suits my needs best?
The pricing options vary based on user requirements and access needs. Individual users may opt for single-user licenses, while businesses requiring broader access may choose multi-user or enterprise licenses for cost-effective access to the report.
13. Are there any additional resources or data provided in the Xanthates Market report?
While the report offers comprehensive insights, it's advisable to review the specific contents or supplementary materials provided to ascertain if additional resources or data are available.
14. How can I stay updated on further developments or reports in the Xanthates Market?
To stay informed about further developments, trends, and reports in the Xanthates Market, consider subscribing to industry newsletters, following relevant companies and organizations, or regularly checking reputable industry news sources and publications.
Methodology
Step 1 - Identification of Relevant Samples Size from Population Database


Step 2 - Approaches for Defining Global Market Size (Value, Volume* & Price*)

Note*: In applicable scenarios
Step 3 - Data Sources
Primary Research
- Web Analytics
- Survey Reports
- Research Institute
- Latest Research Reports
- Opinion Leaders
Secondary Research
- Annual Reports
- White Paper
- Latest Press Release
- Industry Association
- Paid Database
- Investor Presentations

Step 4 - Data Triangulation
Involves using different sources of information in order to increase the validity of a study
These sources are likely to be stakeholders in a program - participants, other researchers, program staff, other community members, and so on.
Then we put all data in single framework & apply various statistical tools to find out the dynamic on the market.
During the analysis stage, feedback from the stakeholder groups would be compared to determine areas of agreement as well as areas of divergence