

Key Insights
The global strontium market is poised for robust expansion, projected to reach an estimated market size of $100 million by 2025, with a compelling CAGR exceeding 3.00% through 2033. This growth trajectory is primarily fueled by the increasing demand for strontium compounds in critical sectors such as electrical and electronics, where they are integral to CRT glass and surge protectors, and the pyrotechnics industry, renowned for its vibrant red coloration. Emerging applications in medical and dental fields, particularly in toothpastes for sensitive teeth and radiopaque coatings, are also contributing significantly to market momentum. Furthermore, the paints and coatings sector is leveraging strontium's anticorrosive properties, driving its adoption. The market's dynamism is further underscored by ongoing advancements in product development and manufacturing efficiencies, ensuring a steady supply of high-quality strontium carbonate, strontium sulfate, and strontium nitrate to meet evolving industry needs.
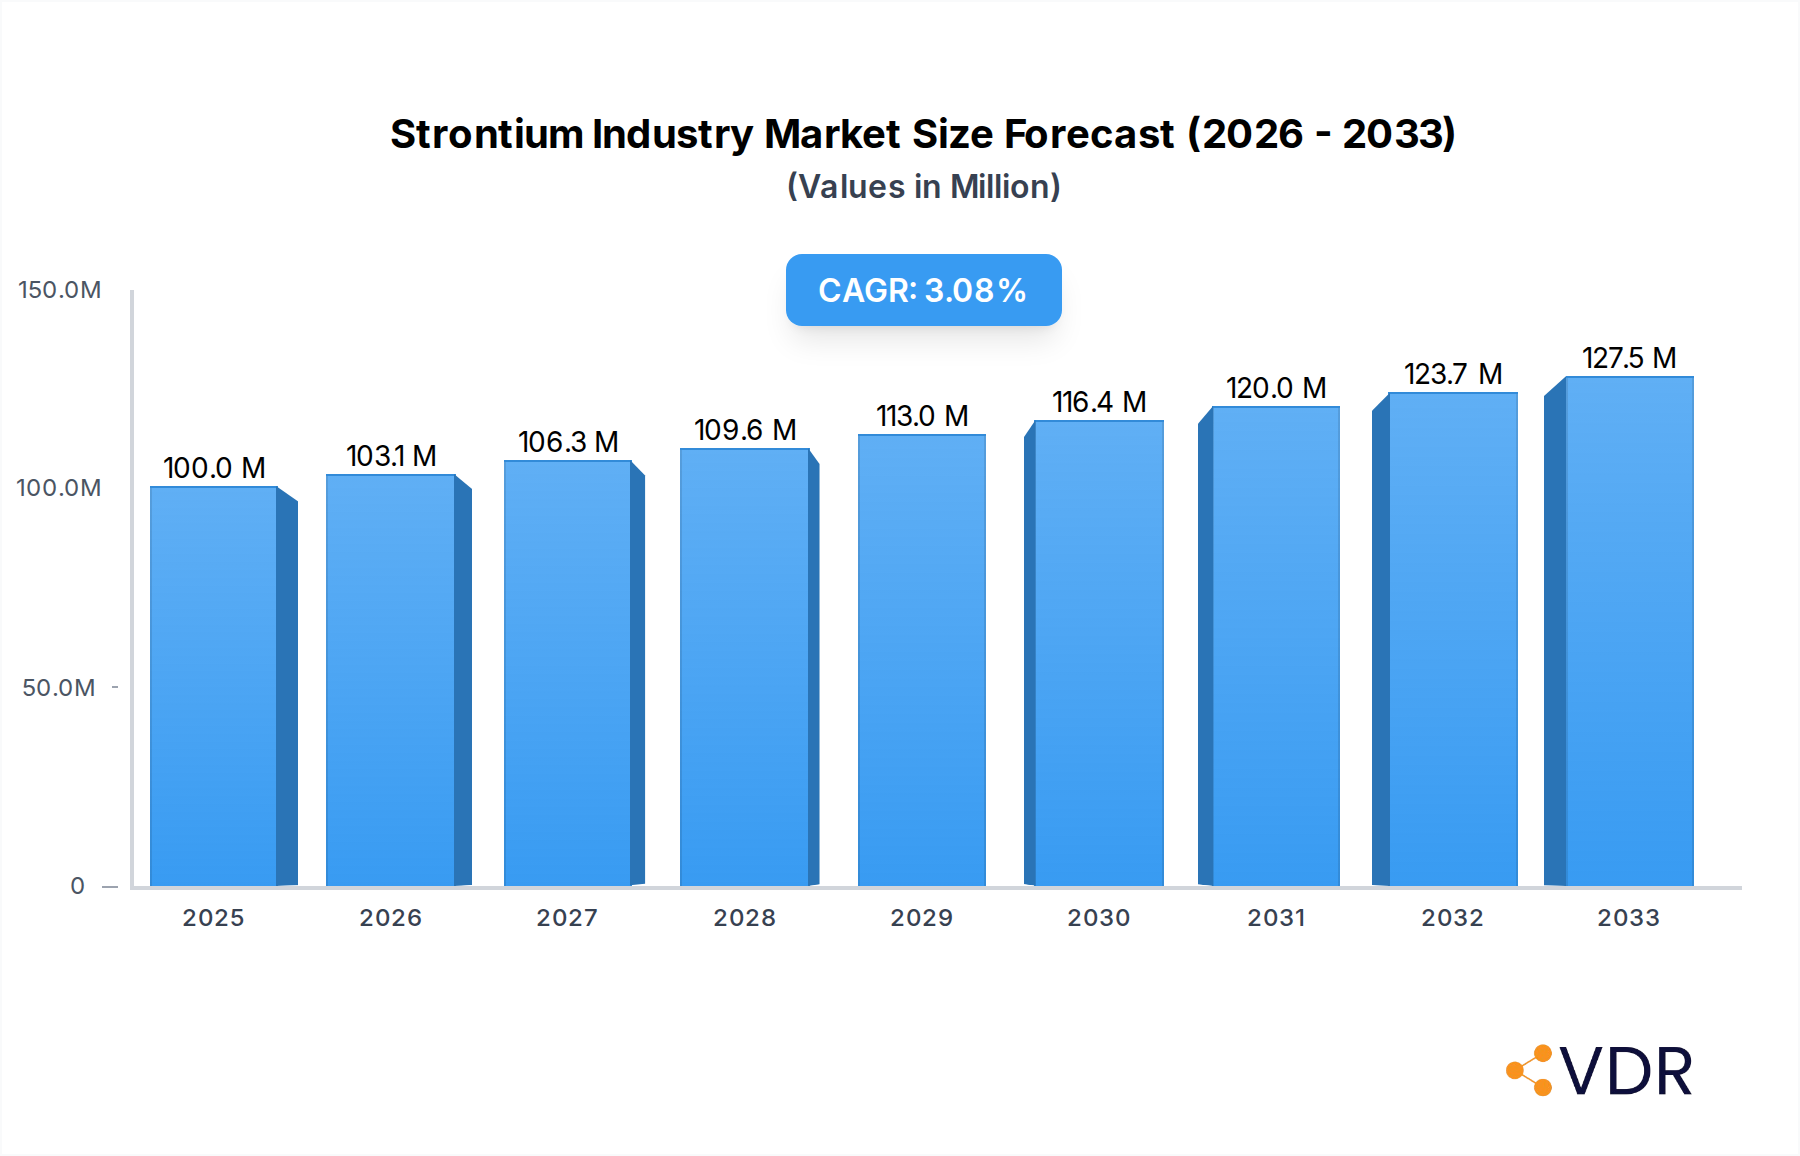
Strontium Industry Market Size (In Million)
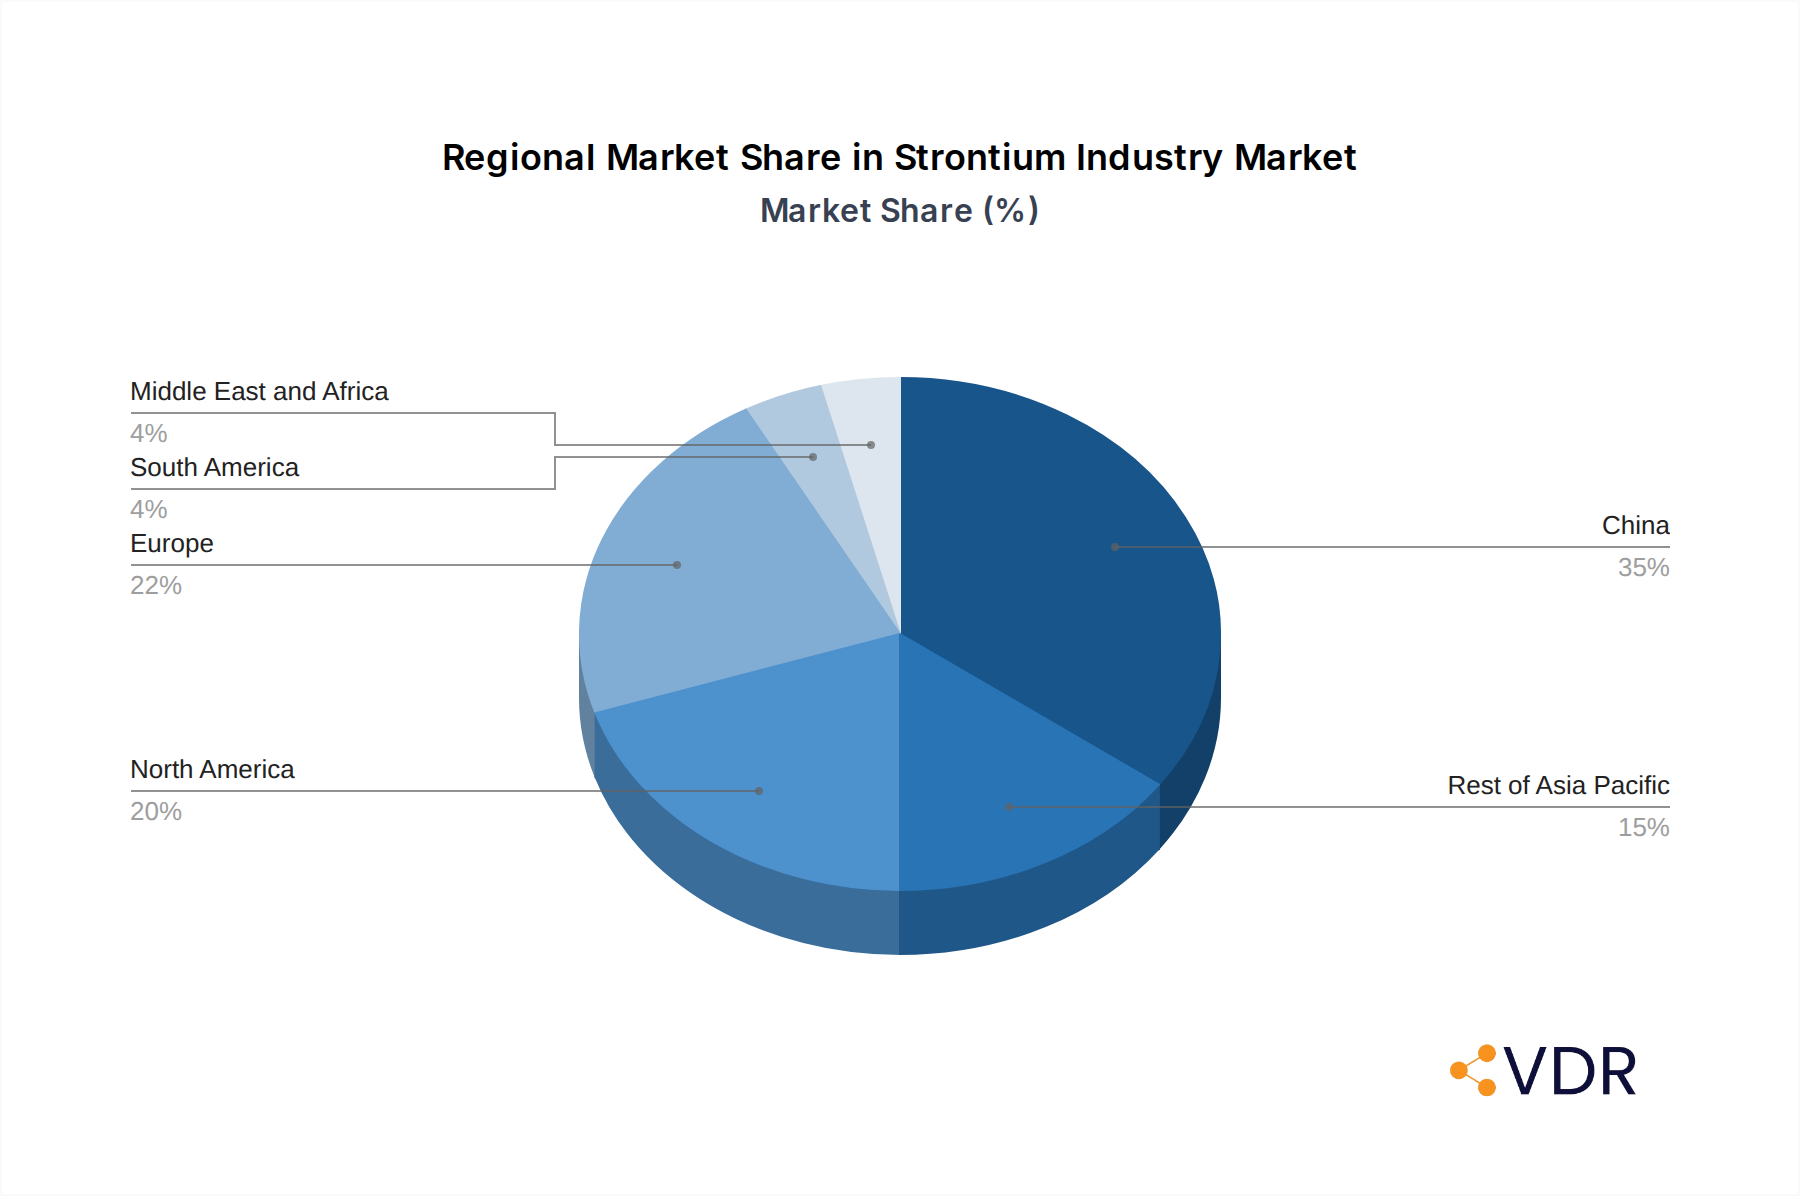
Despite the positive outlook, the strontium industry faces certain restraints, including fluctuating raw material prices and stringent environmental regulations associated with mining and processing. However, these challenges are being effectively addressed through technological innovations and a growing emphasis on sustainable practices. The dominant presence of China in strontium production and its significant consumption patterns are key regional dynamics. While North America and Europe represent substantial markets, the Asia Pacific region, led by China, is expected to be the primary growth engine. Key players like Solvay, KBM Affilips, and Shenzhou Jiaxin Chemical Co Ltd are at the forefront of this market, investing in R&D and strategic expansions to capitalize on the escalating demand for strontium and its diverse applications.

Strontium Industry Company Market Share
Strontium Industry Report: Market Dynamics, Growth Trends, and Future Outlook (2019-2033)
This comprehensive report provides an in-depth analysis of the global strontium industry, covering market dynamics, growth trends, regional dominance, product landscape, key drivers, challenges, opportunities, and the competitive environment. With a study period spanning from 2019 to 2033, this report offers critical insights for stakeholders navigating this vital sector. We delve into the parent and child market segments, providing a holistic view of the strontium ecosystem. All values are presented in Million units.
Strontium Industry Market Dynamics & Structure
The global strontium industry exhibits a moderately concentrated market structure, with a few key players dominating production and supply. Technological innovation remains a significant driver, particularly in enhancing the purity and specific properties of strontium compounds for specialized applications. Regulatory frameworks, including environmental and safety standards, play a crucial role in shaping production processes and market access. Competitive product substitutes, while present in some niche applications, generally offer limited performance parity with strontium-based materials, especially in high-demand areas. End-user demographics are increasingly influenced by the growth of industries like electronics, advanced materials, and specialty chemicals, driving demand for high-purity strontium products. Mergers and acquisition (M&A) trends are indicative of strategic consolidation and efforts to enhance market share and R&D capabilities. For instance, the recent integration of ProChem Inc. into SOCMA signifies a strategic move to strengthen advocacy and operational excellence within the specialty chemicals sector.
- Market Concentration: Dominated by established chemical manufacturers with significant production capacities.
- Technological Innovation: Focus on developing higher purity strontium compounds and novel synthesis methods to meet stringent application requirements.
- Regulatory Frameworks: Environmental regulations (e.g., REACH, EPA) influence production methods and waste management. Safety standards are paramount due to the nature of some strontium compounds.
- Competitive Substitutes: Limited in core applications like CRT glass (though declining), pyrotechnics, and specific medical uses.
- End-User Demographics: Driven by growth in electrical and electronics, medical devices, and advanced materials sectors.
- M&A Trends: Strategic acquisitions aimed at vertical integration, expanding product portfolios, and gaining market share.
Strontium Industry Growth Trends & Insights
The global strontium market is poised for robust growth, driven by a confluence of factors including expanding end-use applications and increasing demand for high-performance materials. The market size evolution is projected to witness a significant upward trajectory throughout the forecast period (2025-2033). Adoption rates for strontium-based products are particularly high in emerging economies, fueled by industrialization and technological advancements. Technological disruptions, such as advancements in material science and processing techniques, are continually enhancing the utility and cost-effectiveness of strontium compounds, thereby stimulating further adoption. Consumer behavior shifts, particularly in the automotive and aerospace sectors' demand for lightweight yet strong materials, indirectly benefit the strontium industry through its use in specialized alloys and coatings. The projected Compound Annual Growth Rate (CAGR) for the strontium industry is expected to be robust, reflecting sustained demand across various applications. Market penetration in newer applications like advanced battery technologies and specialized medical implants is anticipated to expand significantly. The historical period (2019-2024) laid the groundwork for this growth, with steady demand from traditional sectors. The base year (2025) serves as a critical benchmark for future projections.
Dominant Regions, Countries, or Segments in Strontium Industry
The Product segment of Strontium Carbonate is currently the dominant force driving growth in the global strontium industry. Its widespread use in the manufacturing of color television screens (though declining in volume, it remains significant in niche markets and historical context), glass ceramics, permanent magnets, and as a precursor for other strontium compounds makes it a cornerstone of the market. The Electrical and Electronics application segment also exhibits exceptional growth potential, particularly with the resurgence of certain display technologies and the demand for strontium in specialized components. Asia Pacific, specifically China, stands out as the leading region due to its extensive manufacturing base, significant domestic consumption, and substantial production capacity for strontium raw materials and processed compounds. Economic policies favoring industrial development, coupled with substantial infrastructure investments in chemical production facilities, underpin China's dominance. The region's market share in strontium carbonate production and consumption is substantial.
- Dominant Product Segment: Strontium Carbonate
- Key Drivers: Essential component in CRT glass manufacturing, glass-ceramics, permanent magnets, and as an intermediate for other strontium compounds.
- Market Share: Holds the largest share within the strontium product landscape.
- Growth Potential: Continued demand from specialty glass and magnetic materials industries.
- Dominant Application Segment: Electrical and Electronics
- Key Drivers: Historical demand from CRT displays, ongoing use in specialized electronic components, potential in emerging display technologies.
- Market Share: Significant historical and current market share.
- Growth Potential: Driven by innovation in electronics manufacturing and demand for specific material properties.
- Dominant Region: Asia Pacific (primarily China)
- Key Drivers: Large-scale manufacturing capabilities, robust domestic demand from electronics and glass industries, favorable industrial policies, significant raw material reserves.
- Market Share: Accounts for a substantial portion of global production and consumption.
- Growth Potential: Continuous expansion of manufacturing sectors and increasing adoption of strontium in new applications.
Strontium Industry Product Landscape
The strontium industry is characterized by a diverse product landscape, with Strontium Carbonate, Strontium Sulfate, and Strontium Nitrate being the primary offerings. Strontium Carbonate remains the workhorse, finding extensive use in glass manufacturing, particularly for older CRT televisions and specialized optical glass, and in the production of permanent magnets and fireworks. Strontium Sulfate, though less voluminous, is crucial in drilling fluids for the oil and gas industry and as a pigment. Strontium Nitrate is a key ingredient in pyrotechnics, imparting a vibrant red color to fireworks and flares. Emerging applications are also driving innovation, with research into strontium compounds for advanced battery technologies and specialized medical implants. The performance metrics of these products, such as purity levels and particle size distribution, are critical for their efficacy in specific applications, with companies focusing on tailoring these attributes to meet evolving industry demands.
Key Drivers, Barriers & Challenges in Strontium Industry
The strontium industry is propelled by several key drivers. The sustained demand from the Electrical and Electronics sector, even with the decline of CRTs, for specialized components and the growing use in Glass and Ceramics applications provide a stable foundation. The vibrant Pyrotechnic industry globally, especially for celebratory events, ensures a consistent demand for Strontium Nitrate. Furthermore, increasing interest in strontium compounds for advanced materials, including Medical and Dental applications and potential in energy storage, presents significant growth opportunities.
Conversely, the industry faces several barriers and challenges. The environmental impact of strontium mining and processing, coupled with stringent regulatory hurdles concerning waste disposal and emissions, poses a significant challenge. Fluctuations in the price of raw materials and energy costs directly impact production profitability. Supply chain disruptions, exacerbated by geopolitical factors and logistical complexities, can affect the availability and cost of strontium products. The declining CRT television market has necessitated a shift in focus towards new applications, requiring significant investment in research and development.
Emerging Opportunities in Strontium Industry
Emerging opportunities in the strontium industry are largely centered around innovative applications and advancements in material science. The potential use of strontium compounds in advanced battery technologies, particularly for solid-state batteries, represents a significant growth avenue. In the Medical and Dental fields, the biocompatibility and specific properties of strontium are being explored for bone regeneration materials and dental implants, promising high-value applications. Furthermore, the development of lightweight and high-strength strontium alloys for the aerospace and automotive industries could unlock new markets. The increasing focus on sustainable and eco-friendly materials may also create opportunities for novel strontium-based compounds with reduced environmental footprints.
Growth Accelerators in the Strontium Industry Industry
The strontium industry's long-term growth is being accelerated by a combination of technological breakthroughs and strategic market expansion. Continuous research and development into new applications, such as those in energy storage and advanced medical devices, are crucial. Strategic partnerships between raw material suppliers, chemical manufacturers, and end-users are vital for fostering innovation and ensuring market access. Market expansion into developing economies, where industrial growth is rapidly increasing, presents substantial opportunities. Furthermore, advancements in extraction and purification technologies that enhance efficiency and reduce environmental impact will also act as significant growth accelerators.
Key Players Shaping the Strontium Industry Market
- Solvay
- KBM Affilips
- Shenzhou Jiaxin Chemical Co Ltd
- Fertiberia
- Abassco
- Shijiazhuang Zhengding JINSHI Chemical Co Ltd
- Nanjing Jinyan Strontium Industry Co Ltd
- Joyieng Chemical Limited
- SAKAI CHEMICAL INDUSTRY CO LTD
- Hebei Xinji Chemical Group Co Ltd
- ProChem Inc
- Barium & Chemicals Inc
- Noah Chemicals
- Chongqing Yuanhe Fine Chemicals Inc
Notable Milestones in Strontium Industry Sector
- October 2023: ProChem Inc. joined the Society of Chemical Manufacturers & Affiliates (SOCMA), a US-based trade association dedicated to the specialty and fine chemicals industry. This affiliation signifies ProChem's commitment to legislative and regulatory advocacy, safety promotion, and enhanced business intelligence within the specialty chemicals sector, directly impacting operational strategies and market positioning.
In-Depth Strontium Industry Market Outlook
The strontium industry outlook is characterized by promising growth driven by diversification into high-value applications and technological advancements. The ongoing development of strontium-based materials for energy storage solutions, advanced medical implants, and specialized alloys in the automotive and aerospace sectors are key indicators of future market expansion. Strategic collaborations and a focus on sustainable production processes will be critical for capitalizing on these emerging opportunities. Furthermore, the industry's ability to adapt to evolving regulatory landscapes and leverage innovation will be paramount in shaping its trajectory over the next decade. The estimated market size for 2025 and beyond points towards sustained and significant growth.
Strontium Industry Segmentation
-
1. Product
- 1.1. Strontium Carbonate
- 1.2. Strontium Sulfate
- 1.3. Strontium Nitrate
- 1.4. Other Products (Strontium Hydroxide)
-
2. Application
- 2.1. Electrical and electronics
- 2.2. Medical and Dental
- 2.3. Paints and Coatings
- 2.4. Personal Care
- 2.5. Pyrotechnic
- 2.6. Other Applications (Glass and Ceramics)
Strontium Industry Segmentation By Geography
- 1. China
- 2. India
- 3. Japan
- 4. South Korea
- 5. Thailand
- 6. Malaysia
- 7. Indonesia
- 8. Vietnam
-
9. Rest of Asia Pacific
- 9.1. North America
- 10. United States
- 11. Canada
-
12. Mexico
- 12.1. Europe
- 13. Germany
- 14. United Kingdom
- 15. Italy
- 16. France
- 17. Spain
- 18. Turkey
- 19. Russia
- 20. NORDIC
-
21. Rest of Europe
- 21.1. South America
- 22. Brazil
- 23. Argentina
- 24. Colombia
-
25. Rest of South America
- 25.1. Middle East and Africa
- 26. Saudi Arabia
- 27. South Africa
- 28. Nigeria
- 29. Egypt
- 30. Qatar
- 31. United Arab Emirates
- 32. Rest of Middle East and Africa
Strontium Industry Regional Market Share
Geographic Coverage of Strontium Industry
Strontium Industry REPORT HIGHLIGHTS
| Aspects | Details |
|---|---|
| Study Period | 2020-2034 |
| Base Year | 2025 |
| Estimated Year | 2026 |
| Forecast Period | 2026-2034 |
| Historical Period | 2020-2025 |
| Growth Rate | CAGR of > 3.00% from 2020-2034 |
| Segmentation |
|
Table of Contents
- 1. Introduction
- 1.1. Research Scope
- 1.2. Market Segmentation
- 1.3. Research Objective
- 1.4. Definitions and Assumptions
- 2. Executive Summary
- 2.1. Market Snapshot
- 3. Market Dynamics
- 3.1. Market Drivers
- 3.2. Market Restrains
- 3.3. Market Trends
- 3.4. Market Opportunities
- 4. Market Factor Analysis
- 4.1. Porters Five Forces
- 4.1.1. Bargaining Power of Suppliers
- 4.1.2. Bargaining Power of Buyers
- 4.1.3. Threat of New Entrants
- 4.1.4. Threat of Substitutes
- 4.1.5. Competitive Rivalry
- 4.2. PESTEL analysis
- 4.3. BCG Analysis
- 4.3.1. Stars (High Growth, High Market Share)
- 4.3.2. Cash Cows (Low Growth, High Market Share)
- 4.3.3. Question Mark (High Growth, Low Market Share)
- 4.3.4. Dogs (Low Growth, Low Market Share)
- 4.4. Ansoff Matrix Analysis
- 4.5. Supply Chain Analysis
- 4.6. Regulatory Landscape
- 4.7. Current Market Potential and Opportunity Assessment (TAM–SAM–SOM Framework)
- 4.8. VDR Analyst Note
- 4.1. Porters Five Forces
- 5. Market Analysis, Insights and Forecast 2021-2033
- 5.1. Market Analysis, Insights and Forecast - by Product
- 5.1.1. Strontium Carbonate
- 5.1.2. Strontium Sulfate
- 5.1.3. Strontium Nitrate
- 5.1.4. Other Products (Strontium Hydroxide)
- 5.2. Market Analysis, Insights and Forecast - by Application
- 5.2.1. Electrical and electronics
- 5.2.2. Medical and Dental
- 5.2.3. Paints and Coatings
- 5.2.4. Personal Care
- 5.2.5. Pyrotechnic
- 5.2.6. Other Applications (Glass and Ceramics)
- 5.3. Market Analysis, Insights and Forecast - by Region
- 5.3.1. China
- 5.3.2. India
- 5.3.3. Japan
- 5.3.4. South Korea
- 5.3.5. Thailand
- 5.3.6. Malaysia
- 5.3.7. Indonesia
- 5.3.8. Vietnam
- 5.3.9. Rest of Asia Pacific
- 5.3.10. United States
- 5.3.11. Canada
- 5.3.12. Mexico
- 5.3.13. Germany
- 5.3.14. United Kingdom
- 5.3.15. Italy
- 5.3.16. France
- 5.3.17. Spain
- 5.3.18. Turkey
- 5.3.19. Russia
- 5.3.20. NORDIC
- 5.3.21. Rest of Europe
- 5.3.22. Brazil
- 5.3.23. Argentina
- 5.3.24. Colombia
- 5.3.25. Rest of South America
- 5.3.26. Saudi Arabia
- 5.3.27. South Africa
- 5.3.28. Nigeria
- 5.3.29. Egypt
- 5.3.30. Qatar
- 5.3.31. United Arab Emirates
- 5.3.32. Rest of Middle East and Africa
- 5.1. Market Analysis, Insights and Forecast - by Product
- 6. Global Strontium Industry Analysis, Insights and Forecast, 2021-2033
- 6.1. Market Analysis, Insights and Forecast - by Product
- 6.1.1. Strontium Carbonate
- 6.1.2. Strontium Sulfate
- 6.1.3. Strontium Nitrate
- 6.1.4. Other Products (Strontium Hydroxide)
- 6.2. Market Analysis, Insights and Forecast - by Application
- 6.2.1. Electrical and electronics
- 6.2.2. Medical and Dental
- 6.2.3. Paints and Coatings
- 6.2.4. Personal Care
- 6.2.5. Pyrotechnic
- 6.2.6. Other Applications (Glass and Ceramics)
- 6.1. Market Analysis, Insights and Forecast - by Product
- 7. China Strontium Industry Analysis, Insights and Forecast, 2021-2033
- 7.1. Market Analysis, Insights and Forecast - by Product
- 7.1.1. Strontium Carbonate
- 7.1.2. Strontium Sulfate
- 7.1.3. Strontium Nitrate
- 7.1.4. Other Products (Strontium Hydroxide)
- 7.2. Market Analysis, Insights and Forecast - by Application
- 7.2.1. Electrical and electronics
- 7.2.2. Medical and Dental
- 7.2.3. Paints and Coatings
- 7.2.4. Personal Care
- 7.2.5. Pyrotechnic
- 7.2.6. Other Applications (Glass and Ceramics)
- 7.1. Market Analysis, Insights and Forecast - by Product
- 8. India Strontium Industry Analysis, Insights and Forecast, 2021-2033
- 8.1. Market Analysis, Insights and Forecast - by Product
- 8.1.1. Strontium Carbonate
- 8.1.2. Strontium Sulfate
- 8.1.3. Strontium Nitrate
- 8.1.4. Other Products (Strontium Hydroxide)
- 8.2. Market Analysis, Insights and Forecast - by Application
- 8.2.1. Electrical and electronics
- 8.2.2. Medical and Dental
- 8.2.3. Paints and Coatings
- 8.2.4. Personal Care
- 8.2.5. Pyrotechnic
- 8.2.6. Other Applications (Glass and Ceramics)
- 8.1. Market Analysis, Insights and Forecast - by Product
- 9. Japan Strontium Industry Analysis, Insights and Forecast, 2021-2033
- 9.1. Market Analysis, Insights and Forecast - by Product
- 9.1.1. Strontium Carbonate
- 9.1.2. Strontium Sulfate
- 9.1.3. Strontium Nitrate
- 9.1.4. Other Products (Strontium Hydroxide)
- 9.2. Market Analysis, Insights and Forecast - by Application
- 9.2.1. Electrical and electronics
- 9.2.2. Medical and Dental
- 9.2.3. Paints and Coatings
- 9.2.4. Personal Care
- 9.2.5. Pyrotechnic
- 9.2.6. Other Applications (Glass and Ceramics)
- 9.1. Market Analysis, Insights and Forecast - by Product
- 10. South Korea Strontium Industry Analysis, Insights and Forecast, 2021-2033
- 10.1. Market Analysis, Insights and Forecast - by Product
- 10.1.1. Strontium Carbonate
- 10.1.2. Strontium Sulfate
- 10.1.3. Strontium Nitrate
- 10.1.4. Other Products (Strontium Hydroxide)
- 10.2. Market Analysis, Insights and Forecast - by Application
- 10.2.1. Electrical and electronics
- 10.2.2. Medical and Dental
- 10.2.3. Paints and Coatings
- 10.2.4. Personal Care
- 10.2.5. Pyrotechnic
- 10.2.6. Other Applications (Glass and Ceramics)
- 10.1. Market Analysis, Insights and Forecast - by Product
- 11. Thailand Strontium Industry Analysis, Insights and Forecast, 2021-2033
- 11.1. Market Analysis, Insights and Forecast - by Product
- 11.1.1. Strontium Carbonate
- 11.1.2. Strontium Sulfate
- 11.1.3. Strontium Nitrate
- 11.1.4. Other Products (Strontium Hydroxide)
- 11.2. Market Analysis, Insights and Forecast - by Application
- 11.2.1. Electrical and electronics
- 11.2.2. Medical and Dental
- 11.2.3. Paints and Coatings
- 11.2.4. Personal Care
- 11.2.5. Pyrotechnic
- 11.2.6. Other Applications (Glass and Ceramics)
- 11.1. Market Analysis, Insights and Forecast - by Product
- 12. Malaysia Strontium Industry Analysis, Insights and Forecast, 2021-2033
- 12.1. Market Analysis, Insights and Forecast - by Product
- 12.1.1. Strontium Carbonate
- 12.1.2. Strontium Sulfate
- 12.1.3. Strontium Nitrate
- 12.1.4. Other Products (Strontium Hydroxide)
- 12.2. Market Analysis, Insights and Forecast - by Application
- 12.2.1. Electrical and electronics
- 12.2.2. Medical and Dental
- 12.2.3. Paints and Coatings
- 12.2.4. Personal Care
- 12.2.5. Pyrotechnic
- 12.2.6. Other Applications (Glass and Ceramics)
- 12.1. Market Analysis, Insights and Forecast - by Product
- 13. Indonesia Strontium Industry Analysis, Insights and Forecast, 2021-2033
- 13.1. Market Analysis, Insights and Forecast - by Product
- 13.1.1. Strontium Carbonate
- 13.1.2. Strontium Sulfate
- 13.1.3. Strontium Nitrate
- 13.1.4. Other Products (Strontium Hydroxide)
- 13.2. Market Analysis, Insights and Forecast - by Application
- 13.2.1. Electrical and electronics
- 13.2.2. Medical and Dental
- 13.2.3. Paints and Coatings
- 13.2.4. Personal Care
- 13.2.5. Pyrotechnic
- 13.2.6. Other Applications (Glass and Ceramics)
- 13.1. Market Analysis, Insights and Forecast - by Product
- 14. Vietnam Strontium Industry Analysis, Insights and Forecast, 2021-2033
- 14.1. Market Analysis, Insights and Forecast - by Product
- 14.1.1. Strontium Carbonate
- 14.1.2. Strontium Sulfate
- 14.1.3. Strontium Nitrate
- 14.1.4. Other Products (Strontium Hydroxide)
- 14.2. Market Analysis, Insights and Forecast - by Application
- 14.2.1. Electrical and electronics
- 14.2.2. Medical and Dental
- 14.2.3. Paints and Coatings
- 14.2.4. Personal Care
- 14.2.5. Pyrotechnic
- 14.2.6. Other Applications (Glass and Ceramics)
- 14.1. Market Analysis, Insights and Forecast - by Product
- 15. Rest of Asia Pacific Strontium Industry Analysis, Insights and Forecast, 2021-2033
- 15.1. Market Analysis, Insights and Forecast - by Product
- 15.1.1. Strontium Carbonate
- 15.1.2. Strontium Sulfate
- 15.1.3. Strontium Nitrate
- 15.1.4. Other Products (Strontium Hydroxide)
- 15.2. Market Analysis, Insights and Forecast - by Application
- 15.2.1. Electrical and electronics
- 15.2.2. Medical and Dental
- 15.2.3. Paints and Coatings
- 15.2.4. Personal Care
- 15.2.5. Pyrotechnic
- 15.2.6. Other Applications (Glass and Ceramics)
- 15.1. Market Analysis, Insights and Forecast - by Product
- 16. United States Strontium Industry Analysis, Insights and Forecast, 2021-2033
- 16.1. Market Analysis, Insights and Forecast - by Product
- 16.1.1. Strontium Carbonate
- 16.1.2. Strontium Sulfate
- 16.1.3. Strontium Nitrate
- 16.1.4. Other Products (Strontium Hydroxide)
- 16.2. Market Analysis, Insights and Forecast - by Application
- 16.2.1. Electrical and electronics
- 16.2.2. Medical and Dental
- 16.2.3. Paints and Coatings
- 16.2.4. Personal Care
- 16.2.5. Pyrotechnic
- 16.2.6. Other Applications (Glass and Ceramics)
- 16.1. Market Analysis, Insights and Forecast - by Product
- 17. Canada Strontium Industry Analysis, Insights and Forecast, 2021-2033
- 17.1. Market Analysis, Insights and Forecast - by Product
- 17.1.1. Strontium Carbonate
- 17.1.2. Strontium Sulfate
- 17.1.3. Strontium Nitrate
- 17.1.4. Other Products (Strontium Hydroxide)
- 17.2. Market Analysis, Insights and Forecast - by Application
- 17.2.1. Electrical and electronics
- 17.2.2. Medical and Dental
- 17.2.3. Paints and Coatings
- 17.2.4. Personal Care
- 17.2.5. Pyrotechnic
- 17.2.6. Other Applications (Glass and Ceramics)
- 17.1. Market Analysis, Insights and Forecast - by Product
- 18. Mexico Strontium Industry Analysis, Insights and Forecast, 2021-2033
- 18.1. Market Analysis, Insights and Forecast - by Product
- 18.1.1. Strontium Carbonate
- 18.1.2. Strontium Sulfate
- 18.1.3. Strontium Nitrate
- 18.1.4. Other Products (Strontium Hydroxide)
- 18.2. Market Analysis, Insights and Forecast - by Application
- 18.2.1. Electrical and electronics
- 18.2.2. Medical and Dental
- 18.2.3. Paints and Coatings
- 18.2.4. Personal Care
- 18.2.5. Pyrotechnic
- 18.2.6. Other Applications (Glass and Ceramics)
- 18.1. Market Analysis, Insights and Forecast - by Product
- 19. Germany Strontium Industry Analysis, Insights and Forecast, 2021-2033
- 19.1. Market Analysis, Insights and Forecast - by Product
- 19.1.1. Strontium Carbonate
- 19.1.2. Strontium Sulfate
- 19.1.3. Strontium Nitrate
- 19.1.4. Other Products (Strontium Hydroxide)
- 19.2. Market Analysis, Insights and Forecast - by Application
- 19.2.1. Electrical and electronics
- 19.2.2. Medical and Dental
- 19.2.3. Paints and Coatings
- 19.2.4. Personal Care
- 19.2.5. Pyrotechnic
- 19.2.6. Other Applications (Glass and Ceramics)
- 19.1. Market Analysis, Insights and Forecast - by Product
- 20. United Kingdom Strontium Industry Analysis, Insights and Forecast, 2021-2033
- 20.1. Market Analysis, Insights and Forecast - by Product
- 20.1.1. Strontium Carbonate
- 20.1.2. Strontium Sulfate
- 20.1.3. Strontium Nitrate
- 20.1.4. Other Products (Strontium Hydroxide)
- 20.2. Market Analysis, Insights and Forecast - by Application
- 20.2.1. Electrical and electronics
- 20.2.2. Medical and Dental
- 20.2.3. Paints and Coatings
- 20.2.4. Personal Care
- 20.2.5. Pyrotechnic
- 20.2.6. Other Applications (Glass and Ceramics)
- 20.1. Market Analysis, Insights and Forecast - by Product
- 21. Italy Strontium Industry Analysis, Insights and Forecast, 2021-2033
- 21.1. Market Analysis, Insights and Forecast - by Product
- 21.1.1. Strontium Carbonate
- 21.1.2. Strontium Sulfate
- 21.1.3. Strontium Nitrate
- 21.1.4. Other Products (Strontium Hydroxide)
- 21.2. Market Analysis, Insights and Forecast - by Application
- 21.2.1. Electrical and electronics
- 21.2.2. Medical and Dental
- 21.2.3. Paints and Coatings
- 21.2.4. Personal Care
- 21.2.5. Pyrotechnic
- 21.2.6. Other Applications (Glass and Ceramics)
- 21.1. Market Analysis, Insights and Forecast - by Product
- 22. France Strontium Industry Analysis, Insights and Forecast, 2021-2033
- 22.1. Market Analysis, Insights and Forecast - by Product
- 22.1.1. Strontium Carbonate
- 22.1.2. Strontium Sulfate
- 22.1.3. Strontium Nitrate
- 22.1.4. Other Products (Strontium Hydroxide)
- 22.2. Market Analysis, Insights and Forecast - by Application
- 22.2.1. Electrical and electronics
- 22.2.2. Medical and Dental
- 22.2.3. Paints and Coatings
- 22.2.4. Personal Care
- 22.2.5. Pyrotechnic
- 22.2.6. Other Applications (Glass and Ceramics)
- 22.1. Market Analysis, Insights and Forecast - by Product
- 23. Spain Strontium Industry Analysis, Insights and Forecast, 2021-2033
- 23.1. Market Analysis, Insights and Forecast - by Product
- 23.1.1. Strontium Carbonate
- 23.1.2. Strontium Sulfate
- 23.1.3. Strontium Nitrate
- 23.1.4. Other Products (Strontium Hydroxide)
- 23.2. Market Analysis, Insights and Forecast - by Application
- 23.2.1. Electrical and electronics
- 23.2.2. Medical and Dental
- 23.2.3. Paints and Coatings
- 23.2.4. Personal Care
- 23.2.5. Pyrotechnic
- 23.2.6. Other Applications (Glass and Ceramics)
- 23.1. Market Analysis, Insights and Forecast - by Product
- 24. Turkey Strontium Industry Analysis, Insights and Forecast, 2021-2033
- 24.1. Market Analysis, Insights and Forecast - by Product
- 24.1.1. Strontium Carbonate
- 24.1.2. Strontium Sulfate
- 24.1.3. Strontium Nitrate
- 24.1.4. Other Products (Strontium Hydroxide)
- 24.2. Market Analysis, Insights and Forecast - by Application
- 24.2.1. Electrical and electronics
- 24.2.2. Medical and Dental
- 24.2.3. Paints and Coatings
- 24.2.4. Personal Care
- 24.2.5. Pyrotechnic
- 24.2.6. Other Applications (Glass and Ceramics)
- 24.1. Market Analysis, Insights and Forecast - by Product
- 25. Russia Strontium Industry Analysis, Insights and Forecast, 2021-2033
- 25.1. Market Analysis, Insights and Forecast - by Product
- 25.1.1. Strontium Carbonate
- 25.1.2. Strontium Sulfate
- 25.1.3. Strontium Nitrate
- 25.1.4. Other Products (Strontium Hydroxide)
- 25.2. Market Analysis, Insights and Forecast - by Application
- 25.2.1. Electrical and electronics
- 25.2.2. Medical and Dental
- 25.2.3. Paints and Coatings
- 25.2.4. Personal Care
- 25.2.5. Pyrotechnic
- 25.2.6. Other Applications (Glass and Ceramics)
- 25.1. Market Analysis, Insights and Forecast - by Product
- 26. NORDIC Strontium Industry Analysis, Insights and Forecast, 2021-2033
- 26.1. Market Analysis, Insights and Forecast - by Product
- 26.1.1. Strontium Carbonate
- 26.1.2. Strontium Sulfate
- 26.1.3. Strontium Nitrate
- 26.1.4. Other Products (Strontium Hydroxide)
- 26.2. Market Analysis, Insights and Forecast - by Application
- 26.2.1. Electrical and electronics
- 26.2.2. Medical and Dental
- 26.2.3. Paints and Coatings
- 26.2.4. Personal Care
- 26.2.5. Pyrotechnic
- 26.2.6. Other Applications (Glass and Ceramics)
- 26.1. Market Analysis, Insights and Forecast - by Product
- 27. Rest of Europe Strontium Industry Analysis, Insights and Forecast, 2021-2033
- 27.1. Market Analysis, Insights and Forecast - by Product
- 27.1.1. Strontium Carbonate
- 27.1.2. Strontium Sulfate
- 27.1.3. Strontium Nitrate
- 27.1.4. Other Products (Strontium Hydroxide)
- 27.2. Market Analysis, Insights and Forecast - by Application
- 27.2.1. Electrical and electronics
- 27.2.2. Medical and Dental
- 27.2.3. Paints and Coatings
- 27.2.4. Personal Care
- 27.2.5. Pyrotechnic
- 27.2.6. Other Applications (Glass and Ceramics)
- 27.1. Market Analysis, Insights and Forecast - by Product
- 28. Brazil Strontium Industry Analysis, Insights and Forecast, 2021-2033
- 28.1. Market Analysis, Insights and Forecast - by Product
- 28.1.1. Strontium Carbonate
- 28.1.2. Strontium Sulfate
- 28.1.3. Strontium Nitrate
- 28.1.4. Other Products (Strontium Hydroxide)
- 28.2. Market Analysis, Insights and Forecast - by Application
- 28.2.1. Electrical and electronics
- 28.2.2. Medical and Dental
- 28.2.3. Paints and Coatings
- 28.2.4. Personal Care
- 28.2.5. Pyrotechnic
- 28.2.6. Other Applications (Glass and Ceramics)
- 28.1. Market Analysis, Insights and Forecast - by Product
- 29. Argentina Strontium Industry Analysis, Insights and Forecast, 2021-2033
- 29.1. Market Analysis, Insights and Forecast - by Product
- 29.1.1. Strontium Carbonate
- 29.1.2. Strontium Sulfate
- 29.1.3. Strontium Nitrate
- 29.1.4. Other Products (Strontium Hydroxide)
- 29.2. Market Analysis, Insights and Forecast - by Application
- 29.2.1. Electrical and electronics
- 29.2.2. Medical and Dental
- 29.2.3. Paints and Coatings
- 29.2.4. Personal Care
- 29.2.5. Pyrotechnic
- 29.2.6. Other Applications (Glass and Ceramics)
- 29.1. Market Analysis, Insights and Forecast - by Product
- 30. Colombia Strontium Industry Analysis, Insights and Forecast, 2021-2033
- 30.1. Market Analysis, Insights and Forecast - by Product
- 30.1.1. Strontium Carbonate
- 30.1.2. Strontium Sulfate
- 30.1.3. Strontium Nitrate
- 30.1.4. Other Products (Strontium Hydroxide)
- 30.2. Market Analysis, Insights and Forecast - by Application
- 30.2.1. Electrical and electronics
- 30.2.2. Medical and Dental
- 30.2.3. Paints and Coatings
- 30.2.4. Personal Care
- 30.2.5. Pyrotechnic
- 30.2.6. Other Applications (Glass and Ceramics)
- 30.1. Market Analysis, Insights and Forecast - by Product
- 31. Rest of South America Strontium Industry Analysis, Insights and Forecast, 2021-2033
- 31.1. Market Analysis, Insights and Forecast - by Product
- 31.1.1. Strontium Carbonate
- 31.1.2. Strontium Sulfate
- 31.1.3. Strontium Nitrate
- 31.1.4. Other Products (Strontium Hydroxide)
- 31.2. Market Analysis, Insights and Forecast - by Application
- 31.2.1. Electrical and electronics
- 31.2.2. Medical and Dental
- 31.2.3. Paints and Coatings
- 31.2.4. Personal Care
- 31.2.5. Pyrotechnic
- 31.2.6. Other Applications (Glass and Ceramics)
- 31.1. Market Analysis, Insights and Forecast - by Product
- 32. Saudi Arabia Strontium Industry Analysis, Insights and Forecast, 2021-2033
- 32.1. Market Analysis, Insights and Forecast - by Product
- 32.1.1. Strontium Carbonate
- 32.1.2. Strontium Sulfate
- 32.1.3. Strontium Nitrate
- 32.1.4. Other Products (Strontium Hydroxide)
- 32.2. Market Analysis, Insights and Forecast - by Application
- 32.2.1. Electrical and electronics
- 32.2.2. Medical and Dental
- 32.2.3. Paints and Coatings
- 32.2.4. Personal Care
- 32.2.5. Pyrotechnic
- 32.2.6. Other Applications (Glass and Ceramics)
- 32.1. Market Analysis, Insights and Forecast - by Product
- 33. South Africa Strontium Industry Analysis, Insights and Forecast, 2021-2033
- 33.1. Market Analysis, Insights and Forecast - by Product
- 33.1.1. Strontium Carbonate
- 33.1.2. Strontium Sulfate
- 33.1.3. Strontium Nitrate
- 33.1.4. Other Products (Strontium Hydroxide)
- 33.2. Market Analysis, Insights and Forecast - by Application
- 33.2.1. Electrical and electronics
- 33.2.2. Medical and Dental
- 33.2.3. Paints and Coatings
- 33.2.4. Personal Care
- 33.2.5. Pyrotechnic
- 33.2.6. Other Applications (Glass and Ceramics)
- 33.1. Market Analysis, Insights and Forecast - by Product
- 34. Nigeria Strontium Industry Analysis, Insights and Forecast, 2021-2033
- 34.1. Market Analysis, Insights and Forecast - by Product
- 34.1.1. Strontium Carbonate
- 34.1.2. Strontium Sulfate
- 34.1.3. Strontium Nitrate
- 34.1.4. Other Products (Strontium Hydroxide)
- 34.2. Market Analysis, Insights and Forecast - by Application
- 34.2.1. Electrical and electronics
- 34.2.2. Medical and Dental
- 34.2.3. Paints and Coatings
- 34.2.4. Personal Care
- 34.2.5. Pyrotechnic
- 34.2.6. Other Applications (Glass and Ceramics)
- 34.1. Market Analysis, Insights and Forecast - by Product
- 35. Egypt Strontium Industry Analysis, Insights and Forecast, 2021-2033
- 35.1. Market Analysis, Insights and Forecast - by Product
- 35.1.1. Strontium Carbonate
- 35.1.2. Strontium Sulfate
- 35.1.3. Strontium Nitrate
- 35.1.4. Other Products (Strontium Hydroxide)
- 35.2. Market Analysis, Insights and Forecast - by Application
- 35.2.1. Electrical and electronics
- 35.2.2. Medical and Dental
- 35.2.3. Paints and Coatings
- 35.2.4. Personal Care
- 35.2.5. Pyrotechnic
- 35.2.6. Other Applications (Glass and Ceramics)
- 35.1. Market Analysis, Insights and Forecast - by Product
- 36. Qatar Strontium Industry Analysis, Insights and Forecast, 2021-2033
- 36.1. Market Analysis, Insights and Forecast - by Product
- 36.1.1. Strontium Carbonate
- 36.1.2. Strontium Sulfate
- 36.1.3. Strontium Nitrate
- 36.1.4. Other Products (Strontium Hydroxide)
- 36.2. Market Analysis, Insights and Forecast - by Application
- 36.2.1. Electrical and electronics
- 36.2.2. Medical and Dental
- 36.2.3. Paints and Coatings
- 36.2.4. Personal Care
- 36.2.5. Pyrotechnic
- 36.2.6. Other Applications (Glass and Ceramics)
- 36.1. Market Analysis, Insights and Forecast - by Product
- 37. United Arab Emirates Strontium Industry Analysis, Insights and Forecast, 2021-2033
- 37.1. Market Analysis, Insights and Forecast - by Product
- 37.1.1. Strontium Carbonate
- 37.1.2. Strontium Sulfate
- 37.1.3. Strontium Nitrate
- 37.1.4. Other Products (Strontium Hydroxide)
- 37.2. Market Analysis, Insights and Forecast - by Application
- 37.2.1. Electrical and electronics
- 37.2.2. Medical and Dental
- 37.2.3. Paints and Coatings
- 37.2.4. Personal Care
- 37.2.5. Pyrotechnic
- 37.2.6. Other Applications (Glass and Ceramics)
- 37.1. Market Analysis, Insights and Forecast - by Product
- 38. Rest of Middle East and Africa Strontium Industry Analysis, Insights and Forecast, 2021-2033
- 38.1. Market Analysis, Insights and Forecast - by Product
- 38.1.1. Strontium Carbonate
- 38.1.2. Strontium Sulfate
- 38.1.3. Strontium Nitrate
- 38.1.4. Other Products (Strontium Hydroxide)
- 38.2. Market Analysis, Insights and Forecast - by Application
- 38.2.1. Electrical and electronics
- 38.2.2. Medical and Dental
- 38.2.3. Paints and Coatings
- 38.2.4. Personal Care
- 38.2.5. Pyrotechnic
- 38.2.6. Other Applications (Glass and Ceramics)
- 38.1. Market Analysis, Insights and Forecast - by Product
- 39. Competitive Analysis
- 39.1. Company Profiles
- 39.1.1 Solvay*List Not Exhaustive
- 39.1.1.1. Company Overview
- 39.1.1.2. Products
- 39.1.1.3. Company Financials
- 39.1.1.4. SWOT Analysis
- 39.1.2 KBM Affilips
- 39.1.2.1. Company Overview
- 39.1.2.2. Products
- 39.1.2.3. Company Financials
- 39.1.2.4. SWOT Analysis
- 39.1.3 Shenzhou Jiaxin Chemical Co Ltd
- 39.1.3.1. Company Overview
- 39.1.3.2. Products
- 39.1.3.3. Company Financials
- 39.1.3.4. SWOT Analysis
- 39.1.4 Fertiberia
- 39.1.4.1. Company Overview
- 39.1.4.2. Products
- 39.1.4.3. Company Financials
- 39.1.4.4. SWOT Analysis
- 39.1.5 Abassco
- 39.1.5.1. Company Overview
- 39.1.5.2. Products
- 39.1.5.3. Company Financials
- 39.1.5.4. SWOT Analysis
- 39.1.6 Shijiazhuang Zhengding JINSHI Chemical Co Ltd
- 39.1.6.1. Company Overview
- 39.1.6.2. Products
- 39.1.6.3. Company Financials
- 39.1.6.4. SWOT Analysis
- 39.1.7 Nanjing Jinyan Strontium Industry Co Ltd
- 39.1.7.1. Company Overview
- 39.1.7.2. Products
- 39.1.7.3. Company Financials
- 39.1.7.4. SWOT Analysis
- 39.1.8 Joyieng Chemical Limited
- 39.1.8.1. Company Overview
- 39.1.8.2. Products
- 39.1.8.3. Company Financials
- 39.1.8.4. SWOT Analysis
- 39.1.9 SAKAI CHEMICAL INDUSTRY CO LTD
- 39.1.9.1. Company Overview
- 39.1.9.2. Products
- 39.1.9.3. Company Financials
- 39.1.9.4. SWOT Analysis
- 39.1.10 Hebei Xinji Chemical Group Co Ltd
- 39.1.10.1. Company Overview
- 39.1.10.2. Products
- 39.1.10.3. Company Financials
- 39.1.10.4. SWOT Analysis
- 39.1.11 ProChem Inc
- 39.1.11.1. Company Overview
- 39.1.11.2. Products
- 39.1.11.3. Company Financials
- 39.1.11.4. SWOT Analysis
- 39.1.12 Barium & Chemicals Inc
- 39.1.12.1. Company Overview
- 39.1.12.2. Products
- 39.1.12.3. Company Financials
- 39.1.12.4. SWOT Analysis
- 39.1.13 Noah Chemicals
- 39.1.13.1. Company Overview
- 39.1.13.2. Products
- 39.1.13.3. Company Financials
- 39.1.13.4. SWOT Analysis
- 39.1.14 Chongqing Yuanhe Fine Chemicals Inc
- 39.1.14.1. Company Overview
- 39.1.14.2. Products
- 39.1.14.3. Company Financials
- 39.1.14.4. SWOT Analysis
- 39.1.1 Solvay*List Not Exhaustive
- 39.2. Market Entropy
- 39.2.1 Company's Key Areas Served
- 39.2.2 Recent Developments
- 39.3. Company Market Share Analysis 2025
- 39.3.1 Top 5 Companies Market Share Analysis
- 39.3.2 Top 3 Companies Market Share Analysis
- 39.4. List of Potential Customers
- 40. Research Methodology
List of Figures
- Figure 1: Global Strontium Industry Revenue Breakdown (Million, %) by Region 2025 & 2033
- Figure 2: China Strontium Industry Revenue (Million), by Product 2025 & 2033
- Figure 3: China Strontium Industry Revenue Share (%), by Product 2025 & 2033
- Figure 4: China Strontium Industry Revenue (Million), by Application 2025 & 2033
- Figure 5: China Strontium Industry Revenue Share (%), by Application 2025 & 2033
- Figure 6: China Strontium Industry Revenue (Million), by Country 2025 & 2033
- Figure 7: China Strontium Industry Revenue Share (%), by Country 2025 & 2033
- Figure 8: India Strontium Industry Revenue (Million), by Product 2025 & 2033
- Figure 9: India Strontium Industry Revenue Share (%), by Product 2025 & 2033
- Figure 10: India Strontium Industry Revenue (Million), by Application 2025 & 2033
- Figure 11: India Strontium Industry Revenue Share (%), by Application 2025 & 2033
- Figure 12: India Strontium Industry Revenue (Million), by Country 2025 & 2033
- Figure 13: India Strontium Industry Revenue Share (%), by Country 2025 & 2033
- Figure 14: Japan Strontium Industry Revenue (Million), by Product 2025 & 2033
- Figure 15: Japan Strontium Industry Revenue Share (%), by Product 2025 & 2033
- Figure 16: Japan Strontium Industry Revenue (Million), by Application 2025 & 2033
- Figure 17: Japan Strontium Industry Revenue Share (%), by Application 2025 & 2033
- Figure 18: Japan Strontium Industry Revenue (Million), by Country 2025 & 2033
- Figure 19: Japan Strontium Industry Revenue Share (%), by Country 2025 & 2033
- Figure 20: South Korea Strontium Industry Revenue (Million), by Product 2025 & 2033
- Figure 21: South Korea Strontium Industry Revenue Share (%), by Product 2025 & 2033
- Figure 22: South Korea Strontium Industry Revenue (Million), by Application 2025 & 2033
- Figure 23: South Korea Strontium Industry Revenue Share (%), by Application 2025 & 2033
- Figure 24: South Korea Strontium Industry Revenue (Million), by Country 2025 & 2033
- Figure 25: South Korea Strontium Industry Revenue Share (%), by Country 2025 & 2033
- Figure 26: Thailand Strontium Industry Revenue (Million), by Product 2025 & 2033
- Figure 27: Thailand Strontium Industry Revenue Share (%), by Product 2025 & 2033
- Figure 28: Thailand Strontium Industry Revenue (Million), by Application 2025 & 2033
- Figure 29: Thailand Strontium Industry Revenue Share (%), by Application 2025 & 2033
- Figure 30: Thailand Strontium Industry Revenue (Million), by Country 2025 & 2033
- Figure 31: Thailand Strontium Industry Revenue Share (%), by Country 2025 & 2033
- Figure 32: Malaysia Strontium Industry Revenue (Million), by Product 2025 & 2033
- Figure 33: Malaysia Strontium Industry Revenue Share (%), by Product 2025 & 2033
- Figure 34: Malaysia Strontium Industry Revenue (Million), by Application 2025 & 2033
- Figure 35: Malaysia Strontium Industry Revenue Share (%), by Application 2025 & 2033
- Figure 36: Malaysia Strontium Industry Revenue (Million), by Country 2025 & 2033
- Figure 37: Malaysia Strontium Industry Revenue Share (%), by Country 2025 & 2033
- Figure 38: Indonesia Strontium Industry Revenue (Million), by Product 2025 & 2033
- Figure 39: Indonesia Strontium Industry Revenue Share (%), by Product 2025 & 2033
- Figure 40: Indonesia Strontium Industry Revenue (Million), by Application 2025 & 2033
- Figure 41: Indonesia Strontium Industry Revenue Share (%), by Application 2025 & 2033
- Figure 42: Indonesia Strontium Industry Revenue (Million), by Country 2025 & 2033
- Figure 43: Indonesia Strontium Industry Revenue Share (%), by Country 2025 & 2033
- Figure 44: Vietnam Strontium Industry Revenue (Million), by Product 2025 & 2033
- Figure 45: Vietnam Strontium Industry Revenue Share (%), by Product 2025 & 2033
- Figure 46: Vietnam Strontium Industry Revenue (Million), by Application 2025 & 2033
- Figure 47: Vietnam Strontium Industry Revenue Share (%), by Application 2025 & 2033
- Figure 48: Vietnam Strontium Industry Revenue (Million), by Country 2025 & 2033
- Figure 49: Vietnam Strontium Industry Revenue Share (%), by Country 2025 & 2033
- Figure 50: Rest of Asia Pacific Strontium Industry Revenue (Million), by Product 2025 & 2033
- Figure 51: Rest of Asia Pacific Strontium Industry Revenue Share (%), by Product 2025 & 2033
- Figure 52: Rest of Asia Pacific Strontium Industry Revenue (Million), by Application 2025 & 2033
- Figure 53: Rest of Asia Pacific Strontium Industry Revenue Share (%), by Application 2025 & 2033
- Figure 54: Rest of Asia Pacific Strontium Industry Revenue (Million), by Country 2025 & 2033
- Figure 55: Rest of Asia Pacific Strontium Industry Revenue Share (%), by Country 2025 & 2033
- Figure 56: United States Strontium Industry Revenue (Million), by Product 2025 & 2033
- Figure 57: United States Strontium Industry Revenue Share (%), by Product 2025 & 2033
- Figure 58: United States Strontium Industry Revenue (Million), by Application 2025 & 2033
- Figure 59: United States Strontium Industry Revenue Share (%), by Application 2025 & 2033
- Figure 60: United States Strontium Industry Revenue (Million), by Country 2025 & 2033
- Figure 61: United States Strontium Industry Revenue Share (%), by Country 2025 & 2033
- Figure 62: Canada Strontium Industry Revenue (Million), by Product 2025 & 2033
- Figure 63: Canada Strontium Industry Revenue Share (%), by Product 2025 & 2033
- Figure 64: Canada Strontium Industry Revenue (Million), by Application 2025 & 2033
- Figure 65: Canada Strontium Industry Revenue Share (%), by Application 2025 & 2033
- Figure 66: Canada Strontium Industry Revenue (Million), by Country 2025 & 2033
- Figure 67: Canada Strontium Industry Revenue Share (%), by Country 2025 & 2033
- Figure 68: Mexico Strontium Industry Revenue (Million), by Product 2025 & 2033
- Figure 69: Mexico Strontium Industry Revenue Share (%), by Product 2025 & 2033
- Figure 70: Mexico Strontium Industry Revenue (Million), by Application 2025 & 2033
- Figure 71: Mexico Strontium Industry Revenue Share (%), by Application 2025 & 2033
- Figure 72: Mexico Strontium Industry Revenue (Million), by Country 2025 & 2033
- Figure 73: Mexico Strontium Industry Revenue Share (%), by Country 2025 & 2033
- Figure 74: Germany Strontium Industry Revenue (Million), by Product 2025 & 2033
- Figure 75: Germany Strontium Industry Revenue Share (%), by Product 2025 & 2033
- Figure 76: Germany Strontium Industry Revenue (Million), by Application 2025 & 2033
- Figure 77: Germany Strontium Industry Revenue Share (%), by Application 2025 & 2033
- Figure 78: Germany Strontium Industry Revenue (Million), by Country 2025 & 2033
- Figure 79: Germany Strontium Industry Revenue Share (%), by Country 2025 & 2033
- Figure 80: United Kingdom Strontium Industry Revenue (Million), by Product 2025 & 2033
- Figure 81: United Kingdom Strontium Industry Revenue Share (%), by Product 2025 & 2033
- Figure 82: United Kingdom Strontium Industry Revenue (Million), by Application 2025 & 2033
- Figure 83: United Kingdom Strontium Industry Revenue Share (%), by Application 2025 & 2033
- Figure 84: United Kingdom Strontium Industry Revenue (Million), by Country 2025 & 2033
- Figure 85: United Kingdom Strontium Industry Revenue Share (%), by Country 2025 & 2033
- Figure 86: Italy Strontium Industry Revenue (Million), by Product 2025 & 2033
- Figure 87: Italy Strontium Industry Revenue Share (%), by Product 2025 & 2033
- Figure 88: Italy Strontium Industry Revenue (Million), by Application 2025 & 2033
- Figure 89: Italy Strontium Industry Revenue Share (%), by Application 2025 & 2033
- Figure 90: Italy Strontium Industry Revenue (Million), by Country 2025 & 2033
- Figure 91: Italy Strontium Industry Revenue Share (%), by Country 2025 & 2033
- Figure 92: France Strontium Industry Revenue (Million), by Product 2025 & 2033
- Figure 93: France Strontium Industry Revenue Share (%), by Product 2025 & 2033
- Figure 94: France Strontium Industry Revenue (Million), by Application 2025 & 2033
- Figure 95: France Strontium Industry Revenue Share (%), by Application 2025 & 2033
- Figure 96: France Strontium Industry Revenue (Million), by Country 2025 & 2033
- Figure 97: France Strontium Industry Revenue Share (%), by Country 2025 & 2033
- Figure 98: Spain Strontium Industry Revenue (Million), by Product 2025 & 2033
- Figure 99: Spain Strontium Industry Revenue Share (%), by Product 2025 & 2033
- Figure 100: Spain Strontium Industry Revenue (Million), by Application 2025 & 2033
- Figure 101: Spain Strontium Industry Revenue Share (%), by Application 2025 & 2033
- Figure 102: Spain Strontium Industry Revenue (Million), by Country 2025 & 2033
- Figure 103: Spain Strontium Industry Revenue Share (%), by Country 2025 & 2033
- Figure 104: Turkey Strontium Industry Revenue (Million), by Product 2025 & 2033
- Figure 105: Turkey Strontium Industry Revenue Share (%), by Product 2025 & 2033
- Figure 106: Turkey Strontium Industry Revenue (Million), by Application 2025 & 2033
- Figure 107: Turkey Strontium Industry Revenue Share (%), by Application 2025 & 2033
- Figure 108: Turkey Strontium Industry Revenue (Million), by Country 2025 & 2033
- Figure 109: Turkey Strontium Industry Revenue Share (%), by Country 2025 & 2033
- Figure 110: Russia Strontium Industry Revenue (Million), by Product 2025 & 2033
- Figure 111: Russia Strontium Industry Revenue Share (%), by Product 2025 & 2033
- Figure 112: Russia Strontium Industry Revenue (Million), by Application 2025 & 2033
- Figure 113: Russia Strontium Industry Revenue Share (%), by Application 2025 & 2033
- Figure 114: Russia Strontium Industry Revenue (Million), by Country 2025 & 2033
- Figure 115: Russia Strontium Industry Revenue Share (%), by Country 2025 & 2033
- Figure 116: NORDIC Strontium Industry Revenue (Million), by Product 2025 & 2033
- Figure 117: NORDIC Strontium Industry Revenue Share (%), by Product 2025 & 2033
- Figure 118: NORDIC Strontium Industry Revenue (Million), by Application 2025 & 2033
- Figure 119: NORDIC Strontium Industry Revenue Share (%), by Application 2025 & 2033
- Figure 120: NORDIC Strontium Industry Revenue (Million), by Country 2025 & 2033
- Figure 121: NORDIC Strontium Industry Revenue Share (%), by Country 2025 & 2033
- Figure 122: Rest of Europe Strontium Industry Revenue (Million), by Product 2025 & 2033
- Figure 123: Rest of Europe Strontium Industry Revenue Share (%), by Product 2025 & 2033
- Figure 124: Rest of Europe Strontium Industry Revenue (Million), by Application 2025 & 2033
- Figure 125: Rest of Europe Strontium Industry Revenue Share (%), by Application 2025 & 2033
- Figure 126: Rest of Europe Strontium Industry Revenue (Million), by Country 2025 & 2033
- Figure 127: Rest of Europe Strontium Industry Revenue Share (%), by Country 2025 & 2033
- Figure 128: Brazil Strontium Industry Revenue (Million), by Product 2025 & 2033
- Figure 129: Brazil Strontium Industry Revenue Share (%), by Product 2025 & 2033
- Figure 130: Brazil Strontium Industry Revenue (Million), by Application 2025 & 2033
- Figure 131: Brazil Strontium Industry Revenue Share (%), by Application 2025 & 2033
- Figure 132: Brazil Strontium Industry Revenue (Million), by Country 2025 & 2033
- Figure 133: Brazil Strontium Industry Revenue Share (%), by Country 2025 & 2033
- Figure 134: Argentina Strontium Industry Revenue (Million), by Product 2025 & 2033
- Figure 135: Argentina Strontium Industry Revenue Share (%), by Product 2025 & 2033
- Figure 136: Argentina Strontium Industry Revenue (Million), by Application 2025 & 2033
- Figure 137: Argentina Strontium Industry Revenue Share (%), by Application 2025 & 2033
- Figure 138: Argentina Strontium Industry Revenue (Million), by Country 2025 & 2033
- Figure 139: Argentina Strontium Industry Revenue Share (%), by Country 2025 & 2033
- Figure 140: Colombia Strontium Industry Revenue (Million), by Product 2025 & 2033
- Figure 141: Colombia Strontium Industry Revenue Share (%), by Product 2025 & 2033
- Figure 142: Colombia Strontium Industry Revenue (Million), by Application 2025 & 2033
- Figure 143: Colombia Strontium Industry Revenue Share (%), by Application 2025 & 2033
- Figure 144: Colombia Strontium Industry Revenue (Million), by Country 2025 & 2033
- Figure 145: Colombia Strontium Industry Revenue Share (%), by Country 2025 & 2033
- Figure 146: Rest of South America Strontium Industry Revenue (Million), by Product 2025 & 2033
- Figure 147: Rest of South America Strontium Industry Revenue Share (%), by Product 2025 & 2033
- Figure 148: Rest of South America Strontium Industry Revenue (Million), by Application 2025 & 2033
- Figure 149: Rest of South America Strontium Industry Revenue Share (%), by Application 2025 & 2033
- Figure 150: Rest of South America Strontium Industry Revenue (Million), by Country 2025 & 2033
- Figure 151: Rest of South America Strontium Industry Revenue Share (%), by Country 2025 & 2033
- Figure 152: Saudi Arabia Strontium Industry Revenue (Million), by Product 2025 & 2033
- Figure 153: Saudi Arabia Strontium Industry Revenue Share (%), by Product 2025 & 2033
- Figure 154: Saudi Arabia Strontium Industry Revenue (Million), by Application 2025 & 2033
- Figure 155: Saudi Arabia Strontium Industry Revenue Share (%), by Application 2025 & 2033
- Figure 156: Saudi Arabia Strontium Industry Revenue (Million), by Country 2025 & 2033
- Figure 157: Saudi Arabia Strontium Industry Revenue Share (%), by Country 2025 & 2033
- Figure 158: South Africa Strontium Industry Revenue (Million), by Product 2025 & 2033
- Figure 159: South Africa Strontium Industry Revenue Share (%), by Product 2025 & 2033
- Figure 160: South Africa Strontium Industry Revenue (Million), by Application 2025 & 2033
- Figure 161: South Africa Strontium Industry Revenue Share (%), by Application 2025 & 2033
- Figure 162: South Africa Strontium Industry Revenue (Million), by Country 2025 & 2033
- Figure 163: South Africa Strontium Industry Revenue Share (%), by Country 2025 & 2033
- Figure 164: Nigeria Strontium Industry Revenue (Million), by Product 2025 & 2033
- Figure 165: Nigeria Strontium Industry Revenue Share (%), by Product 2025 & 2033
- Figure 166: Nigeria Strontium Industry Revenue (Million), by Application 2025 & 2033
- Figure 167: Nigeria Strontium Industry Revenue Share (%), by Application 2025 & 2033
- Figure 168: Nigeria Strontium Industry Revenue (Million), by Country 2025 & 2033
- Figure 169: Nigeria Strontium Industry Revenue Share (%), by Country 2025 & 2033
- Figure 170: Egypt Strontium Industry Revenue (Million), by Product 2025 & 2033
- Figure 171: Egypt Strontium Industry Revenue Share (%), by Product 2025 & 2033
- Figure 172: Egypt Strontium Industry Revenue (Million), by Application 2025 & 2033
- Figure 173: Egypt Strontium Industry Revenue Share (%), by Application 2025 & 2033
- Figure 174: Egypt Strontium Industry Revenue (Million), by Country 2025 & 2033
- Figure 175: Egypt Strontium Industry Revenue Share (%), by Country 2025 & 2033
- Figure 176: Qatar Strontium Industry Revenue (Million), by Product 2025 & 2033
- Figure 177: Qatar Strontium Industry Revenue Share (%), by Product 2025 & 2033
- Figure 178: Qatar Strontium Industry Revenue (Million), by Application 2025 & 2033
- Figure 179: Qatar Strontium Industry Revenue Share (%), by Application 2025 & 2033
- Figure 180: Qatar Strontium Industry Revenue (Million), by Country 2025 & 2033
- Figure 181: Qatar Strontium Industry Revenue Share (%), by Country 2025 & 2033
- Figure 182: United Arab Emirates Strontium Industry Revenue (Million), by Product 2025 & 2033
- Figure 183: United Arab Emirates Strontium Industry Revenue Share (%), by Product 2025 & 2033
- Figure 184: United Arab Emirates Strontium Industry Revenue (Million), by Application 2025 & 2033
- Figure 185: United Arab Emirates Strontium Industry Revenue Share (%), by Application 2025 & 2033
- Figure 186: United Arab Emirates Strontium Industry Revenue (Million), by Country 2025 & 2033
- Figure 187: United Arab Emirates Strontium Industry Revenue Share (%), by Country 2025 & 2033
- Figure 188: Rest of Middle East and Africa Strontium Industry Revenue (Million), by Product 2025 & 2033
- Figure 189: Rest of Middle East and Africa Strontium Industry Revenue Share (%), by Product 2025 & 2033
- Figure 190: Rest of Middle East and Africa Strontium Industry Revenue (Million), by Application 2025 & 2033
- Figure 191: Rest of Middle East and Africa Strontium Industry Revenue Share (%), by Application 2025 & 2033
- Figure 192: Rest of Middle East and Africa Strontium Industry Revenue (Million), by Country 2025 & 2033
- Figure 193: Rest of Middle East and Africa Strontium Industry Revenue Share (%), by Country 2025 & 2033
List of Tables
- Table 1: Global Strontium Industry Revenue Million Forecast, by Product 2020 & 2033
- Table 2: Global Strontium Industry Revenue Million Forecast, by Application 2020 & 2033
- Table 3: Global Strontium Industry Revenue Million Forecast, by Region 2020 & 2033
- Table 4: Global Strontium Industry Revenue Million Forecast, by Product 2020 & 2033
- Table 5: Global Strontium Industry Revenue Million Forecast, by Application 2020 & 2033
- Table 6: Global Strontium Industry Revenue Million Forecast, by Country 2020 & 2033
- Table 7: Global Strontium Industry Revenue Million Forecast, by Product 2020 & 2033
- Table 8: Global Strontium Industry Revenue Million Forecast, by Application 2020 & 2033
- Table 9: Global Strontium Industry Revenue Million Forecast, by Country 2020 & 2033
- Table 10: Global Strontium Industry Revenue Million Forecast, by Product 2020 & 2033
- Table 11: Global Strontium Industry Revenue Million Forecast, by Application 2020 & 2033
- Table 12: Global Strontium Industry Revenue Million Forecast, by Country 2020 & 2033
- Table 13: Global Strontium Industry Revenue Million Forecast, by Product 2020 & 2033
- Table 14: Global Strontium Industry Revenue Million Forecast, by Application 2020 & 2033
- Table 15: Global Strontium Industry Revenue Million Forecast, by Country 2020 & 2033
- Table 16: Global Strontium Industry Revenue Million Forecast, by Product 2020 & 2033
- Table 17: Global Strontium Industry Revenue Million Forecast, by Application 2020 & 2033
- Table 18: Global Strontium Industry Revenue Million Forecast, by Country 2020 & 2033
- Table 19: Global Strontium Industry Revenue Million Forecast, by Product 2020 & 2033
- Table 20: Global Strontium Industry Revenue Million Forecast, by Application 2020 & 2033
- Table 21: Global Strontium Industry Revenue Million Forecast, by Country 2020 & 2033
- Table 22: Global Strontium Industry Revenue Million Forecast, by Product 2020 & 2033
- Table 23: Global Strontium Industry Revenue Million Forecast, by Application 2020 & 2033
- Table 24: Global Strontium Industry Revenue Million Forecast, by Country 2020 & 2033
- Table 25: Global Strontium Industry Revenue Million Forecast, by Product 2020 & 2033
- Table 26: Global Strontium Industry Revenue Million Forecast, by Application 2020 & 2033
- Table 27: Global Strontium Industry Revenue Million Forecast, by Country 2020 & 2033
- Table 28: Global Strontium Industry Revenue Million Forecast, by Product 2020 & 2033
- Table 29: Global Strontium Industry Revenue Million Forecast, by Application 2020 & 2033
- Table 30: Global Strontium Industry Revenue Million Forecast, by Country 2020 & 2033
- Table 31: North America Strontium Industry Revenue (Million) Forecast, by Application 2020 & 2033
- Table 32: Global Strontium Industry Revenue Million Forecast, by Product 2020 & 2033
- Table 33: Global Strontium Industry Revenue Million Forecast, by Application 2020 & 2033
- Table 34: Global Strontium Industry Revenue Million Forecast, by Country 2020 & 2033
- Table 35: Global Strontium Industry Revenue Million Forecast, by Product 2020 & 2033
- Table 36: Global Strontium Industry Revenue Million Forecast, by Application 2020 & 2033
- Table 37: Global Strontium Industry Revenue Million Forecast, by Country 2020 & 2033
- Table 38: Global Strontium Industry Revenue Million Forecast, by Product 2020 & 2033
- Table 39: Global Strontium Industry Revenue Million Forecast, by Application 2020 & 2033
- Table 40: Global Strontium Industry Revenue Million Forecast, by Country 2020 & 2033
- Table 41: Europe Strontium Industry Revenue (Million) Forecast, by Application 2020 & 2033
- Table 42: Global Strontium Industry Revenue Million Forecast, by Product 2020 & 2033
- Table 43: Global Strontium Industry Revenue Million Forecast, by Application 2020 & 2033
- Table 44: Global Strontium Industry Revenue Million Forecast, by Country 2020 & 2033
- Table 45: Global Strontium Industry Revenue Million Forecast, by Product 2020 & 2033
- Table 46: Global Strontium Industry Revenue Million Forecast, by Application 2020 & 2033
- Table 47: Global Strontium Industry Revenue Million Forecast, by Country 2020 & 2033
- Table 48: Global Strontium Industry Revenue Million Forecast, by Product 2020 & 2033
- Table 49: Global Strontium Industry Revenue Million Forecast, by Application 2020 & 2033
- Table 50: Global Strontium Industry Revenue Million Forecast, by Country 2020 & 2033
- Table 51: Global Strontium Industry Revenue Million Forecast, by Product 2020 & 2033
- Table 52: Global Strontium Industry Revenue Million Forecast, by Application 2020 & 2033
- Table 53: Global Strontium Industry Revenue Million Forecast, by Country 2020 & 2033
- Table 54: Global Strontium Industry Revenue Million Forecast, by Product 2020 & 2033
- Table 55: Global Strontium Industry Revenue Million Forecast, by Application 2020 & 2033
- Table 56: Global Strontium Industry Revenue Million Forecast, by Country 2020 & 2033
- Table 57: Global Strontium Industry Revenue Million Forecast, by Product 2020 & 2033
- Table 58: Global Strontium Industry Revenue Million Forecast, by Application 2020 & 2033
- Table 59: Global Strontium Industry Revenue Million Forecast, by Country 2020 & 2033
- Table 60: Global Strontium Industry Revenue Million Forecast, by Product 2020 & 2033
- Table 61: Global Strontium Industry Revenue Million Forecast, by Application 2020 & 2033
- Table 62: Global Strontium Industry Revenue Million Forecast, by Country 2020 & 2033
- Table 63: Global Strontium Industry Revenue Million Forecast, by Product 2020 & 2033
- Table 64: Global Strontium Industry Revenue Million Forecast, by Application 2020 & 2033
- Table 65: Global Strontium Industry Revenue Million Forecast, by Country 2020 & 2033
- Table 66: Global Strontium Industry Revenue Million Forecast, by Product 2020 & 2033
- Table 67: Global Strontium Industry Revenue Million Forecast, by Application 2020 & 2033
- Table 68: Global Strontium Industry Revenue Million Forecast, by Country 2020 & 2033
- Table 69: South America Strontium Industry Revenue (Million) Forecast, by Application 2020 & 2033
- Table 70: Global Strontium Industry Revenue Million Forecast, by Product 2020 & 2033
- Table 71: Global Strontium Industry Revenue Million Forecast, by Application 2020 & 2033
- Table 72: Global Strontium Industry Revenue Million Forecast, by Country 2020 & 2033
- Table 73: Global Strontium Industry Revenue Million Forecast, by Product 2020 & 2033
- Table 74: Global Strontium Industry Revenue Million Forecast, by Application 2020 & 2033
- Table 75: Global Strontium Industry Revenue Million Forecast, by Country 2020 & 2033
- Table 76: Global Strontium Industry Revenue Million Forecast, by Product 2020 & 2033
- Table 77: Global Strontium Industry Revenue Million Forecast, by Application 2020 & 2033
- Table 78: Global Strontium Industry Revenue Million Forecast, by Country 2020 & 2033
- Table 79: Global Strontium Industry Revenue Million Forecast, by Product 2020 & 2033
- Table 80: Global Strontium Industry Revenue Million Forecast, by Application 2020 & 2033
- Table 81: Global Strontium Industry Revenue Million Forecast, by Country 2020 & 2033
- Table 82: Middle East and Africa Strontium Industry Revenue (Million) Forecast, by Application 2020 & 2033
- Table 83: Global Strontium Industry Revenue Million Forecast, by Product 2020 & 2033
- Table 84: Global Strontium Industry Revenue Million Forecast, by Application 2020 & 2033
- Table 85: Global Strontium Industry Revenue Million Forecast, by Country 2020 & 2033
- Table 86: Global Strontium Industry Revenue Million Forecast, by Product 2020 & 2033
- Table 87: Global Strontium Industry Revenue Million Forecast, by Application 2020 & 2033
- Table 88: Global Strontium Industry Revenue Million Forecast, by Country 2020 & 2033
- Table 89: Global Strontium Industry Revenue Million Forecast, by Product 2020 & 2033
- Table 90: Global Strontium Industry Revenue Million Forecast, by Application 2020 & 2033
- Table 91: Global Strontium Industry Revenue Million Forecast, by Country 2020 & 2033
- Table 92: Global Strontium Industry Revenue Million Forecast, by Product 2020 & 2033
- Table 93: Global Strontium Industry Revenue Million Forecast, by Application 2020 & 2033
- Table 94: Global Strontium Industry Revenue Million Forecast, by Country 2020 & 2033
- Table 95: Global Strontium Industry Revenue Million Forecast, by Product 2020 & 2033
- Table 96: Global Strontium Industry Revenue Million Forecast, by Application 2020 & 2033
- Table 97: Global Strontium Industry Revenue Million Forecast, by Country 2020 & 2033
- Table 98: Global Strontium Industry Revenue Million Forecast, by Product 2020 & 2033
- Table 99: Global Strontium Industry Revenue Million Forecast, by Application 2020 & 2033
- Table 100: Global Strontium Industry Revenue Million Forecast, by Country 2020 & 2033
- Table 101: Global Strontium Industry Revenue Million Forecast, by Product 2020 & 2033
- Table 102: Global Strontium Industry Revenue Million Forecast, by Application 2020 & 2033
- Table 103: Global Strontium Industry Revenue Million Forecast, by Country 2020 & 2033
Frequently Asked Questions
1. What is the projected Compound Annual Growth Rate (CAGR) of the Strontium Industry?
The projected CAGR is approximately > 3.00%.
2. Which companies are prominent players in the Strontium Industry?
Key companies in the market include Solvay*List Not Exhaustive, KBM Affilips, Shenzhou Jiaxin Chemical Co Ltd, Fertiberia, Abassco, Shijiazhuang Zhengding JINSHI Chemical Co Ltd, Nanjing Jinyan Strontium Industry Co Ltd, Joyieng Chemical Limited, SAKAI CHEMICAL INDUSTRY CO LTD, Hebei Xinji Chemical Group Co Ltd, ProChem Inc, Barium & Chemicals Inc, Noah Chemicals, Chongqing Yuanhe Fine Chemicals Inc.
3. What are the main segments of the Strontium Industry?
The market segments include Product, Application.
4. Can you provide details about the market size?
The market size is estimated to be USD 100 Million as of 2022.
5. What are some drivers contributing to market growth?
Increased Demand from the Paints and Coatings Segment; Increasing Construction Activities in Emerging Economies of Asia-Pacific.
6. What are the notable trends driving market growth?
Paints and Coatings Segment to Dominate the Market.
7. Are there any restraints impacting market growth?
Risk of Explosion and Fire Hazards Associated with Strontium; Other Restraints.
8. Can you provide examples of recent developments in the market?
October 2023: ProChem joined the Society of Chemical Manufacturers & Affiliates (SOCMA). SOCMA is the only US-based trade association that is completely dedicated to the specialty and fine chemicals industry. SOCMA provides a legislative and regulatory advocate, promotes the highest level of safety, and strengthens business intelligence and production operations to support and stimulate growth in the specialty chemicals sector.
9. What pricing options are available for accessing the report?
Pricing options include single-user, multi-user, and enterprise licenses priced at USD 4750, USD 5250, and USD 8750 respectively.
10. Is the market size provided in terms of value or volume?
The market size is provided in terms of value, measured in Million.
11. Are there any specific market keywords associated with the report?
Yes, the market keyword associated with the report is "Strontium Industry," which aids in identifying and referencing the specific market segment covered.
12. How do I determine which pricing option suits my needs best?
The pricing options vary based on user requirements and access needs. Individual users may opt for single-user licenses, while businesses requiring broader access may choose multi-user or enterprise licenses for cost-effective access to the report.
13. Are there any additional resources or data provided in the Strontium Industry report?
While the report offers comprehensive insights, it's advisable to review the specific contents or supplementary materials provided to ascertain if additional resources or data are available.
14. How can I stay updated on further developments or reports in the Strontium Industry?
To stay informed about further developments, trends, and reports in the Strontium Industry, consider subscribing to industry newsletters, following relevant companies and organizations, or regularly checking reputable industry news sources and publications.
Methodology
Step 1 - Identification of Relevant Samples Size from Population Database


Step 2 - Approaches for Defining Global Market Size (Value, Volume* & Price*)

Note*: In applicable scenarios
Step 3 - Data Sources
Primary Research
- Web Analytics
- Survey Reports
- Research Institute
- Latest Research Reports
- Opinion Leaders
Secondary Research
- Annual Reports
- White Paper
- Latest Press Release
- Industry Association
- Paid Database
- Investor Presentations

Step 4 - Data Triangulation
Involves using different sources of information in order to increase the validity of a study
These sources are likely to be stakeholders in a program - participants, other researchers, program staff, other community members, and so on.
Then we put all data in single framework & apply various statistical tools to find out the dynamic on the market.
During the analysis stage, feedback from the stakeholder groups would be compared to determine areas of agreement as well as areas of divergence