
Key Insights
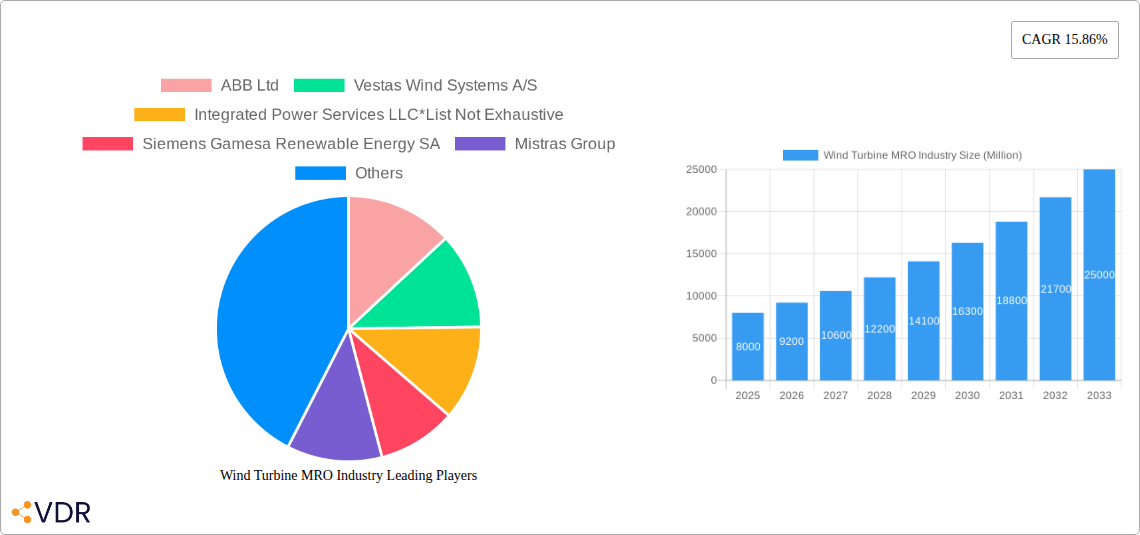
The global wind turbine maintenance, repair, and overhaul (MRO) market is experiencing robust growth, driven by the increasing age of existing wind turbine installations and the rising global demand for renewable energy. The market's compound annual growth rate (CAGR) of 15.86% from 2019 to 2024 indicates a significant expansion, projected to continue through 2033. This growth is fueled by several key factors: the increasing need for preventative maintenance to maximize turbine lifespan and energy output, the complexity of modern wind turbine technology requiring specialized MRO services, and the growing focus on optimizing operational efficiency and reducing downtime. The market is segmented by service type (maintenance, repair, overhaul), component (gearbox, generators, rotor blades, other components), and location of deployment (onshore, offshore). Offshore wind farms present unique challenges and opportunities, driving demand for specialized MRO services and contributing to the overall market expansion. Major players like ABB, Vestas, Siemens Gamesa, and GE are actively involved, vying for market share through technological advancements, strategic partnerships, and service expansion. The geographical distribution of the market is diverse, with North America, Europe, and Asia Pacific representing significant regions of activity. As the global energy transition accelerates and wind energy capacity continues its upward trajectory, the wind turbine MRO market is poised for sustained and substantial growth, presenting attractive investment opportunities for both established players and new entrants.
The competitive landscape is marked by both established players with extensive experience in servicing large wind turbine fleets and smaller, specialized companies focusing on niche areas like blade repair or specific turbine models. This competition fosters innovation and drives down costs, benefiting wind farm owners and operators. However, challenges remain, including the need for skilled technicians and the logistical complexities of servicing offshore wind farms. Furthermore, fluctuating commodity prices for raw materials and the potential for regulatory changes can impact market dynamics. Despite these challenges, the long-term outlook for the wind turbine MRO market remains positive, fueled by the global commitment to renewable energy and the growing operational needs of the expanding wind energy sector. The market’s geographical spread shows growth across all regions, although North America and Europe are currently leading in market share due to earlier adoption of wind energy technology and a larger installed base of wind turbines.
Wind Turbine MRO Industry Market Report: 2019-2033
This comprehensive report provides a detailed analysis of the Wind Turbine Maintenance, Repair, and Overhaul (MRO) market, covering the period from 2019 to 2033. We delve into market dynamics, growth trends, regional performance, key players, and future opportunities within this rapidly expanding sector of the renewable energy industry. The report utilizes a robust methodology, combining extensive primary and secondary research to deliver actionable insights for industry professionals, investors, and strategic decision-makers. The market is segmented by service type (Maintenance, Repair, Overhaul), component (Gearbox, Generators, Rotor Blades, Other Components), and location of deployment (Onshore, Offshore). The total market size is projected to reach xx Million by 2033.
Wind Turbine MRO Industry Market Dynamics & Structure
The global Wind Turbine MRO market is characterized by a moderately concentrated landscape, with a few large players holding significant market share. However, the market also accommodates numerous specialized service providers catering to specific needs. Technological innovation, driven by the demand for enhanced efficiency and reduced downtime, is a key driver of growth. Stringent regulatory frameworks, particularly regarding safety and environmental compliance, shape industry practices. The market faces competition from substitute technologies, though the continued growth of the wind energy sector mitigates this threat.
- Market Concentration: The top 5 players hold approximately 40% of the market share in 2025.
- Technological Innovation: Focus on predictive maintenance, digitalization, and advanced materials.
- Regulatory Landscape: Stringent safety standards and environmental regulations impact operational costs.
- M&A Activity: A moderate level of mergers and acquisitions aimed at expanding service capabilities and geographical reach. The total deal volume for 2019-2024 was approximately xx Million.
Wind Turbine MRO Industry Growth Trends & Insights
The Wind Turbine MRO market is experiencing robust growth, fueled by the increasing global adoption of wind energy. The aging wind turbine fleet necessitates significant maintenance and repair activities, creating a substantial demand for MRO services. Technological advancements, such as predictive maintenance and remote diagnostics, are enhancing operational efficiency and reducing downtime. Further, the increasing focus on offshore wind projects is expanding the market scope. The market size, currently at xx Million in 2025, is projected to reach xx Million by 2033, with a Compound Annual Growth Rate (CAGR) of xx% during the forecast period (2025-2033). This growth is driven by factors such as increasing wind power capacity additions and government policies promoting renewable energy adoption. Market penetration, while varying by region, is expected to reach xx% by 2033.

Dominant Regions, Countries, or Segments in Wind Turbine MRO Industry
North America and Europe currently dominate the Wind Turbine MRO market, driven by established wind energy sectors and robust regulatory frameworks promoting renewable energy adoption. Within these regions, offshore wind projects are particularly significant drivers of growth due to their larger scale and more complex maintenance requirements. The onshore segment remains the larger market share holder for the period but offshore is seeing the strongest growth. The gearbox component segment represents a significant portion of the MRO market due to its complexity and vulnerability to failure.
- Key Drivers: Government incentives for renewable energy, robust wind energy infrastructure, and increasing offshore wind deployment.
- Dominance Factors: Existing wind energy capacity, favorable regulatory landscape, technological expertise.
- Growth Potential: Expansion of offshore wind farms, increasing demand for specialized MRO services, and technological advancements will further drive growth.
Wind Turbine MRO Industry Product Landscape
The Wind Turbine MRO product landscape features a wide range of services, from routine maintenance to complex repairs and overhauls. Innovation centers on predictive maintenance technologies, leveraging data analytics and IoT sensors to optimize maintenance schedules and minimize downtime. Advanced repair techniques, utilizing composite materials and specialized tooling, extend component lifecycles. Key performance indicators (KPIs) include Mean Time Between Failures (MTBF), Mean Time To Repair (MTTR), and overall equipment effectiveness (OEE), all crucial for optimizing wind farm operations.
Key Drivers, Barriers & Challenges in Wind Turbine MRO Industry
Key Drivers:
- The expanding global wind energy capacity necessitates increased MRO services.
- Technological advancements lead to higher efficiency and reduced maintenance costs.
- Favorable government policies and subsidies support renewable energy development.
Challenges and Restraints:
- The remote location of many wind farms increases logistical complexity and costs.
- The specialized nature of wind turbine components necessitates highly skilled technicians. A shortage of qualified personnel poses a significant challenge. This shortage is estimated to impact xx% of the market by 2030.
- Intense competition among MRO providers leads to price pressures.
Emerging Opportunities in Wind Turbine MRO Industry
- The growth of offshore wind necessitates development of specialized MRO solutions for challenging marine environments.
- Advanced data analytics and artificial intelligence (AI) offer opportunities to optimize maintenance schedules and reduce costs.
- The development of more sustainable and environmentally friendly MRO practices will become increasingly important.
Growth Accelerators in the Wind Turbine MRO Industry
Technological breakthroughs in predictive maintenance, remote diagnostics, and advanced materials are key growth accelerators. Strategic partnerships between turbine manufacturers, MRO providers, and technology companies are streamlining service delivery and enhancing efficiency. The expansion of wind energy into new markets and the growth of offshore wind further accelerate market growth.
Key Players Shaping the Wind Turbine MRO Industry Market
- ABB Ltd
- Vestas Wind Systems A/S
- Integrated Power Services LLC
- Siemens Gamesa Renewable Energy SA
- Mistras Group
- Moventas Gears Oy
- Suzlon Energy Ltd
- Dana SAC UK Ltd
- General Electric Company
- Nordex SE
- Stork (a Fluor Company)
- ZF Friedrichshafen AG
Notable Milestones in Wind Turbine MRO Industry Sector
- February 2021: Siemens Gamesa Renewable Energy extends its O&M agreement for the Gemini offshore wind farm until 2036.
- May 2021: GE Renewable Energy secures a 15-year O&M contract for an 88 MW wind farm in Vietnam.
In-Depth Wind Turbine MRO Industry Market Outlook
The Wind Turbine MRO market is poised for continued strong growth driven by the expansion of the global wind energy sector and technological advancements leading to improved efficiency and cost reductions. Strategic partnerships and innovation in areas like predictive maintenance and digitalization will shape the market landscape. The focus on offshore wind represents a major opportunity for specialized MRO providers. The market will likely see further consolidation as larger companies acquire smaller players to expand their service offerings and geographic reach.
Wind Turbine MRO Industry Segmentation
-
1. Location of Deployment
- 1.1. Onshore
- 1.2. Offshore
-
2. Service Type
- 2.1. Maintenance
- 2.2. Repair
- 2.3. Overhaul
-
3. Component
- 3.1. Gearbox
- 3.2. Generators
- 3.3. Rotor Blades
- 3.4. Other Components
Wind Turbine MRO Industry Segmentation By Geography
- 1. North America
- 2. Europe
- 3. Asia Pacific
- 4. South America
- 5. Middle East and Africa

Wind Turbine MRO Industry REPORT HIGHLIGHTS
| Aspects | Details |
|---|---|
| Study Period | 2019-2033 |
| Base Year | 2024 |
| Estimated Year | 2025 |
| Forecast Period | 2025-2033 |
| Historical Period | 2019-2024 |
| Growth Rate | CAGR of 15.86% from 2019-2033 |
| Segmentation |
|
Table of Contents
- 1. Introduction
- 1.1. Research Scope
- 1.2. Market Segmentation
- 1.3. Research Methodology
- 1.4. Definitions and Assumptions
- 2. Executive Summary
- 2.1. Introduction
- 3. Market Dynamics
- 3.1. Introduction
- 3.2. Market Drivers
- 3.2.1. 4.; Growing Environmental Concerns4.; Supportive Government Policies
- 3.3. Market Restrains
- 3.3.1. 4.; High Initial Capital Investment
- 3.4. Market Trends
- 3.4.1. Offshore Wind Installations Expected to Witness Signifcant Growth
- 4. Market Factor Analysis
- 4.1. Porters Five Forces
- 4.2. Supply/Value Chain
- 4.3. PESTEL analysis
- 4.4. Market Entropy
- 4.5. Patent/Trademark Analysis
- 5. Global Wind Turbine MRO Industry Analysis, Insights and Forecast, 2019-2031
- 5.1. Market Analysis, Insights and Forecast - by Location of Deployment
- 5.1.1. Onshore
- 5.1.2. Offshore
- 5.2. Market Analysis, Insights and Forecast - by Service Type
- 5.2.1. Maintenance
- 5.2.2. Repair
- 5.2.3. Overhaul
- 5.3. Market Analysis, Insights and Forecast - by Component
- 5.3.1. Gearbox
- 5.3.2. Generators
- 5.3.3. Rotor Blades
- 5.3.4. Other Components
- 5.4. Market Analysis, Insights and Forecast - by Region
- 5.4.1. North America
- 5.4.2. Europe
- 5.4.3. Asia Pacific
- 5.4.4. South America
- 5.4.5. Middle East and Africa
- 5.1. Market Analysis, Insights and Forecast - by Location of Deployment
- 6. North America Wind Turbine MRO Industry Analysis, Insights and Forecast, 2019-2031
- 6.1. Market Analysis, Insights and Forecast - by Location of Deployment
- 6.1.1. Onshore
- 6.1.2. Offshore
- 6.2. Market Analysis, Insights and Forecast - by Service Type
- 6.2.1. Maintenance
- 6.2.2. Repair
- 6.2.3. Overhaul
- 6.3. Market Analysis, Insights and Forecast - by Component
- 6.3.1. Gearbox
- 6.3.2. Generators
- 6.3.3. Rotor Blades
- 6.3.4. Other Components
- 6.1. Market Analysis, Insights and Forecast - by Location of Deployment
- 7. Europe Wind Turbine MRO Industry Analysis, Insights and Forecast, 2019-2031
- 7.1. Market Analysis, Insights and Forecast - by Location of Deployment
- 7.1.1. Onshore
- 7.1.2. Offshore
- 7.2. Market Analysis, Insights and Forecast - by Service Type
- 7.2.1. Maintenance
- 7.2.2. Repair
- 7.2.3. Overhaul
- 7.3. Market Analysis, Insights and Forecast - by Component
- 7.3.1. Gearbox
- 7.3.2. Generators
- 7.3.3. Rotor Blades
- 7.3.4. Other Components
- 7.1. Market Analysis, Insights and Forecast - by Location of Deployment
- 8. Asia Pacific Wind Turbine MRO Industry Analysis, Insights and Forecast, 2019-2031
- 8.1. Market Analysis, Insights and Forecast - by Location of Deployment
- 8.1.1. Onshore
- 8.1.2. Offshore
- 8.2. Market Analysis, Insights and Forecast - by Service Type
- 8.2.1. Maintenance
- 8.2.2. Repair
- 8.2.3. Overhaul
- 8.3. Market Analysis, Insights and Forecast - by Component
- 8.3.1. Gearbox
- 8.3.2. Generators
- 8.3.3. Rotor Blades
- 8.3.4. Other Components
- 8.1. Market Analysis, Insights and Forecast - by Location of Deployment
- 9. South America Wind Turbine MRO Industry Analysis, Insights and Forecast, 2019-2031
- 9.1. Market Analysis, Insights and Forecast - by Location of Deployment
- 9.1.1. Onshore
- 9.1.2. Offshore
- 9.2. Market Analysis, Insights and Forecast - by Service Type
- 9.2.1. Maintenance
- 9.2.2. Repair
- 9.2.3. Overhaul
- 9.3. Market Analysis, Insights and Forecast - by Component
- 9.3.1. Gearbox
- 9.3.2. Generators
- 9.3.3. Rotor Blades
- 9.3.4. Other Components
- 9.1. Market Analysis, Insights and Forecast - by Location of Deployment
- 10. Middle East and Africa Wind Turbine MRO Industry Analysis, Insights and Forecast, 2019-2031
- 10.1. Market Analysis, Insights and Forecast - by Location of Deployment
- 10.1.1. Onshore
- 10.1.2. Offshore
- 10.2. Market Analysis, Insights and Forecast - by Service Type
- 10.2.1. Maintenance
- 10.2.2. Repair
- 10.2.3. Overhaul
- 10.3. Market Analysis, Insights and Forecast - by Component
- 10.3.1. Gearbox
- 10.3.2. Generators
- 10.3.3. Rotor Blades
- 10.3.4. Other Components
- 10.1. Market Analysis, Insights and Forecast - by Location of Deployment
- 11. North America Wind Turbine MRO Industry Analysis, Insights and Forecast, 2019-2031
- 11.1. Market Analysis, Insights and Forecast - By Country/Sub-region
- 11.1.1 United States
- 11.1.2 Canada
- 11.1.3 Mexico
- 12. Europe Wind Turbine MRO Industry Analysis, Insights and Forecast, 2019-2031
- 12.1. Market Analysis, Insights and Forecast - By Country/Sub-region
- 12.1.1 Germany
- 12.1.2 United Kingdom
- 12.1.3 France
- 12.1.4 Spain
- 12.1.5 Italy
- 12.1.6 Spain
- 12.1.7 Belgium
- 12.1.8 Netherland
- 12.1.9 Nordics
- 12.1.10 Rest of Europe
- 13. Asia Pacific Wind Turbine MRO Industry Analysis, Insights and Forecast, 2019-2031
- 13.1. Market Analysis, Insights and Forecast - By Country/Sub-region
- 13.1.1 China
- 13.1.2 Japan
- 13.1.3 India
- 13.1.4 South Korea
- 13.1.5 Southeast Asia
- 13.1.6 Australia
- 13.1.7 Indonesia
- 13.1.8 Phillipes
- 13.1.9 Singapore
- 13.1.10 Thailandc
- 13.1.11 Rest of Asia Pacific
- 14. South America Wind Turbine MRO Industry Analysis, Insights and Forecast, 2019-2031
- 14.1. Market Analysis, Insights and Forecast - By Country/Sub-region
- 14.1.1 Brazil
- 14.1.2 Argentina
- 14.1.3 Peru
- 14.1.4 Chile
- 14.1.5 Colombia
- 14.1.6 Ecuador
- 14.1.7 Venezuela
- 14.1.8 Rest of South America
- 15. North America Wind Turbine MRO Industry Analysis, Insights and Forecast, 2019-2031
- 15.1. Market Analysis, Insights and Forecast - By Country/Sub-region
- 15.1.1 United States
- 15.1.2 Canada
- 15.1.3 Mexico
- 16. MEA Wind Turbine MRO Industry Analysis, Insights and Forecast, 2019-2031
- 16.1. Market Analysis, Insights and Forecast - By Country/Sub-region
- 16.1.1 United Arab Emirates
- 16.1.2 Saudi Arabia
- 16.1.3 South Africa
- 16.1.4 Rest of Middle East and Africa
- 17. Competitive Analysis
- 17.1. Global Market Share Analysis 2024
- 17.2. Company Profiles
- 17.2.1 ABB Ltd
- 17.2.1.1. Overview
- 17.2.1.2. Products
- 17.2.1.3. SWOT Analysis
- 17.2.1.4. Recent Developments
- 17.2.1.5. Financials (Based on Availability)
- 17.2.2 Vestas Wind Systems A/S
- 17.2.2.1. Overview
- 17.2.2.2. Products
- 17.2.2.3. SWOT Analysis
- 17.2.2.4. Recent Developments
- 17.2.2.5. Financials (Based on Availability)
- 17.2.3 Integrated Power Services LLC*List Not Exhaustive
- 17.2.3.1. Overview
- 17.2.3.2. Products
- 17.2.3.3. SWOT Analysis
- 17.2.3.4. Recent Developments
- 17.2.3.5. Financials (Based on Availability)
- 17.2.4 Siemens Gamesa Renewable Energy SA
- 17.2.4.1. Overview
- 17.2.4.2. Products
- 17.2.4.3. SWOT Analysis
- 17.2.4.4. Recent Developments
- 17.2.4.5. Financials (Based on Availability)
- 17.2.5 Mistras Group
- 17.2.5.1. Overview
- 17.2.5.2. Products
- 17.2.5.3. SWOT Analysis
- 17.2.5.4. Recent Developments
- 17.2.5.5. Financials (Based on Availability)
- 17.2.6 Moventas Gears Oy
- 17.2.6.1. Overview
- 17.2.6.2. Products
- 17.2.6.3. SWOT Analysis
- 17.2.6.4. Recent Developments
- 17.2.6.5. Financials (Based on Availability)
- 17.2.7 Suzlon Energy Ltd
- 17.2.7.1. Overview
- 17.2.7.2. Products
- 17.2.7.3. SWOT Analysis
- 17.2.7.4. Recent Developments
- 17.2.7.5. Financials (Based on Availability)
- 17.2.8 Dana SAC UK Ltd
- 17.2.8.1. Overview
- 17.2.8.2. Products
- 17.2.8.3. SWOT Analysis
- 17.2.8.4. Recent Developments
- 17.2.8.5. Financials (Based on Availability)
- 17.2.9 General Electric Company
- 17.2.9.1. Overview
- 17.2.9.2. Products
- 17.2.9.3. SWOT Analysis
- 17.2.9.4. Recent Developments
- 17.2.9.5. Financials (Based on Availability)
- 17.2.10 Nordex SE
- 17.2.10.1. Overview
- 17.2.10.2. Products
- 17.2.10.3. SWOT Analysis
- 17.2.10.4. Recent Developments
- 17.2.10.5. Financials (Based on Availability)
- 17.2.11 Stork (a Fluor Company)
- 17.2.11.1. Overview
- 17.2.11.2. Products
- 17.2.11.3. SWOT Analysis
- 17.2.11.4. Recent Developments
- 17.2.11.5. Financials (Based on Availability)
- 17.2.12 ZF Friedrichshafen AG
- 17.2.12.1. Overview
- 17.2.12.2. Products
- 17.2.12.3. SWOT Analysis
- 17.2.12.4. Recent Developments
- 17.2.12.5. Financials (Based on Availability)
- 17.2.1 ABB Ltd
List of Figures
- Figure 1: Global Wind Turbine MRO Industry Revenue Breakdown (Million, %) by Region 2024 & 2032
- Figure 2: North America Wind Turbine MRO Industry Revenue (Million), by Country 2024 & 2032
- Figure 3: North America Wind Turbine MRO Industry Revenue Share (%), by Country 2024 & 2032
- Figure 4: Europe Wind Turbine MRO Industry Revenue (Million), by Country 2024 & 2032
- Figure 5: Europe Wind Turbine MRO Industry Revenue Share (%), by Country 2024 & 2032
- Figure 6: Asia Pacific Wind Turbine MRO Industry Revenue (Million), by Country 2024 & 2032
- Figure 7: Asia Pacific Wind Turbine MRO Industry Revenue Share (%), by Country 2024 & 2032
- Figure 8: South America Wind Turbine MRO Industry Revenue (Million), by Country 2024 & 2032
- Figure 9: South America Wind Turbine MRO Industry Revenue Share (%), by Country 2024 & 2032
- Figure 10: North America Wind Turbine MRO Industry Revenue (Million), by Country 2024 & 2032
- Figure 11: North America Wind Turbine MRO Industry Revenue Share (%), by Country 2024 & 2032
- Figure 12: MEA Wind Turbine MRO Industry Revenue (Million), by Country 2024 & 2032
- Figure 13: MEA Wind Turbine MRO Industry Revenue Share (%), by Country 2024 & 2032
- Figure 14: North America Wind Turbine MRO Industry Revenue (Million), by Location of Deployment 2024 & 2032
- Figure 15: North America Wind Turbine MRO Industry Revenue Share (%), by Location of Deployment 2024 & 2032
- Figure 16: North America Wind Turbine MRO Industry Revenue (Million), by Service Type 2024 & 2032
- Figure 17: North America Wind Turbine MRO Industry Revenue Share (%), by Service Type 2024 & 2032
- Figure 18: North America Wind Turbine MRO Industry Revenue (Million), by Component 2024 & 2032
- Figure 19: North America Wind Turbine MRO Industry Revenue Share (%), by Component 2024 & 2032
- Figure 20: North America Wind Turbine MRO Industry Revenue (Million), by Country 2024 & 2032
- Figure 21: North America Wind Turbine MRO Industry Revenue Share (%), by Country 2024 & 2032
- Figure 22: Europe Wind Turbine MRO Industry Revenue (Million), by Location of Deployment 2024 & 2032
- Figure 23: Europe Wind Turbine MRO Industry Revenue Share (%), by Location of Deployment 2024 & 2032
- Figure 24: Europe Wind Turbine MRO Industry Revenue (Million), by Service Type 2024 & 2032
- Figure 25: Europe Wind Turbine MRO Industry Revenue Share (%), by Service Type 2024 & 2032
- Figure 26: Europe Wind Turbine MRO Industry Revenue (Million), by Component 2024 & 2032
- Figure 27: Europe Wind Turbine MRO Industry Revenue Share (%), by Component 2024 & 2032
- Figure 28: Europe Wind Turbine MRO Industry Revenue (Million), by Country 2024 & 2032
- Figure 29: Europe Wind Turbine MRO Industry Revenue Share (%), by Country 2024 & 2032
- Figure 30: Asia Pacific Wind Turbine MRO Industry Revenue (Million), by Location of Deployment 2024 & 2032
- Figure 31: Asia Pacific Wind Turbine MRO Industry Revenue Share (%), by Location of Deployment 2024 & 2032
- Figure 32: Asia Pacific Wind Turbine MRO Industry Revenue (Million), by Service Type 2024 & 2032
- Figure 33: Asia Pacific Wind Turbine MRO Industry Revenue Share (%), by Service Type 2024 & 2032
- Figure 34: Asia Pacific Wind Turbine MRO Industry Revenue (Million), by Component 2024 & 2032
- Figure 35: Asia Pacific Wind Turbine MRO Industry Revenue Share (%), by Component 2024 & 2032
- Figure 36: Asia Pacific Wind Turbine MRO Industry Revenue (Million), by Country 2024 & 2032
- Figure 37: Asia Pacific Wind Turbine MRO Industry Revenue Share (%), by Country 2024 & 2032
- Figure 38: South America Wind Turbine MRO Industry Revenue (Million), by Location of Deployment 2024 & 2032
- Figure 39: South America Wind Turbine MRO Industry Revenue Share (%), by Location of Deployment 2024 & 2032
- Figure 40: South America Wind Turbine MRO Industry Revenue (Million), by Service Type 2024 & 2032
- Figure 41: South America Wind Turbine MRO Industry Revenue Share (%), by Service Type 2024 & 2032
- Figure 42: South America Wind Turbine MRO Industry Revenue (Million), by Component 2024 & 2032
- Figure 43: South America Wind Turbine MRO Industry Revenue Share (%), by Component 2024 & 2032
- Figure 44: South America Wind Turbine MRO Industry Revenue (Million), by Country 2024 & 2032
- Figure 45: South America Wind Turbine MRO Industry Revenue Share (%), by Country 2024 & 2032
- Figure 46: Middle East and Africa Wind Turbine MRO Industry Revenue (Million), by Location of Deployment 2024 & 2032
- Figure 47: Middle East and Africa Wind Turbine MRO Industry Revenue Share (%), by Location of Deployment 2024 & 2032
- Figure 48: Middle East and Africa Wind Turbine MRO Industry Revenue (Million), by Service Type 2024 & 2032
- Figure 49: Middle East and Africa Wind Turbine MRO Industry Revenue Share (%), by Service Type 2024 & 2032
- Figure 50: Middle East and Africa Wind Turbine MRO Industry Revenue (Million), by Component 2024 & 2032
- Figure 51: Middle East and Africa Wind Turbine MRO Industry Revenue Share (%), by Component 2024 & 2032
- Figure 52: Middle East and Africa Wind Turbine MRO Industry Revenue (Million), by Country 2024 & 2032
- Figure 53: Middle East and Africa Wind Turbine MRO Industry Revenue Share (%), by Country 2024 & 2032
List of Tables
- Table 1: Global Wind Turbine MRO Industry Revenue Million Forecast, by Region 2019 & 2032
- Table 2: Global Wind Turbine MRO Industry Revenue Million Forecast, by Location of Deployment 2019 & 2032
- Table 3: Global Wind Turbine MRO Industry Revenue Million Forecast, by Service Type 2019 & 2032
- Table 4: Global Wind Turbine MRO Industry Revenue Million Forecast, by Component 2019 & 2032
- Table 5: Global Wind Turbine MRO Industry Revenue Million Forecast, by Region 2019 & 2032
- Table 6: Global Wind Turbine MRO Industry Revenue Million Forecast, by Country 2019 & 2032
- Table 7: United States Wind Turbine MRO Industry Revenue (Million) Forecast, by Application 2019 & 2032
- Table 8: Canada Wind Turbine MRO Industry Revenue (Million) Forecast, by Application 2019 & 2032
- Table 9: Mexico Wind Turbine MRO Industry Revenue (Million) Forecast, by Application 2019 & 2032
- Table 10: Global Wind Turbine MRO Industry Revenue Million Forecast, by Country 2019 & 2032
- Table 11: Germany Wind Turbine MRO Industry Revenue (Million) Forecast, by Application 2019 & 2032
- Table 12: United Kingdom Wind Turbine MRO Industry Revenue (Million) Forecast, by Application 2019 & 2032
- Table 13: France Wind Turbine MRO Industry Revenue (Million) Forecast, by Application 2019 & 2032
- Table 14: Spain Wind Turbine MRO Industry Revenue (Million) Forecast, by Application 2019 & 2032
- Table 15: Italy Wind Turbine MRO Industry Revenue (Million) Forecast, by Application 2019 & 2032
- Table 16: Spain Wind Turbine MRO Industry Revenue (Million) Forecast, by Application 2019 & 2032
- Table 17: Belgium Wind Turbine MRO Industry Revenue (Million) Forecast, by Application 2019 & 2032
- Table 18: Netherland Wind Turbine MRO Industry Revenue (Million) Forecast, by Application 2019 & 2032
- Table 19: Nordics Wind Turbine MRO Industry Revenue (Million) Forecast, by Application 2019 & 2032
- Table 20: Rest of Europe Wind Turbine MRO Industry Revenue (Million) Forecast, by Application 2019 & 2032
- Table 21: Global Wind Turbine MRO Industry Revenue Million Forecast, by Country 2019 & 2032
- Table 22: China Wind Turbine MRO Industry Revenue (Million) Forecast, by Application 2019 & 2032
- Table 23: Japan Wind Turbine MRO Industry Revenue (Million) Forecast, by Application 2019 & 2032
- Table 24: India Wind Turbine MRO Industry Revenue (Million) Forecast, by Application 2019 & 2032
- Table 25: South Korea Wind Turbine MRO Industry Revenue (Million) Forecast, by Application 2019 & 2032
- Table 26: Southeast Asia Wind Turbine MRO Industry Revenue (Million) Forecast, by Application 2019 & 2032
- Table 27: Australia Wind Turbine MRO Industry Revenue (Million) Forecast, by Application 2019 & 2032
- Table 28: Indonesia Wind Turbine MRO Industry Revenue (Million) Forecast, by Application 2019 & 2032
- Table 29: Phillipes Wind Turbine MRO Industry Revenue (Million) Forecast, by Application 2019 & 2032
- Table 30: Singapore Wind Turbine MRO Industry Revenue (Million) Forecast, by Application 2019 & 2032
- Table 31: Thailandc Wind Turbine MRO Industry Revenue (Million) Forecast, by Application 2019 & 2032
- Table 32: Rest of Asia Pacific Wind Turbine MRO Industry Revenue (Million) Forecast, by Application 2019 & 2032
- Table 33: Global Wind Turbine MRO Industry Revenue Million Forecast, by Country 2019 & 2032
- Table 34: Brazil Wind Turbine MRO Industry Revenue (Million) Forecast, by Application 2019 & 2032
- Table 35: Argentina Wind Turbine MRO Industry Revenue (Million) Forecast, by Application 2019 & 2032
- Table 36: Peru Wind Turbine MRO Industry Revenue (Million) Forecast, by Application 2019 & 2032
- Table 37: Chile Wind Turbine MRO Industry Revenue (Million) Forecast, by Application 2019 & 2032
- Table 38: Colombia Wind Turbine MRO Industry Revenue (Million) Forecast, by Application 2019 & 2032
- Table 39: Ecuador Wind Turbine MRO Industry Revenue (Million) Forecast, by Application 2019 & 2032
- Table 40: Venezuela Wind Turbine MRO Industry Revenue (Million) Forecast, by Application 2019 & 2032
- Table 41: Rest of South America Wind Turbine MRO Industry Revenue (Million) Forecast, by Application 2019 & 2032
- Table 42: Global Wind Turbine MRO Industry Revenue Million Forecast, by Country 2019 & 2032
- Table 43: United States Wind Turbine MRO Industry Revenue (Million) Forecast, by Application 2019 & 2032
- Table 44: Canada Wind Turbine MRO Industry Revenue (Million) Forecast, by Application 2019 & 2032
- Table 45: Mexico Wind Turbine MRO Industry Revenue (Million) Forecast, by Application 2019 & 2032
- Table 46: Global Wind Turbine MRO Industry Revenue Million Forecast, by Country 2019 & 2032
- Table 47: United Arab Emirates Wind Turbine MRO Industry Revenue (Million) Forecast, by Application 2019 & 2032
- Table 48: Saudi Arabia Wind Turbine MRO Industry Revenue (Million) Forecast, by Application 2019 & 2032
- Table 49: South Africa Wind Turbine MRO Industry Revenue (Million) Forecast, by Application 2019 & 2032
- Table 50: Rest of Middle East and Africa Wind Turbine MRO Industry Revenue (Million) Forecast, by Application 2019 & 2032
- Table 51: Global Wind Turbine MRO Industry Revenue Million Forecast, by Location of Deployment 2019 & 2032
- Table 52: Global Wind Turbine MRO Industry Revenue Million Forecast, by Service Type 2019 & 2032
- Table 53: Global Wind Turbine MRO Industry Revenue Million Forecast, by Component 2019 & 2032
- Table 54: Global Wind Turbine MRO Industry Revenue Million Forecast, by Country 2019 & 2032
- Table 55: Global Wind Turbine MRO Industry Revenue Million Forecast, by Location of Deployment 2019 & 2032
- Table 56: Global Wind Turbine MRO Industry Revenue Million Forecast, by Service Type 2019 & 2032
- Table 57: Global Wind Turbine MRO Industry Revenue Million Forecast, by Component 2019 & 2032
- Table 58: Global Wind Turbine MRO Industry Revenue Million Forecast, by Country 2019 & 2032
- Table 59: Global Wind Turbine MRO Industry Revenue Million Forecast, by Location of Deployment 2019 & 2032
- Table 60: Global Wind Turbine MRO Industry Revenue Million Forecast, by Service Type 2019 & 2032
- Table 61: Global Wind Turbine MRO Industry Revenue Million Forecast, by Component 2019 & 2032
- Table 62: Global Wind Turbine MRO Industry Revenue Million Forecast, by Country 2019 & 2032
- Table 63: Global Wind Turbine MRO Industry Revenue Million Forecast, by Location of Deployment 2019 & 2032
- Table 64: Global Wind Turbine MRO Industry Revenue Million Forecast, by Service Type 2019 & 2032
- Table 65: Global Wind Turbine MRO Industry Revenue Million Forecast, by Component 2019 & 2032
- Table 66: Global Wind Turbine MRO Industry Revenue Million Forecast, by Country 2019 & 2032
- Table 67: Global Wind Turbine MRO Industry Revenue Million Forecast, by Location of Deployment 2019 & 2032
- Table 68: Global Wind Turbine MRO Industry Revenue Million Forecast, by Service Type 2019 & 2032
- Table 69: Global Wind Turbine MRO Industry Revenue Million Forecast, by Component 2019 & 2032
- Table 70: Global Wind Turbine MRO Industry Revenue Million Forecast, by Country 2019 & 2032
Frequently Asked Questions
1. What is the projected Compound Annual Growth Rate (CAGR) of the Wind Turbine MRO Industry?
The projected CAGR is approximately 15.86%.
2. Which companies are prominent players in the Wind Turbine MRO Industry?
Key companies in the market include ABB Ltd, Vestas Wind Systems A/S, Integrated Power Services LLC*List Not Exhaustive, Siemens Gamesa Renewable Energy SA, Mistras Group, Moventas Gears Oy, Suzlon Energy Ltd, Dana SAC UK Ltd, General Electric Company, Nordex SE, Stork (a Fluor Company), ZF Friedrichshafen AG.
3. What are the main segments of the Wind Turbine MRO Industry?
The market segments include Location of Deployment, Service Type, Component.
4. Can you provide details about the market size?
The market size is estimated to be USD XX Million as of 2022.
5. What are some drivers contributing to market growth?
4.; Growing Environmental Concerns4.; Supportive Government Policies.
6. What are the notable trends driving market growth?
Offshore Wind Installations Expected to Witness Signifcant Growth.
7. Are there any restraints impacting market growth?
4.; High Initial Capital Investment.
8. Can you provide examples of recent developments in the market?
In February 2021, Siemens Gamesa Renewable Energy signed an agreement with Gemini Consortium to extend the operation and maintenance service agreement for 600 MW Gemini's offshore wind energy farm in the Dutch North Sea until 2036. Furthermore, the original 15-year long-term plan (LTP) has been extended by five years and covers different upgrades and new services, providing more control over O&M.
9. What pricing options are available for accessing the report?
Pricing options include single-user, multi-user, and enterprise licenses priced at USD 4750, USD 5250, and USD 8750 respectively.
10. Is the market size provided in terms of value or volume?
The market size is provided in terms of value, measured in Million.
11. Are there any specific market keywords associated with the report?
Yes, the market keyword associated with the report is "Wind Turbine MRO Industry," which aids in identifying and referencing the specific market segment covered.
12. How do I determine which pricing option suits my needs best?
The pricing options vary based on user requirements and access needs. Individual users may opt for single-user licenses, while businesses requiring broader access may choose multi-user or enterprise licenses for cost-effective access to the report.
13. Are there any additional resources or data provided in the Wind Turbine MRO Industry report?
While the report offers comprehensive insights, it's advisable to review the specific contents or supplementary materials provided to ascertain if additional resources or data are available.
14. How can I stay updated on further developments or reports in the Wind Turbine MRO Industry?
To stay informed about further developments, trends, and reports in the Wind Turbine MRO Industry, consider subscribing to industry newsletters, following relevant companies and organizations, or regularly checking reputable industry news sources and publications.
Methodology
Step 1 - Identification of Relevant Samples Size from Population Database


Step 2 - Approaches for Defining Global Market Size (Value, Volume* & Price*)

Note*: In applicable scenarios
Step 3 - Data Sources
Primary Research
- Web Analytics
- Survey Reports
- Research Institute
- Latest Research Reports
- Opinion Leaders
Secondary Research
- Annual Reports
- White Paper
- Latest Press Release
- Industry Association
- Paid Database
- Investor Presentations

Step 4 - Data Triangulation
Involves using different sources of information in order to increase the validity of a study
These sources are likely to be stakeholders in a program - participants, other researchers, program staff, other community members, and so on.
Then we put all data in single framework & apply various statistical tools to find out the dynamic on the market.
During the analysis stage, feedback from the stakeholder groups would be compared to determine areas of agreement as well as areas of divergence


