
Key Insights
The global wellhead components market is experiencing robust growth, driven by increasing global energy demand and ongoing investments in upstream oil and gas exploration and production. The market's Compound Annual Growth Rate (CAGR) exceeding 5% signifies a healthy expansion trajectory projected through 2033. Key drivers include the rising need for efficient and reliable wellhead equipment to manage high-pressure and high-temperature wells, particularly in deepwater and unconventional resource development. Technological advancements leading to the development of lighter, more durable, and corrosion-resistant materials are further fueling market growth. The onshore segment currently holds a larger market share compared to the offshore segment, although the offshore sector is expected to witness faster growth due to the increasing exploration and production activities in deeper waters. Major market players like Weir Group PLC, Schlumberger Limited, and Baker Hughes Company are continuously investing in research and development to enhance their product offerings and consolidate their market positions. Competitive landscape is characterized by both established players and specialized niche players focusing on particular component types.
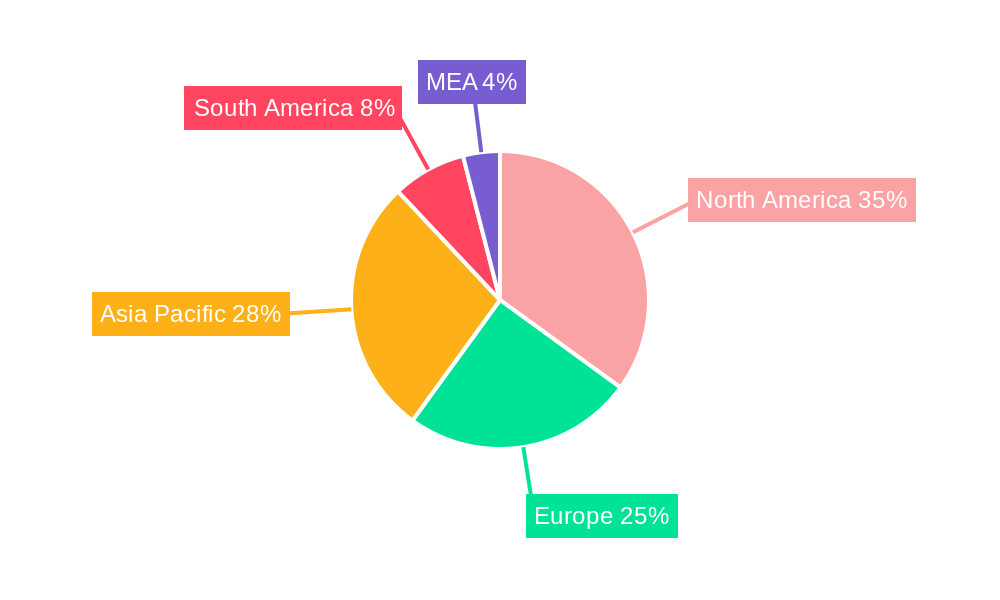
Growth is, however, subject to certain restraints. Fluctuations in oil and gas prices directly impact investment decisions in exploration and production, leading to market volatility. Stringent environmental regulations and the growing focus on sustainable energy sources may pose challenges, although the industry is actively adapting with technologies focusing on improved emission control and reduced environmental impact. Furthermore, geopolitical instability in certain oil-producing regions can disrupt supply chains and influence overall market performance. Regional variations in growth are anticipated, with North America and the Asia-Pacific region expected to be leading contributors due to extensive oil and gas reserves and rising energy consumption. Europe, while a significant market, is anticipated to witness a comparatively slower pace of growth due to more stringent regulatory environments and a focus on energy transition. The South American and Middle Eastern markets are also expected to show gradual growth, dependent on factors like domestic energy policies and investment in infrastructure development.
Wellhead Components Industry Market Report: 2019-2033
This comprehensive report provides an in-depth analysis of the global wellhead components industry, encompassing market dynamics, growth trends, regional segmentation, product landscape, and key player strategies. The study period covers 2019-2033, with a base year of 2025 and a forecast period of 2025-2033. The report offers valuable insights for industry professionals, investors, and stakeholders seeking to understand and capitalize on opportunities within this crucial segment of the oil and gas sector. Market values are presented in million units.
Wellhead Components Industry Market Dynamics & Structure
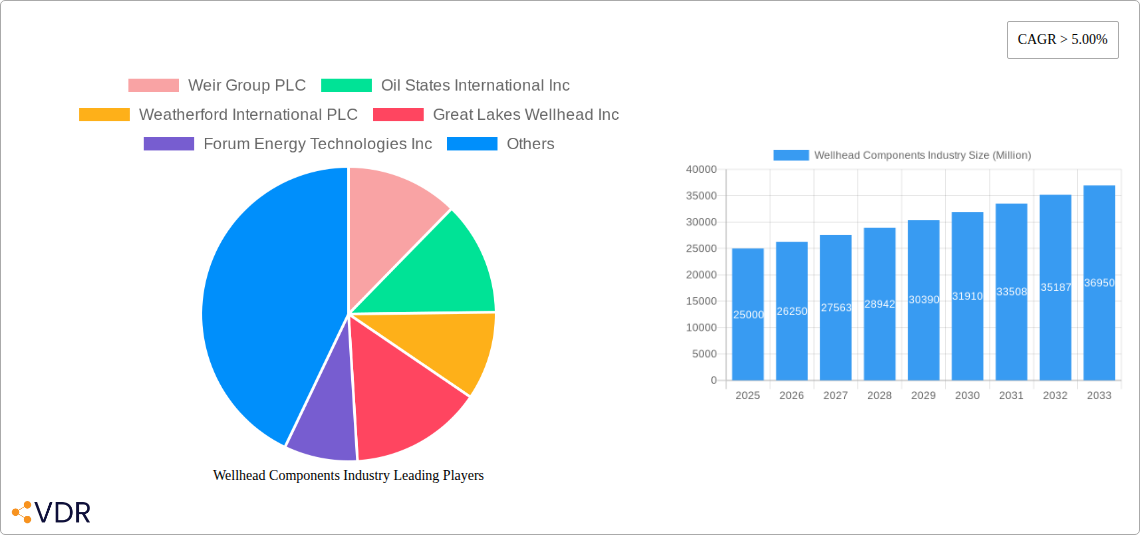
The wellhead components market is characterized by a moderately concentrated landscape, with major players like Weir Group PLC, Oil States International Inc, Weatherford International PLC, Baker Hughes Company, NOV Inc, Schlumberger Limited, and TechnipFMC PLC holding significant market share. However, the presence of several smaller, specialized companies fosters competition.
Technological innovation, driven by the demand for enhanced efficiency, safety, and durability in harsh operating environments, plays a critical role. Stringent regulatory frameworks focused on environmental protection and operational safety influence design and manufacturing processes. The industry experiences competitive pressure from the development of substitute materials and improved manufacturing techniques.
The end-user demographics are primarily oil and gas exploration and production companies, with a significant portion tied to offshore operations. Mergers and acquisitions (M&A) activity has been moderate in recent years, primarily focused on consolidating technological expertise and expanding geographical reach.
- Market Concentration: Moderately concentrated, with top 10 players holding approximately xx% market share in 2024.
- Technological Innovation: Focus on lightweight materials, automation, and advanced monitoring systems.
- Regulatory Landscape: Stringent safety and environmental regulations drive innovation and compliance costs.
- M&A Activity: Moderate activity, primarily driven by technological acquisition and market expansion. Approximately xx deals valued at xx million USD were recorded between 2019 and 2024.
Wellhead Components Industry Growth Trends & Insights
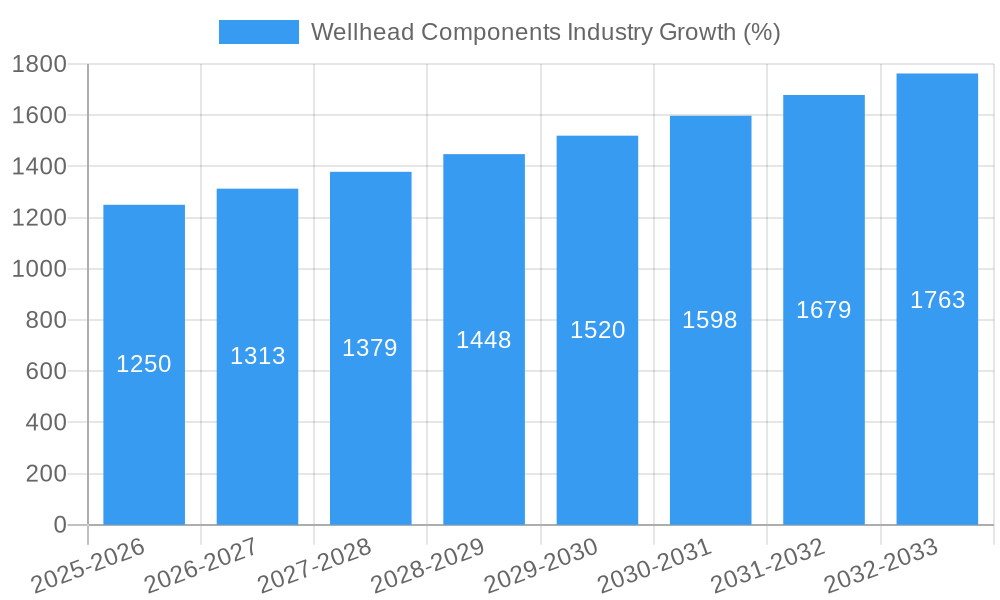
The global wellhead components market witnessed xx% CAGR during the historical period (2019-2024), driven by increasing upstream investments in both onshore and offshore exploration and production activities. Adoption rates are directly influenced by oil and gas price fluctuations and global energy demand. Technological disruptions, such as the introduction of advanced materials and digitalization of operations, contribute to improved performance and reduced maintenance costs. Consumer behavior shifts, influenced by environmental concerns and stricter regulations, increasingly favor sustainable and environmentally friendly solutions. The market size is expected to reach xx million units by 2025 and further grow to xx million units by 2033, reflecting a CAGR of xx% during the forecast period (2025-2033). Market penetration for advanced wellhead components is expected to increase from xx% in 2024 to xx% by 2033.
Dominant Regions, Countries, or Segments in Wellhead Components Industry
The North American (primarily the US and Canada) and Middle Eastern regions have historically dominated the wellhead components market, fueled by substantial oil and gas production activities. However, Asia-Pacific (particularly Malaysia, Australia, and China) is expected to witness significant growth driven by increasing energy demand and exploration activities in the region. Offshore segments contribute significantly to market growth, driven by deepwater projects and technological advancements in subsea wellhead systems. Within wellhead components, casing heads and tubing heads are leading segments due to their fundamental importance in well construction and completion.
- Key Drivers:
- Strong upstream investments in North America and the Middle East
- Growing energy demand in Asia-Pacific
- Increasing deepwater exploration and production activities
- Government policies promoting energy security
- Dominant Regions/Segments:
- North America (Onshore & Offshore) holds the largest market share, followed by the Middle East and Asia-Pacific.
- Offshore segment is expected to show higher growth compared to the onshore segment.
- Casing heads and tubing heads represent the largest segments, followed by casing spools and tubing hangers.
Wellhead Components Industry Product Landscape
The wellhead components market features a diverse range of products, encompassing casing heads, casing spools, tubing heads, casing hangers, secondary seals, tubing hangers, and other specialized components. Innovations focus on enhancing safety, durability, and operational efficiency. Advanced materials, such as high-strength alloys and corrosion-resistant coatings, are increasingly utilized. The industry is also embracing digitalization, incorporating advanced sensors and data analytics for predictive maintenance and optimized performance. Unique selling propositions often center around enhanced sealing capabilities, improved pressure ratings, and reduced weight for ease of handling and installation.
Key Drivers, Barriers & Challenges in Wellhead Components Industry
Key Drivers: Increasing global energy demand, exploration and production activities in unconventional oil and gas resources (such as shale gas), technological advancements leading to higher efficiency and safety, and government incentives for energy independence drive market growth.
Key Challenges: Fluctuations in oil and gas prices, stringent environmental regulations leading to higher compliance costs, intense competition from established and emerging players, supply chain disruptions, and geopolitical instability pose significant challenges. For example, the xx% price fluctuation in oil prices in 2022 directly impacted investment in new projects.
Emerging Opportunities in Wellhead Components Industry
The adoption of automation, advanced materials, and digital solutions presents significant opportunities. Untapped markets in developing economies offer substantial potential for expansion. Innovative applications in unconventional resource extraction, such as shale gas and tight oil, are driving demand. Growing focus on carbon capture and storage creates opportunities for specialized wellhead components.
Growth Accelerators in the Wellhead Components Industry
Technological breakthroughs such as the development of high-performance materials and advanced monitoring systems are crucial growth accelerators. Strategic partnerships between wellhead component manufacturers and oil & gas companies drive innovation and market penetration. Expansion into emerging markets through joint ventures or direct investments further fuels market expansion.
Key Players Shaping the Wellhead Components Industry Market
- Weir Group PLC
- Oil States International Inc
- Weatherford International PLC
- Great Lakes Wellhead Inc
- Forum Energy Technologies Inc
- Baker Hughes Company
- Cactus Wellhead LLC
- Schlumberger Limited
- NOV Inc
- TechnipFMC PLC
Notable Milestones in Wellhead Components Industry Sector
- February 2021: TechnipFMC secures a substantial contract for the Limbayong deepwater project in Malaysia. This significantly boosted the company's presence in the deepwater wellhead market.
- March 2021: Dril-Quip wins an USD 80 million contract for subsea wellhead systems from BP, highlighting the growing demand for high-pressure wellhead technology.
- December 2021: Plexus Holdings PLC receives a purchase order for its POS-GRIP wellhead system, showcasing the acceptance of innovative wellhead technologies.
In-Depth Wellhead Components Industry Market Outlook
The wellhead components market is poised for continued growth, driven by consistent energy demand, technological advancements, and exploration activities in both mature and emerging markets. Strategic partnerships, product diversification, and a focus on sustainability will be crucial for success in this dynamic and competitive industry. The future holds immense potential for players who can adapt to technological changes and meet the evolving needs of the oil and gas industry.
Wellhead Components Industry Segmentation
-
1. Wellhead Component
- 1.1. Casing Heads
- 1.2. Casing Spools
- 1.3. Tubing Heads
- 1.4. Casing Hangers
- 1.5. Secondary Seals
- 1.6. Tubing Hangers
- 1.7. Other Wellhead Components
-
2. Location
- 2.1. Onshore
- 2.2. Offshore
Wellhead Components Industry Segmentation By Geography
- 1. North America
- 2. Europe
- 3. Asia Pacific
- 4. South America
- 5. Middle East and Africa
Wellhead Components Industry REPORT HIGHLIGHTS
| Aspects | Details |
|---|---|
| Study Period | 2019-2033 |
| Base Year | 2024 |
| Estimated Year | 2025 |
| Forecast Period | 2025-2033 |
| Historical Period | 2019-2024 |
| Growth Rate | CAGR of > 5.00% from 2019-2033 |
| Segmentation |
|
Table of Contents
- 1. Introduction
- 1.1. Research Scope
- 1.2. Market Segmentation
- 1.3. Research Methodology
- 1.4. Definitions and Assumptions
- 2. Executive Summary
- 2.1. Introduction
- 3. Market Dynamics
- 3.1. Introduction
- 3.2. Market Drivers
- 3.2.1. 4.; The Rise in Oil and Gas Drilling Activities4.; Increased Shale Gas Exploration
- 3.3. Market Restrains
- 3.3.1. 4.; Increasing Share of Renewable Energy
- 3.4. Market Trends
- 3.4.1. Onshore Segment to Dominate the Market
- 4. Market Factor Analysis
- 4.1. Porters Five Forces
- 4.2. Supply/Value Chain
- 4.3. PESTEL analysis
- 4.4. Market Entropy
- 4.5. Patent/Trademark Analysis
- 5. Global Wellhead Components Industry Analysis, Insights and Forecast, 2019-2031
- 5.1. Market Analysis, Insights and Forecast - by Wellhead Component
- 5.1.1. Casing Heads
- 5.1.2. Casing Spools
- 5.1.3. Tubing Heads
- 5.1.4. Casing Hangers
- 5.1.5. Secondary Seals
- 5.1.6. Tubing Hangers
- 5.1.7. Other Wellhead Components
- 5.2. Market Analysis, Insights and Forecast - by Location
- 5.2.1. Onshore
- 5.2.2. Offshore
- 5.3. Market Analysis, Insights and Forecast - by Region
- 5.3.1. North America
- 5.3.2. Europe
- 5.3.3. Asia Pacific
- 5.3.4. South America
- 5.3.5. Middle East and Africa
- 5.1. Market Analysis, Insights and Forecast - by Wellhead Component
- 6. North America Wellhead Components Industry Analysis, Insights and Forecast, 2019-2031
- 6.1. Market Analysis, Insights and Forecast - by Wellhead Component
- 6.1.1. Casing Heads
- 6.1.2. Casing Spools
- 6.1.3. Tubing Heads
- 6.1.4. Casing Hangers
- 6.1.5. Secondary Seals
- 6.1.6. Tubing Hangers
- 6.1.7. Other Wellhead Components
- 6.2. Market Analysis, Insights and Forecast - by Location
- 6.2.1. Onshore
- 6.2.2. Offshore
- 6.1. Market Analysis, Insights and Forecast - by Wellhead Component
- 7. Europe Wellhead Components Industry Analysis, Insights and Forecast, 2019-2031
- 7.1. Market Analysis, Insights and Forecast - by Wellhead Component
- 7.1.1. Casing Heads
- 7.1.2. Casing Spools
- 7.1.3. Tubing Heads
- 7.1.4. Casing Hangers
- 7.1.5. Secondary Seals
- 7.1.6. Tubing Hangers
- 7.1.7. Other Wellhead Components
- 7.2. Market Analysis, Insights and Forecast - by Location
- 7.2.1. Onshore
- 7.2.2. Offshore
- 7.1. Market Analysis, Insights and Forecast - by Wellhead Component
- 8. Asia Pacific Wellhead Components Industry Analysis, Insights and Forecast, 2019-2031
- 8.1. Market Analysis, Insights and Forecast - by Wellhead Component
- 8.1.1. Casing Heads
- 8.1.2. Casing Spools
- 8.1.3. Tubing Heads
- 8.1.4. Casing Hangers
- 8.1.5. Secondary Seals
- 8.1.6. Tubing Hangers
- 8.1.7. Other Wellhead Components
- 8.2. Market Analysis, Insights and Forecast - by Location
- 8.2.1. Onshore
- 8.2.2. Offshore
- 8.1. Market Analysis, Insights and Forecast - by Wellhead Component
- 9. South America Wellhead Components Industry Analysis, Insights and Forecast, 2019-2031
- 9.1. Market Analysis, Insights and Forecast - by Wellhead Component
- 9.1.1. Casing Heads
- 9.1.2. Casing Spools
- 9.1.3. Tubing Heads
- 9.1.4. Casing Hangers
- 9.1.5. Secondary Seals
- 9.1.6. Tubing Hangers
- 9.1.7. Other Wellhead Components
- 9.2. Market Analysis, Insights and Forecast - by Location
- 9.2.1. Onshore
- 9.2.2. Offshore
- 9.1. Market Analysis, Insights and Forecast - by Wellhead Component
- 10. Middle East and Africa Wellhead Components Industry Analysis, Insights and Forecast, 2019-2031
- 10.1. Market Analysis, Insights and Forecast - by Wellhead Component
- 10.1.1. Casing Heads
- 10.1.2. Casing Spools
- 10.1.3. Tubing Heads
- 10.1.4. Casing Hangers
- 10.1.5. Secondary Seals
- 10.1.6. Tubing Hangers
- 10.1.7. Other Wellhead Components
- 10.2. Market Analysis, Insights and Forecast - by Location
- 10.2.1. Onshore
- 10.2.2. Offshore
- 10.1. Market Analysis, Insights and Forecast - by Wellhead Component
- 11. North America Wellhead Components Industry Analysis, Insights and Forecast, 2019-2031
- 11.1. Market Analysis, Insights and Forecast - By Country/Sub-region
- 11.1.1 United States
- 11.1.2 Canada
- 11.1.3 Mexico
- 12. Europe Wellhead Components Industry Analysis, Insights and Forecast, 2019-2031
- 12.1. Market Analysis, Insights and Forecast - By Country/Sub-region
- 12.1.1 Germany
- 12.1.2 United Kingdom
- 12.1.3 France
- 12.1.4 Spain
- 12.1.5 Italy
- 12.1.6 Spain
- 12.1.7 Belgium
- 12.1.8 Netherland
- 12.1.9 Nordics
- 12.1.10 Rest of Europe
- 13. Asia Pacific Wellhead Components Industry Analysis, Insights and Forecast, 2019-2031
- 13.1. Market Analysis, Insights and Forecast - By Country/Sub-region
- 13.1.1 China
- 13.1.2 Japan
- 13.1.3 India
- 13.1.4 South Korea
- 13.1.5 Southeast Asia
- 13.1.6 Australia
- 13.1.7 Indonesia
- 13.1.8 Phillipes
- 13.1.9 Singapore
- 13.1.10 Thailandc
- 13.1.11 Rest of Asia Pacific
- 14. South America Wellhead Components Industry Analysis, Insights and Forecast, 2019-2031
- 14.1. Market Analysis, Insights and Forecast - By Country/Sub-region
- 14.1.1 Brazil
- 14.1.2 Argentina
- 14.1.3 Peru
- 14.1.4 Chile
- 14.1.5 Colombia
- 14.1.6 Ecuador
- 14.1.7 Venezuela
- 14.1.8 Rest of South America
- 15. North America Wellhead Components Industry Analysis, Insights and Forecast, 2019-2031
- 15.1. Market Analysis, Insights and Forecast - By Country/Sub-region
- 15.1.1 United States
- 15.1.2 Canada
- 15.1.3 Mexico
- 16. MEA Wellhead Components Industry Analysis, Insights and Forecast, 2019-2031
- 16.1. Market Analysis, Insights and Forecast - By Country/Sub-region
- 16.1.1 United Arab Emirates
- 16.1.2 Saudi Arabia
- 16.1.3 South Africa
- 16.1.4 Rest of Middle East and Africa
- 17. Competitive Analysis
- 17.1. Global Market Share Analysis 2024
- 17.2. Company Profiles
- 17.2.1 Weir Group PLC
- 17.2.1.1. Overview
- 17.2.1.2. Products
- 17.2.1.3. SWOT Analysis
- 17.2.1.4. Recent Developments
- 17.2.1.5. Financials (Based on Availability)
- 17.2.2 Oil States International Inc
- 17.2.2.1. Overview
- 17.2.2.2. Products
- 17.2.2.3. SWOT Analysis
- 17.2.2.4. Recent Developments
- 17.2.2.5. Financials (Based on Availability)
- 17.2.3 Weatherford International PLC
- 17.2.3.1. Overview
- 17.2.3.2. Products
- 17.2.3.3. SWOT Analysis
- 17.2.3.4. Recent Developments
- 17.2.3.5. Financials (Based on Availability)
- 17.2.4 Great Lakes Wellhead Inc
- 17.2.4.1. Overview
- 17.2.4.2. Products
- 17.2.4.3. SWOT Analysis
- 17.2.4.4. Recent Developments
- 17.2.4.5. Financials (Based on Availability)
- 17.2.5 Forum Energy Technologies Inc
- 17.2.5.1. Overview
- 17.2.5.2. Products
- 17.2.5.3. SWOT Analysis
- 17.2.5.4. Recent Developments
- 17.2.5.5. Financials (Based on Availability)
- 17.2.6 Baker Hughes Company
- 17.2.6.1. Overview
- 17.2.6.2. Products
- 17.2.6.3. SWOT Analysis
- 17.2.6.4. Recent Developments
- 17.2.6.5. Financials (Based on Availability)
- 17.2.7 Cactus Wellhead LLC*List Not Exhaustive
- 17.2.7.1. Overview
- 17.2.7.2. Products
- 17.2.7.3. SWOT Analysis
- 17.2.7.4. Recent Developments
- 17.2.7.5. Financials (Based on Availability)
- 17.2.8 Schlumberger Limited
- 17.2.8.1. Overview
- 17.2.8.2. Products
- 17.2.8.3. SWOT Analysis
- 17.2.8.4. Recent Developments
- 17.2.8.5. Financials (Based on Availability)
- 17.2.9 NOV Inc
- 17.2.9.1. Overview
- 17.2.9.2. Products
- 17.2.9.3. SWOT Analysis
- 17.2.9.4. Recent Developments
- 17.2.9.5. Financials (Based on Availability)
- 17.2.10 TechnipFMC PLC
- 17.2.10.1. Overview
- 17.2.10.2. Products
- 17.2.10.3. SWOT Analysis
- 17.2.10.4. Recent Developments
- 17.2.10.5. Financials (Based on Availability)
- 17.2.1 Weir Group PLC
List of Figures
- Figure 1: Global Wellhead Components Industry Revenue Breakdown (Million, %) by Region 2024 & 2032
- Figure 2: North America Wellhead Components Industry Revenue (Million), by Country 2024 & 2032
- Figure 3: North America Wellhead Components Industry Revenue Share (%), by Country 2024 & 2032
- Figure 4: Europe Wellhead Components Industry Revenue (Million), by Country 2024 & 2032
- Figure 5: Europe Wellhead Components Industry Revenue Share (%), by Country 2024 & 2032
- Figure 6: Asia Pacific Wellhead Components Industry Revenue (Million), by Country 2024 & 2032
- Figure 7: Asia Pacific Wellhead Components Industry Revenue Share (%), by Country 2024 & 2032
- Figure 8: South America Wellhead Components Industry Revenue (Million), by Country 2024 & 2032
- Figure 9: South America Wellhead Components Industry Revenue Share (%), by Country 2024 & 2032
- Figure 10: North America Wellhead Components Industry Revenue (Million), by Country 2024 & 2032
- Figure 11: North America Wellhead Components Industry Revenue Share (%), by Country 2024 & 2032
- Figure 12: MEA Wellhead Components Industry Revenue (Million), by Country 2024 & 2032
- Figure 13: MEA Wellhead Components Industry Revenue Share (%), by Country 2024 & 2032
- Figure 14: North America Wellhead Components Industry Revenue (Million), by Wellhead Component 2024 & 2032
- Figure 15: North America Wellhead Components Industry Revenue Share (%), by Wellhead Component 2024 & 2032
- Figure 16: North America Wellhead Components Industry Revenue (Million), by Location 2024 & 2032
- Figure 17: North America Wellhead Components Industry Revenue Share (%), by Location 2024 & 2032
- Figure 18: North America Wellhead Components Industry Revenue (Million), by Country 2024 & 2032
- Figure 19: North America Wellhead Components Industry Revenue Share (%), by Country 2024 & 2032
- Figure 20: Europe Wellhead Components Industry Revenue (Million), by Wellhead Component 2024 & 2032
- Figure 21: Europe Wellhead Components Industry Revenue Share (%), by Wellhead Component 2024 & 2032
- Figure 22: Europe Wellhead Components Industry Revenue (Million), by Location 2024 & 2032
- Figure 23: Europe Wellhead Components Industry Revenue Share (%), by Location 2024 & 2032
- Figure 24: Europe Wellhead Components Industry Revenue (Million), by Country 2024 & 2032
- Figure 25: Europe Wellhead Components Industry Revenue Share (%), by Country 2024 & 2032
- Figure 26: Asia Pacific Wellhead Components Industry Revenue (Million), by Wellhead Component 2024 & 2032
- Figure 27: Asia Pacific Wellhead Components Industry Revenue Share (%), by Wellhead Component 2024 & 2032
- Figure 28: Asia Pacific Wellhead Components Industry Revenue (Million), by Location 2024 & 2032
- Figure 29: Asia Pacific Wellhead Components Industry Revenue Share (%), by Location 2024 & 2032
- Figure 30: Asia Pacific Wellhead Components Industry Revenue (Million), by Country 2024 & 2032
- Figure 31: Asia Pacific Wellhead Components Industry Revenue Share (%), by Country 2024 & 2032
- Figure 32: South America Wellhead Components Industry Revenue (Million), by Wellhead Component 2024 & 2032
- Figure 33: South America Wellhead Components Industry Revenue Share (%), by Wellhead Component 2024 & 2032
- Figure 34: South America Wellhead Components Industry Revenue (Million), by Location 2024 & 2032
- Figure 35: South America Wellhead Components Industry Revenue Share (%), by Location 2024 & 2032
- Figure 36: South America Wellhead Components Industry Revenue (Million), by Country 2024 & 2032
- Figure 37: South America Wellhead Components Industry Revenue Share (%), by Country 2024 & 2032
- Figure 38: Middle East and Africa Wellhead Components Industry Revenue (Million), by Wellhead Component 2024 & 2032
- Figure 39: Middle East and Africa Wellhead Components Industry Revenue Share (%), by Wellhead Component 2024 & 2032
- Figure 40: Middle East and Africa Wellhead Components Industry Revenue (Million), by Location 2024 & 2032
- Figure 41: Middle East and Africa Wellhead Components Industry Revenue Share (%), by Location 2024 & 2032
- Figure 42: Middle East and Africa Wellhead Components Industry Revenue (Million), by Country 2024 & 2032
- Figure 43: Middle East and Africa Wellhead Components Industry Revenue Share (%), by Country 2024 & 2032
List of Tables
- Table 1: Global Wellhead Components Industry Revenue Million Forecast, by Region 2019 & 2032
- Table 2: Global Wellhead Components Industry Revenue Million Forecast, by Wellhead Component 2019 & 2032
- Table 3: Global Wellhead Components Industry Revenue Million Forecast, by Location 2019 & 2032
- Table 4: Global Wellhead Components Industry Revenue Million Forecast, by Region 2019 & 2032
- Table 5: Global Wellhead Components Industry Revenue Million Forecast, by Country 2019 & 2032
- Table 6: United States Wellhead Components Industry Revenue (Million) Forecast, by Application 2019 & 2032
- Table 7: Canada Wellhead Components Industry Revenue (Million) Forecast, by Application 2019 & 2032
- Table 8: Mexico Wellhead Components Industry Revenue (Million) Forecast, by Application 2019 & 2032
- Table 9: Global Wellhead Components Industry Revenue Million Forecast, by Country 2019 & 2032
- Table 10: Germany Wellhead Components Industry Revenue (Million) Forecast, by Application 2019 & 2032
- Table 11: United Kingdom Wellhead Components Industry Revenue (Million) Forecast, by Application 2019 & 2032
- Table 12: France Wellhead Components Industry Revenue (Million) Forecast, by Application 2019 & 2032
- Table 13: Spain Wellhead Components Industry Revenue (Million) Forecast, by Application 2019 & 2032
- Table 14: Italy Wellhead Components Industry Revenue (Million) Forecast, by Application 2019 & 2032
- Table 15: Spain Wellhead Components Industry Revenue (Million) Forecast, by Application 2019 & 2032
- Table 16: Belgium Wellhead Components Industry Revenue (Million) Forecast, by Application 2019 & 2032
- Table 17: Netherland Wellhead Components Industry Revenue (Million) Forecast, by Application 2019 & 2032
- Table 18: Nordics Wellhead Components Industry Revenue (Million) Forecast, by Application 2019 & 2032
- Table 19: Rest of Europe Wellhead Components Industry Revenue (Million) Forecast, by Application 2019 & 2032
- Table 20: Global Wellhead Components Industry Revenue Million Forecast, by Country 2019 & 2032
- Table 21: China Wellhead Components Industry Revenue (Million) Forecast, by Application 2019 & 2032
- Table 22: Japan Wellhead Components Industry Revenue (Million) Forecast, by Application 2019 & 2032
- Table 23: India Wellhead Components Industry Revenue (Million) Forecast, by Application 2019 & 2032
- Table 24: South Korea Wellhead Components Industry Revenue (Million) Forecast, by Application 2019 & 2032
- Table 25: Southeast Asia Wellhead Components Industry Revenue (Million) Forecast, by Application 2019 & 2032
- Table 26: Australia Wellhead Components Industry Revenue (Million) Forecast, by Application 2019 & 2032
- Table 27: Indonesia Wellhead Components Industry Revenue (Million) Forecast, by Application 2019 & 2032
- Table 28: Phillipes Wellhead Components Industry Revenue (Million) Forecast, by Application 2019 & 2032
- Table 29: Singapore Wellhead Components Industry Revenue (Million) Forecast, by Application 2019 & 2032
- Table 30: Thailandc Wellhead Components Industry Revenue (Million) Forecast, by Application 2019 & 2032
- Table 31: Rest of Asia Pacific Wellhead Components Industry Revenue (Million) Forecast, by Application 2019 & 2032
- Table 32: Global Wellhead Components Industry Revenue Million Forecast, by Country 2019 & 2032
- Table 33: Brazil Wellhead Components Industry Revenue (Million) Forecast, by Application 2019 & 2032
- Table 34: Argentina Wellhead Components Industry Revenue (Million) Forecast, by Application 2019 & 2032
- Table 35: Peru Wellhead Components Industry Revenue (Million) Forecast, by Application 2019 & 2032
- Table 36: Chile Wellhead Components Industry Revenue (Million) Forecast, by Application 2019 & 2032
- Table 37: Colombia Wellhead Components Industry Revenue (Million) Forecast, by Application 2019 & 2032
- Table 38: Ecuador Wellhead Components Industry Revenue (Million) Forecast, by Application 2019 & 2032
- Table 39: Venezuela Wellhead Components Industry Revenue (Million) Forecast, by Application 2019 & 2032
- Table 40: Rest of South America Wellhead Components Industry Revenue (Million) Forecast, by Application 2019 & 2032
- Table 41: Global Wellhead Components Industry Revenue Million Forecast, by Country 2019 & 2032
- Table 42: United States Wellhead Components Industry Revenue (Million) Forecast, by Application 2019 & 2032
- Table 43: Canada Wellhead Components Industry Revenue (Million) Forecast, by Application 2019 & 2032
- Table 44: Mexico Wellhead Components Industry Revenue (Million) Forecast, by Application 2019 & 2032
- Table 45: Global Wellhead Components Industry Revenue Million Forecast, by Country 2019 & 2032
- Table 46: United Arab Emirates Wellhead Components Industry Revenue (Million) Forecast, by Application 2019 & 2032
- Table 47: Saudi Arabia Wellhead Components Industry Revenue (Million) Forecast, by Application 2019 & 2032
- Table 48: South Africa Wellhead Components Industry Revenue (Million) Forecast, by Application 2019 & 2032
- Table 49: Rest of Middle East and Africa Wellhead Components Industry Revenue (Million) Forecast, by Application 2019 & 2032
- Table 50: Global Wellhead Components Industry Revenue Million Forecast, by Wellhead Component 2019 & 2032
- Table 51: Global Wellhead Components Industry Revenue Million Forecast, by Location 2019 & 2032
- Table 52: Global Wellhead Components Industry Revenue Million Forecast, by Country 2019 & 2032
- Table 53: Global Wellhead Components Industry Revenue Million Forecast, by Wellhead Component 2019 & 2032
- Table 54: Global Wellhead Components Industry Revenue Million Forecast, by Location 2019 & 2032
- Table 55: Global Wellhead Components Industry Revenue Million Forecast, by Country 2019 & 2032
- Table 56: Global Wellhead Components Industry Revenue Million Forecast, by Wellhead Component 2019 & 2032
- Table 57: Global Wellhead Components Industry Revenue Million Forecast, by Location 2019 & 2032
- Table 58: Global Wellhead Components Industry Revenue Million Forecast, by Country 2019 & 2032
- Table 59: Global Wellhead Components Industry Revenue Million Forecast, by Wellhead Component 2019 & 2032
- Table 60: Global Wellhead Components Industry Revenue Million Forecast, by Location 2019 & 2032
- Table 61: Global Wellhead Components Industry Revenue Million Forecast, by Country 2019 & 2032
- Table 62: Global Wellhead Components Industry Revenue Million Forecast, by Wellhead Component 2019 & 2032
- Table 63: Global Wellhead Components Industry Revenue Million Forecast, by Location 2019 & 2032
- Table 64: Global Wellhead Components Industry Revenue Million Forecast, by Country 2019 & 2032
Frequently Asked Questions
1. What is the projected Compound Annual Growth Rate (CAGR) of the Wellhead Components Industry?
The projected CAGR is approximately > 5.00%.
2. Which companies are prominent players in the Wellhead Components Industry?
Key companies in the market include Weir Group PLC, Oil States International Inc, Weatherford International PLC, Great Lakes Wellhead Inc, Forum Energy Technologies Inc, Baker Hughes Company, Cactus Wellhead LLC*List Not Exhaustive, Schlumberger Limited, NOV Inc, TechnipFMC PLC.
3. What are the main segments of the Wellhead Components Industry?
The market segments include Wellhead Component, Location.
4. Can you provide details about the market size?
The market size is estimated to be USD XX Million as of 2022.
5. What are some drivers contributing to market growth?
4.; The Rise in Oil and Gas Drilling Activities4.; Increased Shale Gas Exploration.
6. What are the notable trends driving market growth?
Onshore Segment to Dominate the Market.
7. Are there any restraints impacting market growth?
4.; Increasing Share of Renewable Energy.
8. Can you provide examples of recent developments in the market?
In February 2021, TechnipFMC's subsidiary, FMC Wellhead Equipment Sdn Bhd was awarded a substantial contract by PETRONAS Carigali Sdn Bhd for Limbayong deepwater development project in offshore Malaysia. This contract covers the development of 10 deepwater wells and their tieback to the Limbayong Floating Production Storage and Offloading (FPSO) unit in Malaysia.
9. What pricing options are available for accessing the report?
Pricing options include single-user, multi-user, and enterprise licenses priced at USD 4750, USD 5250, and USD 8750 respectively.
10. Is the market size provided in terms of value or volume?
The market size is provided in terms of value, measured in Million.
11. Are there any specific market keywords associated with the report?
Yes, the market keyword associated with the report is "Wellhead Components Industry," which aids in identifying and referencing the specific market segment covered.
12. How do I determine which pricing option suits my needs best?
The pricing options vary based on user requirements and access needs. Individual users may opt for single-user licenses, while businesses requiring broader access may choose multi-user or enterprise licenses for cost-effective access to the report.
13. Are there any additional resources or data provided in the Wellhead Components Industry report?
While the report offers comprehensive insights, it's advisable to review the specific contents or supplementary materials provided to ascertain if additional resources or data are available.
14. How can I stay updated on further developments or reports in the Wellhead Components Industry?
To stay informed about further developments, trends, and reports in the Wellhead Components Industry, consider subscribing to industry newsletters, following relevant companies and organizations, or regularly checking reputable industry news sources and publications.
Methodology
Step 1 - Identification of Relevant Samples Size from Population Database


Step 2 - Approaches for Defining Global Market Size (Value, Volume* & Price*)

Note*: In applicable scenarios
Step 3 - Data Sources
Primary Research
- Web Analytics
- Survey Reports
- Research Institute
- Latest Research Reports
- Opinion Leaders
Secondary Research
- Annual Reports
- White Paper
- Latest Press Release
- Industry Association
- Paid Database
- Investor Presentations

Step 4 - Data Triangulation
Involves using different sources of information in order to increase the validity of a study
These sources are likely to be stakeholders in a program - participants, other researchers, program staff, other community members, and so on.
Then we put all data in single framework & apply various statistical tools to find out the dynamic on the market.
During the analysis stage, feedback from the stakeholder groups would be compared to determine areas of agreement as well as areas of divergence


