
Key Insights
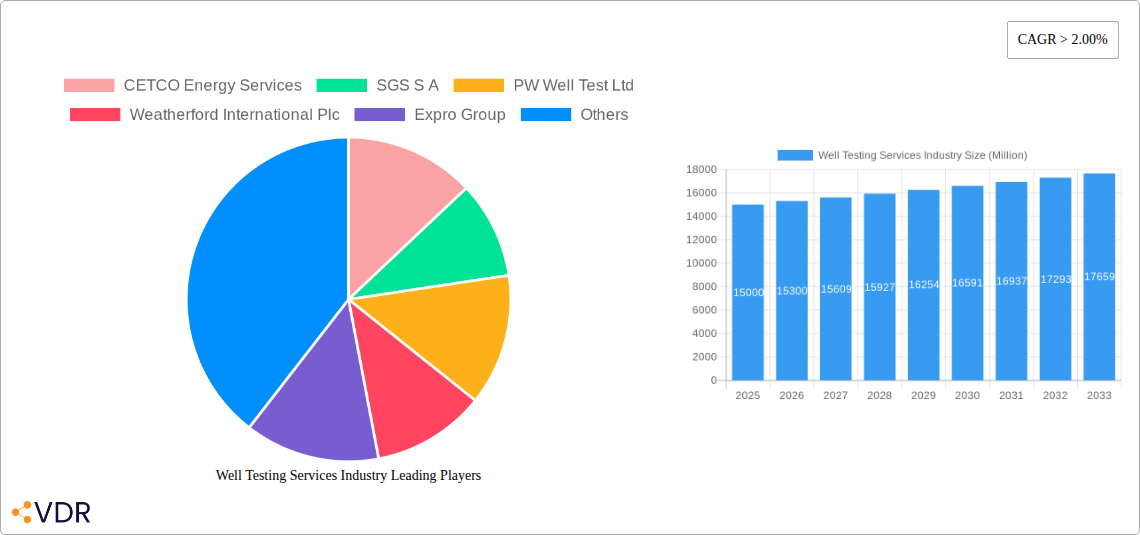
The global well testing services market is experiencing robust growth, driven by increasing oil and gas exploration and production activities worldwide. A CAGR exceeding 2% indicates a steadily expanding market, projected to reach significant value over the forecast period (2025-2033). Key drivers include the rising demand for efficient reservoir management techniques, stricter regulatory compliance necessitating thorough well testing, and the exploration of unconventional resources like shale gas and tight oil, which require sophisticated well testing procedures. Technological advancements, such as the adoption of automated and remote well testing systems, further enhance efficiency and reduce operational costs, fueling market growth. The market is segmented by stage (exploration, appraisal & development, production) and location of deployment (onshore, offshore), with the onshore segment currently dominating due to its established infrastructure and accessibility. However, the offshore segment is anticipated to witness significant growth driven by discoveries in deeper waters and technological advancements enabling safer and more efficient offshore operations. Leading players such as Halliburton, Schlumberger, Baker Hughes, and Weatherford, among others, are investing heavily in research and development to improve the efficiency and reliability of their well testing services, fostering intense competition and innovation.
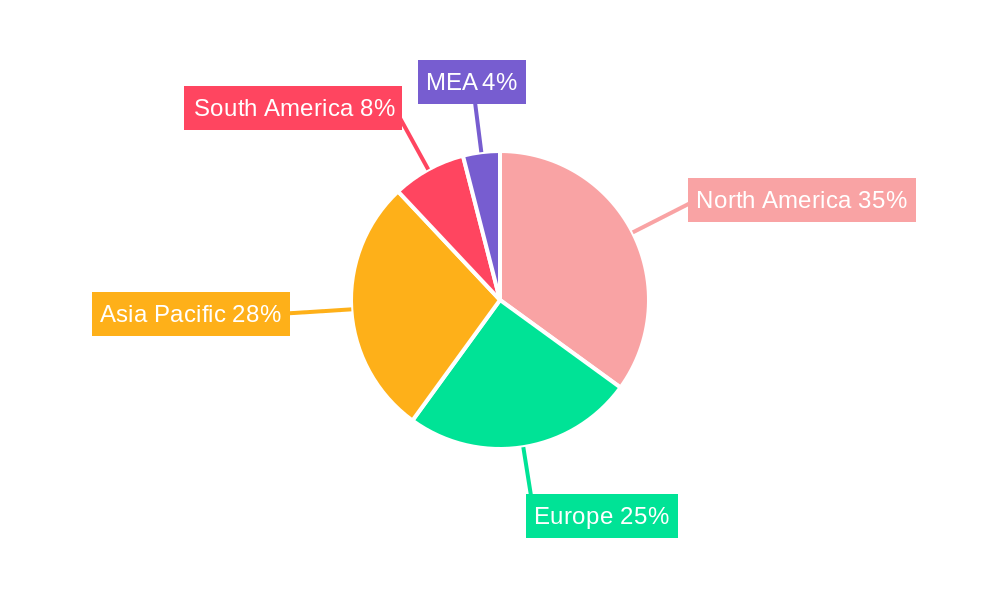
Geographic distribution shows significant market presence across North America (particularly the US), Europe, and the Asia-Pacific region, driven by substantial energy demands and ongoing exploration activities. Emerging economies in Asia-Pacific and the Middle East & Africa are also demonstrating increasing investment in their energy sectors, creating new opportunities for well testing service providers. Despite the positive outlook, the market faces certain restraints, including fluctuating oil and gas prices, the impact of economic downturns on exploration budgets, and the inherent risks associated with well testing operations, especially in challenging environments. However, ongoing technological innovations and the long-term need for reliable reservoir characterization are expected to mitigate these challenges and sustain the market's overall positive trajectory. The competitive landscape is characterized by both established multinational corporations and specialized smaller companies, each focusing on specific niches within the market.
Well Testing Services Industry Market Report: 2019-2033
This comprehensive report provides an in-depth analysis of the Well Testing Services industry, encompassing market dynamics, growth trends, regional performance, and competitive landscape. The study period covers 2019-2033, with 2025 as the base and estimated year. The forecast period spans 2025-2033, and the historical period encompasses 2019-2024. The report segments the market by stage (Exploration, Appraisal & Development, Production), location (Onshore, Offshore), and analyzes key players including CETCO Energy Services, SGS S A, PW Well Test Ltd, Weatherford International Plc, Expro Group, TETRA Technologies Inc, Baker Hughes Company, Halliburton Company, Schlumberger Limited, and China Oilfield Services Limited. The global market size in 2025 is estimated at xx Million.
Well Testing Services Industry Market Dynamics & Structure
The Well Testing Services market is characterized by moderate concentration, with a few major players holding significant market share. Technological innovation, particularly in data analytics and automation, is a key driver, while stringent regulatory frameworks and environmental concerns influence market practices. The industry faces competition from alternative testing methods, though the demand for accurate and reliable well testing remains robust. M&A activity has been moderate in recent years, with xx deals recorded between 2019 and 2024, leading to consolidation in certain segments. End-user demographics are primarily driven by the oil and gas exploration and production companies.
- Market Concentration: Moderately concentrated, with top 5 players holding approximately xx% market share in 2025.
- Technological Innovation: Focus on automation, remote operations, and advanced data analytics drives efficiency and reduces costs.
- Regulatory Framework: Stringent environmental regulations and safety standards impact operational costs and practices.
- Competitive Substitutes: Limited direct substitutes exist, but alternative testing approaches pose a competitive challenge.
- End-User Demographics: Primarily oil and gas exploration and production companies, with increasing participation from renewable energy sectors.
- M&A Trends: Moderate activity with xx deals between 2019-2024, driven by consolidation and expansion strategies.
Well Testing Services Industry Growth Trends & Insights
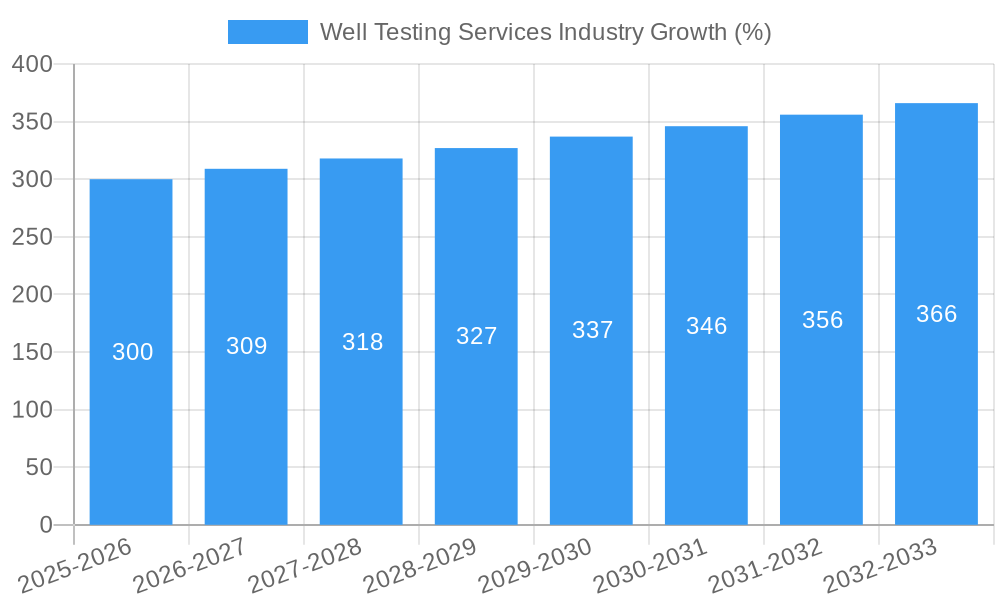
The Well Testing Services market is experiencing steady growth, driven by increasing exploration and production activities globally. The market size is projected to reach xx Million by 2033, exhibiting a CAGR of xx% during the forecast period. Technological advancements are accelerating adoption rates, while evolving consumer preferences towards efficient and data-rich solutions are shaping market dynamics. The shift towards offshore and unconventional resources further boosts market demand. Market penetration remains relatively high in mature regions, with future growth focusing on emerging markets and technological upgrades.
Dominant Regions, Countries, or Segments in Well Testing Services Industry
The North American region currently dominates the Well Testing Services market, holding approximately xx% market share in 2025, followed by the Middle East and Asia Pacific. Within segments, the Production stage accounts for the largest share (approximately xx%) driven by the need for continuous monitoring and optimization of existing wells. Onshore operations currently hold a larger market share (xx%) than offshore due to higher accessibility and lower operational costs, although offshore is expected to show faster growth in the forecast period.
- Key Drivers (North America): Robust oil and gas production, strong infrastructure, and supportive government policies.
- Key Drivers (Middle East): Significant investments in oil and gas exploration, large reserves, and increasing demand for sophisticated testing solutions.
- Key Drivers (Asia Pacific): Rising energy demand, expanding exploration activities, and government initiatives promoting energy independence.
- Production Stage Dominance: High demand for ongoing well monitoring and optimization.
- Onshore Segment Dominance: Lower costs and easier accessibility compared to offshore operations.
Well Testing Services Industry Product Landscape
The Well Testing Services industry offers a diverse range of products, including pressure/rate testing equipment, flow measurement tools, and data acquisition systems. Recent innovations focus on enhanced accuracy, automation, and remote capabilities. These advancements enable more efficient and cost-effective well testing, leading to better reservoir management and production optimization. Unique selling propositions often center on data analytics capabilities and specialized software integration, providing real-time insights into well performance.
Key Drivers, Barriers & Challenges in Well Testing Services Industry
Key Drivers: Increased exploration and production activity, particularly in unconventional resources, the demand for enhanced reservoir management, stringent regulatory requirements, and the adoption of advanced technologies for improved efficiency.
Challenges: Fluctuations in oil and gas prices, the cyclical nature of the energy industry, supply chain disruptions, high capital expenditures associated with advanced technologies, and competitive pressure from established and emerging players. Supply chain issues, particularly in specialized components, can lead to project delays and cost overruns, impacting the market's overall performance by an estimated xx% in years with significant disruptions.
Emerging Opportunities in Well Testing Services Industry
Significant opportunities lie in the expansion into emerging markets, the development of integrated solutions combining various testing techniques, and the incorporation of advanced data analytics and machine learning for predictive maintenance and reservoir modeling. The growing demand for unconventional resource development offers another promising avenue for growth. The development of environmentally friendly and sustainable well testing technologies will also drive market growth.
Growth Accelerators in the Well Testing Services Industry
Technological advancements, strategic partnerships to expand service offerings, and expansion into new and emerging oil and gas regions are key growth catalysts. Technological breakthroughs in automation, remote operations, and data analytics are enhancing efficiency and providing more cost-effective well testing.
Key Players Shaping the Well Testing Services Industry Market
- CETCO Energy Services
- SGS S A
- PW Well Test Ltd
- Weatherford International Plc
- Expro Group
- TETRA Technologies Inc
- Baker Hughes Company
- Halliburton Company
- Schlumberger Limited
- China Oilfield Services Limited
Notable Milestones in Well Testing Services Industry Sector
- 2021: Schlumberger launched a new automated well testing system, improving efficiency and reducing operational risks.
- 2022: Baker Hughes acquired a smaller well testing company, expanding its service portfolio and market presence.
- 2023: Several key players announced investments in research and development focused on improving data analytics capabilities in well testing services.
- 2024: Increased focus on digitalization and data-driven decision-making within the industry.
In-Depth Well Testing Services Industry Market Outlook
The Well Testing Services market is poised for continued growth, driven by the increasing demand for efficient and cost-effective well testing solutions. Strategic partnerships, technological innovations, and expansion into new markets will be crucial for sustained success. The long-term outlook is positive, fueled by the growing global energy demand and technological advancement. Opportunities exist in emerging markets and the development of sustainable solutions catering to the evolving energy landscape.
Well Testing Services Industry Segmentation
-
1. Stage
- 1.1. Exploration, Appraisal, & Development
- 1.2. Production
-
2. Location of Deployment
- 2.1. Onshore
- 2.2. Offshore
Well Testing Services Industry Segmentation By Geography
- 1. North America
- 2. Europe
- 3. Asia Pacific
- 4. South America
- 5. Middle East and Africa
Well Testing Services Industry REPORT HIGHLIGHTS
| Aspects | Details |
|---|---|
| Study Period | 2019-2033 |
| Base Year | 2024 |
| Estimated Year | 2025 |
| Forecast Period | 2025-2033 |
| Historical Period | 2019-2024 |
| Growth Rate | CAGR of > 2.00% from 2019-2033 |
| Segmentation |
|
Table of Contents
- 1. Introduction
- 1.1. Research Scope
- 1.2. Market Segmentation
- 1.3. Research Methodology
- 1.4. Definitions and Assumptions
- 2. Executive Summary
- 2.1. Introduction
- 3. Market Dynamics
- 3.1. Introduction
- 3.2. Market Drivers
- 3.2.1 4.; Increasing Exploration in Offshore Areas4.; The Strengthening of Crude Oil Prices
- 3.2.2 Making the Upstream Activities Economically Feasible
- 3.3. Market Restrains
- 3.3.1. 4.; Shifting to Renewable Energy Sources
- 3.4. Market Trends
- 3.4.1. Onshore Segment to Dominate the Market
- 4. Market Factor Analysis
- 4.1. Porters Five Forces
- 4.2. Supply/Value Chain
- 4.3. PESTEL analysis
- 4.4. Market Entropy
- 4.5. Patent/Trademark Analysis
- 5. Global Well Testing Services Industry Analysis, Insights and Forecast, 2019-2031
- 5.1. Market Analysis, Insights and Forecast - by Stage
- 5.1.1. Exploration, Appraisal, & Development
- 5.1.2. Production
- 5.2. Market Analysis, Insights and Forecast - by Location of Deployment
- 5.2.1. Onshore
- 5.2.2. Offshore
- 5.3. Market Analysis, Insights and Forecast - by Region
- 5.3.1. North America
- 5.3.2. Europe
- 5.3.3. Asia Pacific
- 5.3.4. South America
- 5.3.5. Middle East and Africa
- 5.1. Market Analysis, Insights and Forecast - by Stage
- 6. North America Well Testing Services Industry Analysis, Insights and Forecast, 2019-2031
- 6.1. Market Analysis, Insights and Forecast - by Stage
- 6.1.1. Exploration, Appraisal, & Development
- 6.1.2. Production
- 6.2. Market Analysis, Insights and Forecast - by Location of Deployment
- 6.2.1. Onshore
- 6.2.2. Offshore
- 6.1. Market Analysis, Insights and Forecast - by Stage
- 7. Europe Well Testing Services Industry Analysis, Insights and Forecast, 2019-2031
- 7.1. Market Analysis, Insights and Forecast - by Stage
- 7.1.1. Exploration, Appraisal, & Development
- 7.1.2. Production
- 7.2. Market Analysis, Insights and Forecast - by Location of Deployment
- 7.2.1. Onshore
- 7.2.2. Offshore
- 7.1. Market Analysis, Insights and Forecast - by Stage
- 8. Asia Pacific Well Testing Services Industry Analysis, Insights and Forecast, 2019-2031
- 8.1. Market Analysis, Insights and Forecast - by Stage
- 8.1.1. Exploration, Appraisal, & Development
- 8.1.2. Production
- 8.2. Market Analysis, Insights and Forecast - by Location of Deployment
- 8.2.1. Onshore
- 8.2.2. Offshore
- 8.1. Market Analysis, Insights and Forecast - by Stage
- 9. South America Well Testing Services Industry Analysis, Insights and Forecast, 2019-2031
- 9.1. Market Analysis, Insights and Forecast - by Stage
- 9.1.1. Exploration, Appraisal, & Development
- 9.1.2. Production
- 9.2. Market Analysis, Insights and Forecast - by Location of Deployment
- 9.2.1. Onshore
- 9.2.2. Offshore
- 9.1. Market Analysis, Insights and Forecast - by Stage
- 10. Middle East and Africa Well Testing Services Industry Analysis, Insights and Forecast, 2019-2031
- 10.1. Market Analysis, Insights and Forecast - by Stage
- 10.1.1. Exploration, Appraisal, & Development
- 10.1.2. Production
- 10.2. Market Analysis, Insights and Forecast - by Location of Deployment
- 10.2.1. Onshore
- 10.2.2. Offshore
- 10.1. Market Analysis, Insights and Forecast - by Stage
- 11. North America Well Testing Services Industry Analysis, Insights and Forecast, 2019-2031
- 11.1. Market Analysis, Insights and Forecast - By Country/Sub-region
- 11.1.1 United States
- 11.1.2 Canada
- 11.1.3 Mexico
- 12. Europe Well Testing Services Industry Analysis, Insights and Forecast, 2019-2031
- 12.1. Market Analysis, Insights and Forecast - By Country/Sub-region
- 12.1.1 Germany
- 12.1.2 United Kingdom
- 12.1.3 France
- 12.1.4 Spain
- 12.1.5 Italy
- 12.1.6 Spain
- 12.1.7 Belgium
- 12.1.8 Netherland
- 12.1.9 Nordics
- 12.1.10 Rest of Europe
- 13. Asia Pacific Well Testing Services Industry Analysis, Insights and Forecast, 2019-2031
- 13.1. Market Analysis, Insights and Forecast - By Country/Sub-region
- 13.1.1 China
- 13.1.2 Japan
- 13.1.3 India
- 13.1.4 South Korea
- 13.1.5 Southeast Asia
- 13.1.6 Australia
- 13.1.7 Indonesia
- 13.1.8 Phillipes
- 13.1.9 Singapore
- 13.1.10 Thailandc
- 13.1.11 Rest of Asia Pacific
- 14. South America Well Testing Services Industry Analysis, Insights and Forecast, 2019-2031
- 14.1. Market Analysis, Insights and Forecast - By Country/Sub-region
- 14.1.1 Brazil
- 14.1.2 Argentina
- 14.1.3 Peru
- 14.1.4 Chile
- 14.1.5 Colombia
- 14.1.6 Ecuador
- 14.1.7 Venezuela
- 14.1.8 Rest of South America
- 15. MEA Well Testing Services Industry Analysis, Insights and Forecast, 2019-2031
- 15.1. Market Analysis, Insights and Forecast - By Country/Sub-region
- 15.1.1 United Arab Emirates
- 15.1.2 Saudi Arabia
- 15.1.3 South Africa
- 15.1.4 Rest of Middle East and Africa
- 16. Competitive Analysis
- 16.1. Global Market Share Analysis 2024
- 16.2. Company Profiles
- 16.2.1 CETCO Energy Services
- 16.2.1.1. Overview
- 16.2.1.2. Products
- 16.2.1.3. SWOT Analysis
- 16.2.1.4. Recent Developments
- 16.2.1.5. Financials (Based on Availability)
- 16.2.2 SGS S A
- 16.2.2.1. Overview
- 16.2.2.2. Products
- 16.2.2.3. SWOT Analysis
- 16.2.2.4. Recent Developments
- 16.2.2.5. Financials (Based on Availability)
- 16.2.3 PW Well Test Ltd
- 16.2.3.1. Overview
- 16.2.3.2. Products
- 16.2.3.3. SWOT Analysis
- 16.2.3.4. Recent Developments
- 16.2.3.5. Financials (Based on Availability)
- 16.2.4 Weatherford International Plc
- 16.2.4.1. Overview
- 16.2.4.2. Products
- 16.2.4.3. SWOT Analysis
- 16.2.4.4. Recent Developments
- 16.2.4.5. Financials (Based on Availability)
- 16.2.5 Expro Group
- 16.2.5.1. Overview
- 16.2.5.2. Products
- 16.2.5.3. SWOT Analysis
- 16.2.5.4. Recent Developments
- 16.2.5.5. Financials (Based on Availability)
- 16.2.6 TETRA Technologies Inc
- 16.2.6.1. Overview
- 16.2.6.2. Products
- 16.2.6.3. SWOT Analysis
- 16.2.6.4. Recent Developments
- 16.2.6.5. Financials (Based on Availability)
- 16.2.7 Baker Hughes Company
- 16.2.7.1. Overview
- 16.2.7.2. Products
- 16.2.7.3. SWOT Analysis
- 16.2.7.4. Recent Developments
- 16.2.7.5. Financials (Based on Availability)
- 16.2.8 Halliburton Company
- 16.2.8.1. Overview
- 16.2.8.2. Products
- 16.2.8.3. SWOT Analysis
- 16.2.8.4. Recent Developments
- 16.2.8.5. Financials (Based on Availability)
- 16.2.9 Schlumberger Limited
- 16.2.9.1. Overview
- 16.2.9.2. Products
- 16.2.9.3. SWOT Analysis
- 16.2.9.4. Recent Developments
- 16.2.9.5. Financials (Based on Availability)
- 16.2.10 China Oilfield Secvices Limited
- 16.2.10.1. Overview
- 16.2.10.2. Products
- 16.2.10.3. SWOT Analysis
- 16.2.10.4. Recent Developments
- 16.2.10.5. Financials (Based on Availability)
- 16.2.1 CETCO Energy Services
List of Figures
- Figure 1: Global Well Testing Services Industry Revenue Breakdown (Million, %) by Region 2024 & 2032
- Figure 2: North America Well Testing Services Industry Revenue (Million), by Country 2024 & 2032
- Figure 3: North America Well Testing Services Industry Revenue Share (%), by Country 2024 & 2032
- Figure 4: Europe Well Testing Services Industry Revenue (Million), by Country 2024 & 2032
- Figure 5: Europe Well Testing Services Industry Revenue Share (%), by Country 2024 & 2032
- Figure 6: Asia Pacific Well Testing Services Industry Revenue (Million), by Country 2024 & 2032
- Figure 7: Asia Pacific Well Testing Services Industry Revenue Share (%), by Country 2024 & 2032
- Figure 8: South America Well Testing Services Industry Revenue (Million), by Country 2024 & 2032
- Figure 9: South America Well Testing Services Industry Revenue Share (%), by Country 2024 & 2032
- Figure 10: MEA Well Testing Services Industry Revenue (Million), by Country 2024 & 2032
- Figure 11: MEA Well Testing Services Industry Revenue Share (%), by Country 2024 & 2032
- Figure 12: North America Well Testing Services Industry Revenue (Million), by Stage 2024 & 2032
- Figure 13: North America Well Testing Services Industry Revenue Share (%), by Stage 2024 & 2032
- Figure 14: North America Well Testing Services Industry Revenue (Million), by Location of Deployment 2024 & 2032
- Figure 15: North America Well Testing Services Industry Revenue Share (%), by Location of Deployment 2024 & 2032
- Figure 16: North America Well Testing Services Industry Revenue (Million), by Country 2024 & 2032
- Figure 17: North America Well Testing Services Industry Revenue Share (%), by Country 2024 & 2032
- Figure 18: Europe Well Testing Services Industry Revenue (Million), by Stage 2024 & 2032
- Figure 19: Europe Well Testing Services Industry Revenue Share (%), by Stage 2024 & 2032
- Figure 20: Europe Well Testing Services Industry Revenue (Million), by Location of Deployment 2024 & 2032
- Figure 21: Europe Well Testing Services Industry Revenue Share (%), by Location of Deployment 2024 & 2032
- Figure 22: Europe Well Testing Services Industry Revenue (Million), by Country 2024 & 2032
- Figure 23: Europe Well Testing Services Industry Revenue Share (%), by Country 2024 & 2032
- Figure 24: Asia Pacific Well Testing Services Industry Revenue (Million), by Stage 2024 & 2032
- Figure 25: Asia Pacific Well Testing Services Industry Revenue Share (%), by Stage 2024 & 2032
- Figure 26: Asia Pacific Well Testing Services Industry Revenue (Million), by Location of Deployment 2024 & 2032
- Figure 27: Asia Pacific Well Testing Services Industry Revenue Share (%), by Location of Deployment 2024 & 2032
- Figure 28: Asia Pacific Well Testing Services Industry Revenue (Million), by Country 2024 & 2032
- Figure 29: Asia Pacific Well Testing Services Industry Revenue Share (%), by Country 2024 & 2032
- Figure 30: South America Well Testing Services Industry Revenue (Million), by Stage 2024 & 2032
- Figure 31: South America Well Testing Services Industry Revenue Share (%), by Stage 2024 & 2032
- Figure 32: South America Well Testing Services Industry Revenue (Million), by Location of Deployment 2024 & 2032
- Figure 33: South America Well Testing Services Industry Revenue Share (%), by Location of Deployment 2024 & 2032
- Figure 34: South America Well Testing Services Industry Revenue (Million), by Country 2024 & 2032
- Figure 35: South America Well Testing Services Industry Revenue Share (%), by Country 2024 & 2032
- Figure 36: Middle East and Africa Well Testing Services Industry Revenue (Million), by Stage 2024 & 2032
- Figure 37: Middle East and Africa Well Testing Services Industry Revenue Share (%), by Stage 2024 & 2032
- Figure 38: Middle East and Africa Well Testing Services Industry Revenue (Million), by Location of Deployment 2024 & 2032
- Figure 39: Middle East and Africa Well Testing Services Industry Revenue Share (%), by Location of Deployment 2024 & 2032
- Figure 40: Middle East and Africa Well Testing Services Industry Revenue (Million), by Country 2024 & 2032
- Figure 41: Middle East and Africa Well Testing Services Industry Revenue Share (%), by Country 2024 & 2032
List of Tables
- Table 1: Global Well Testing Services Industry Revenue Million Forecast, by Region 2019 & 2032
- Table 2: Global Well Testing Services Industry Revenue Million Forecast, by Stage 2019 & 2032
- Table 3: Global Well Testing Services Industry Revenue Million Forecast, by Location of Deployment 2019 & 2032
- Table 4: Global Well Testing Services Industry Revenue Million Forecast, by Region 2019 & 2032
- Table 5: Global Well Testing Services Industry Revenue Million Forecast, by Country 2019 & 2032
- Table 6: United States Well Testing Services Industry Revenue (Million) Forecast, by Application 2019 & 2032
- Table 7: Canada Well Testing Services Industry Revenue (Million) Forecast, by Application 2019 & 2032
- Table 8: Mexico Well Testing Services Industry Revenue (Million) Forecast, by Application 2019 & 2032
- Table 9: Global Well Testing Services Industry Revenue Million Forecast, by Country 2019 & 2032
- Table 10: Germany Well Testing Services Industry Revenue (Million) Forecast, by Application 2019 & 2032
- Table 11: United Kingdom Well Testing Services Industry Revenue (Million) Forecast, by Application 2019 & 2032
- Table 12: France Well Testing Services Industry Revenue (Million) Forecast, by Application 2019 & 2032
- Table 13: Spain Well Testing Services Industry Revenue (Million) Forecast, by Application 2019 & 2032
- Table 14: Italy Well Testing Services Industry Revenue (Million) Forecast, by Application 2019 & 2032
- Table 15: Spain Well Testing Services Industry Revenue (Million) Forecast, by Application 2019 & 2032
- Table 16: Belgium Well Testing Services Industry Revenue (Million) Forecast, by Application 2019 & 2032
- Table 17: Netherland Well Testing Services Industry Revenue (Million) Forecast, by Application 2019 & 2032
- Table 18: Nordics Well Testing Services Industry Revenue (Million) Forecast, by Application 2019 & 2032
- Table 19: Rest of Europe Well Testing Services Industry Revenue (Million) Forecast, by Application 2019 & 2032
- Table 20: Global Well Testing Services Industry Revenue Million Forecast, by Country 2019 & 2032
- Table 21: China Well Testing Services Industry Revenue (Million) Forecast, by Application 2019 & 2032
- Table 22: Japan Well Testing Services Industry Revenue (Million) Forecast, by Application 2019 & 2032
- Table 23: India Well Testing Services Industry Revenue (Million) Forecast, by Application 2019 & 2032
- Table 24: South Korea Well Testing Services Industry Revenue (Million) Forecast, by Application 2019 & 2032
- Table 25: Southeast Asia Well Testing Services Industry Revenue (Million) Forecast, by Application 2019 & 2032
- Table 26: Australia Well Testing Services Industry Revenue (Million) Forecast, by Application 2019 & 2032
- Table 27: Indonesia Well Testing Services Industry Revenue (Million) Forecast, by Application 2019 & 2032
- Table 28: Phillipes Well Testing Services Industry Revenue (Million) Forecast, by Application 2019 & 2032
- Table 29: Singapore Well Testing Services Industry Revenue (Million) Forecast, by Application 2019 & 2032
- Table 30: Thailandc Well Testing Services Industry Revenue (Million) Forecast, by Application 2019 & 2032
- Table 31: Rest of Asia Pacific Well Testing Services Industry Revenue (Million) Forecast, by Application 2019 & 2032
- Table 32: Global Well Testing Services Industry Revenue Million Forecast, by Country 2019 & 2032
- Table 33: Brazil Well Testing Services Industry Revenue (Million) Forecast, by Application 2019 & 2032
- Table 34: Argentina Well Testing Services Industry Revenue (Million) Forecast, by Application 2019 & 2032
- Table 35: Peru Well Testing Services Industry Revenue (Million) Forecast, by Application 2019 & 2032
- Table 36: Chile Well Testing Services Industry Revenue (Million) Forecast, by Application 2019 & 2032
- Table 37: Colombia Well Testing Services Industry Revenue (Million) Forecast, by Application 2019 & 2032
- Table 38: Ecuador Well Testing Services Industry Revenue (Million) Forecast, by Application 2019 & 2032
- Table 39: Venezuela Well Testing Services Industry Revenue (Million) Forecast, by Application 2019 & 2032
- Table 40: Rest of South America Well Testing Services Industry Revenue (Million) Forecast, by Application 2019 & 2032
- Table 41: Global Well Testing Services Industry Revenue Million Forecast, by Country 2019 & 2032
- Table 42: United Arab Emirates Well Testing Services Industry Revenue (Million) Forecast, by Application 2019 & 2032
- Table 43: Saudi Arabia Well Testing Services Industry Revenue (Million) Forecast, by Application 2019 & 2032
- Table 44: South Africa Well Testing Services Industry Revenue (Million) Forecast, by Application 2019 & 2032
- Table 45: Rest of Middle East and Africa Well Testing Services Industry Revenue (Million) Forecast, by Application 2019 & 2032
- Table 46: Global Well Testing Services Industry Revenue Million Forecast, by Stage 2019 & 2032
- Table 47: Global Well Testing Services Industry Revenue Million Forecast, by Location of Deployment 2019 & 2032
- Table 48: Global Well Testing Services Industry Revenue Million Forecast, by Country 2019 & 2032
- Table 49: Global Well Testing Services Industry Revenue Million Forecast, by Stage 2019 & 2032
- Table 50: Global Well Testing Services Industry Revenue Million Forecast, by Location of Deployment 2019 & 2032
- Table 51: Global Well Testing Services Industry Revenue Million Forecast, by Country 2019 & 2032
- Table 52: Global Well Testing Services Industry Revenue Million Forecast, by Stage 2019 & 2032
- Table 53: Global Well Testing Services Industry Revenue Million Forecast, by Location of Deployment 2019 & 2032
- Table 54: Global Well Testing Services Industry Revenue Million Forecast, by Country 2019 & 2032
- Table 55: Global Well Testing Services Industry Revenue Million Forecast, by Stage 2019 & 2032
- Table 56: Global Well Testing Services Industry Revenue Million Forecast, by Location of Deployment 2019 & 2032
- Table 57: Global Well Testing Services Industry Revenue Million Forecast, by Country 2019 & 2032
- Table 58: Global Well Testing Services Industry Revenue Million Forecast, by Stage 2019 & 2032
- Table 59: Global Well Testing Services Industry Revenue Million Forecast, by Location of Deployment 2019 & 2032
- Table 60: Global Well Testing Services Industry Revenue Million Forecast, by Country 2019 & 2032
Frequently Asked Questions
1. What is the projected Compound Annual Growth Rate (CAGR) of the Well Testing Services Industry?
The projected CAGR is approximately > 2.00%.
2. Which companies are prominent players in the Well Testing Services Industry?
Key companies in the market include CETCO Energy Services, SGS S A, PW Well Test Ltd, Weatherford International Plc, Expro Group, TETRA Technologies Inc, Baker Hughes Company, Halliburton Company, Schlumberger Limited, China Oilfield Secvices Limited.
3. What are the main segments of the Well Testing Services Industry?
The market segments include Stage, Location of Deployment.
4. Can you provide details about the market size?
The market size is estimated to be USD XX Million as of 2022.
5. What are some drivers contributing to market growth?
4.; Increasing Exploration in Offshore Areas4.; The Strengthening of Crude Oil Prices. Making the Upstream Activities Economically Feasible.
6. What are the notable trends driving market growth?
Onshore Segment to Dominate the Market.
7. Are there any restraints impacting market growth?
4.; Shifting to Renewable Energy Sources.
8. Can you provide examples of recent developments in the market?
N/A
9. What pricing options are available for accessing the report?
Pricing options include single-user, multi-user, and enterprise licenses priced at USD 4750, USD 5250, and USD 8750 respectively.
10. Is the market size provided in terms of value or volume?
The market size is provided in terms of value, measured in Million.
11. Are there any specific market keywords associated with the report?
Yes, the market keyword associated with the report is "Well Testing Services Industry," which aids in identifying and referencing the specific market segment covered.
12. How do I determine which pricing option suits my needs best?
The pricing options vary based on user requirements and access needs. Individual users may opt for single-user licenses, while businesses requiring broader access may choose multi-user or enterprise licenses for cost-effective access to the report.
13. Are there any additional resources or data provided in the Well Testing Services Industry report?
While the report offers comprehensive insights, it's advisable to review the specific contents or supplementary materials provided to ascertain if additional resources or data are available.
14. How can I stay updated on further developments or reports in the Well Testing Services Industry?
To stay informed about further developments, trends, and reports in the Well Testing Services Industry, consider subscribing to industry newsletters, following relevant companies and organizations, or regularly checking reputable industry news sources and publications.
Methodology
Step 1 - Identification of Relevant Samples Size from Population Database


Step 2 - Approaches for Defining Global Market Size (Value, Volume* & Price*)

Note*: In applicable scenarios
Step 3 - Data Sources
Primary Research
- Web Analytics
- Survey Reports
- Research Institute
- Latest Research Reports
- Opinion Leaders
Secondary Research
- Annual Reports
- White Paper
- Latest Press Release
- Industry Association
- Paid Database
- Investor Presentations

Step 4 - Data Triangulation
Involves using different sources of information in order to increase the validity of a study
These sources are likely to be stakeholders in a program - participants, other researchers, program staff, other community members, and so on.
Then we put all data in single framework & apply various statistical tools to find out the dynamic on the market.
During the analysis stage, feedback from the stakeholder groups would be compared to determine areas of agreement as well as areas of divergence


