

Key Insights
The Asia-Pacific (APAC) Open Systems Imaging market is poised for significant expansion, with a current market size estimated at 338.09 Million USD. This robust growth is projected to continue at a Compound Annual Growth Rate (CAGR) of 7.77%, indicating a dynamic and expanding industry. Key drivers fueling this upward trajectory include advancements in medical technology, increasing healthcare expenditure across the region, and a growing awareness of early disease detection and diagnosis. Specifically, the demand for open MRI systems is being propelled by their ability to provide greater patient comfort, particularly for those experiencing claustrophobia, and their suitability for a wider range of patient anatomies. This makes them an attractive alternative to traditional closed MRI systems in various clinical settings.
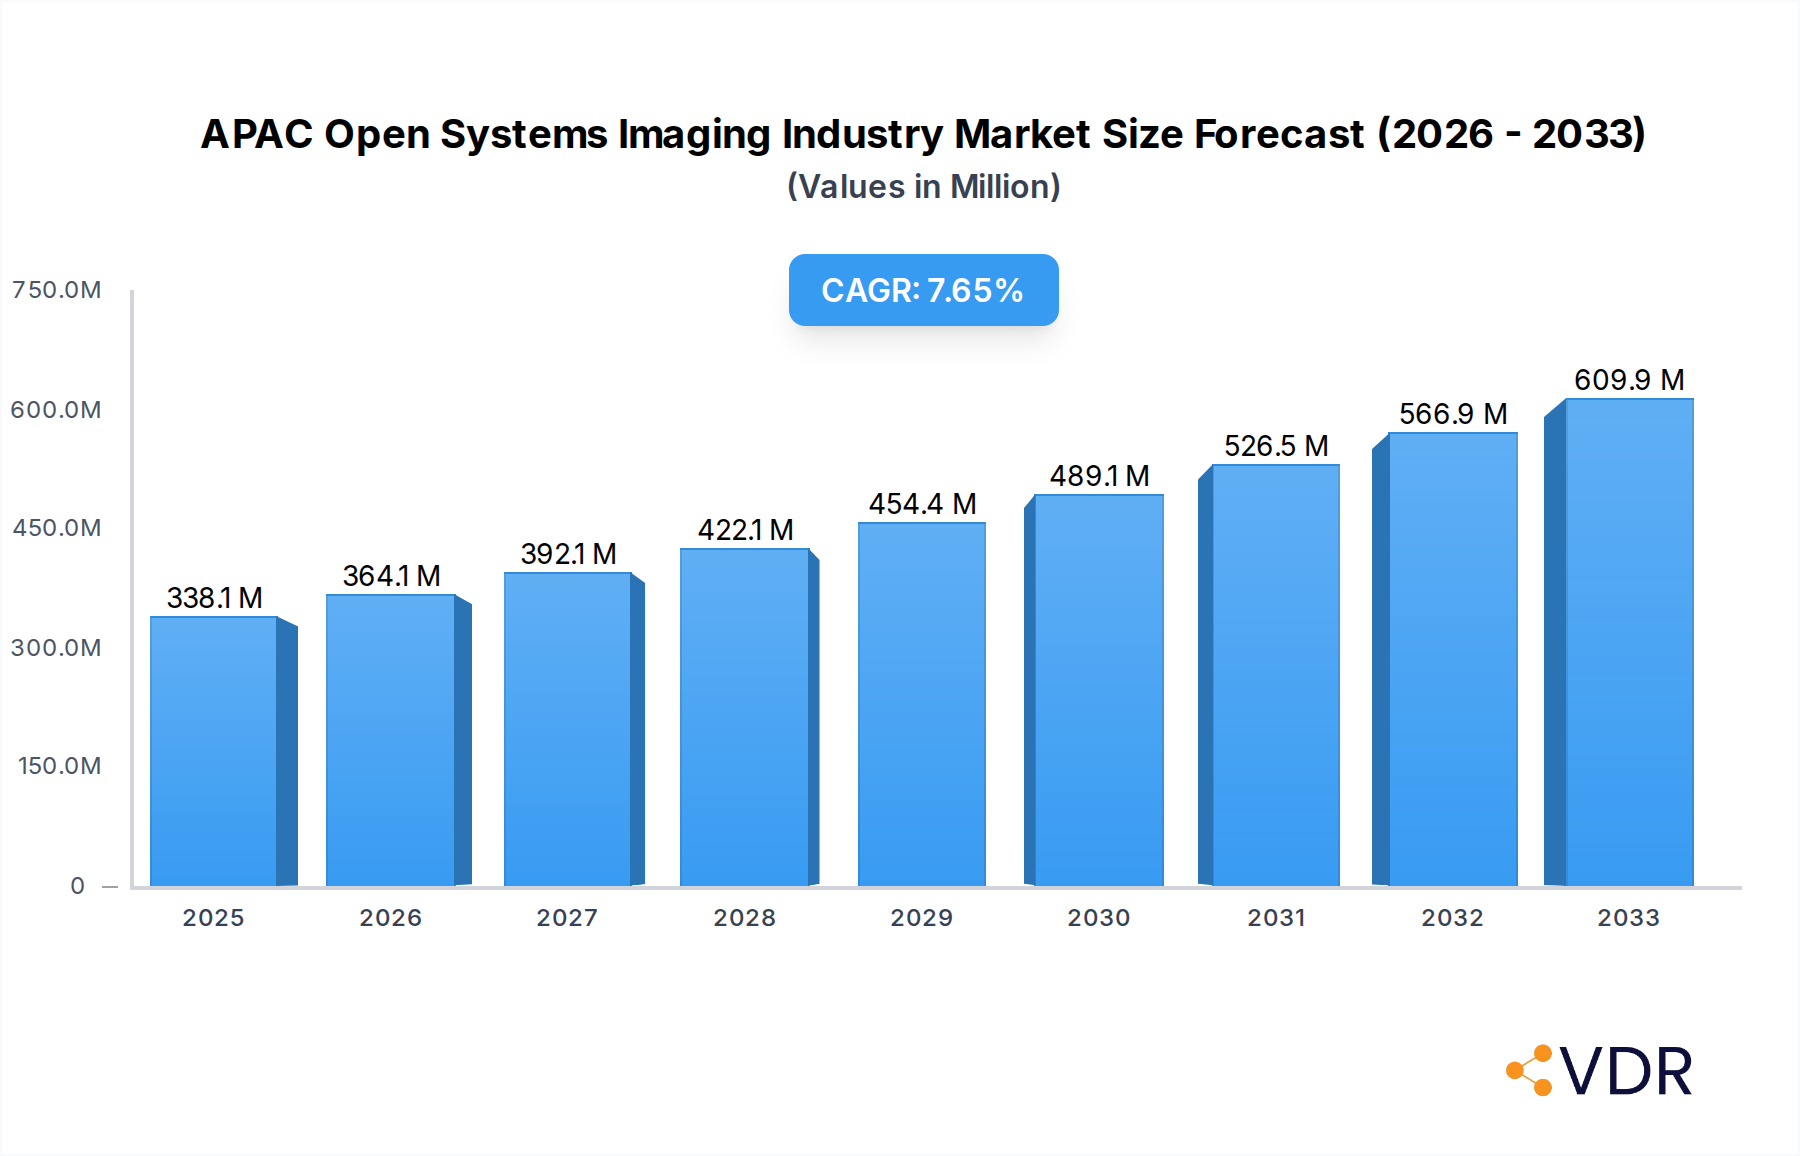
APAC Open Systems Imaging Industry Market Size (In Million)
The market segmentation reveals a balanced adoption across different resolution fields, with Mid-field scanners likely leading in terms of volume due to their favorable cost-effectiveness and clinical utility. Neurology and Oncology are anticipated to be the dominant application segments, reflecting the increasing prevalence of neurological disorders and cancer rates in the APAC region. Gastroenterology and Cardiology also represent significant growth areas, driven by lifestyle changes and aging populations. Geographically, China, Japan, and India are expected to be the frontrunners, owing to their large populations, developing healthcare infrastructures, and increased investment in advanced medical imaging technologies. Emerging economies within the Asia-Pacific region also present substantial untapped potential for open systems imaging solutions.

APAC Open Systems Imaging Industry Company Market Share
APAC Open Systems Imaging Industry: Comprehensive Market Analysis & Forecast (2019-2033)
This in-depth report offers a detailed examination of the APAC Open Systems Imaging Industry, providing critical insights into market dynamics, growth trajectories, and competitive landscapes. Covering a study period from 2019 to 2033, with a base and estimated year of 2025 and a forecast period from 2025 to 2033, this analysis is crucial for stakeholders seeking to understand and capitalize on the burgeoning opportunities within this vital sector. We present all unit values in Millions.
APAC Open Systems Imaging Industry Market Dynamics & Structure
The APAC Open Systems Imaging Industry is characterized by a moderately concentrated market, with key players like Siemens Healthcare, Philips Healthcare, and Canon Medical Systems Corporation holding significant influence. Technological innovation is a primary driver, fueled by continuous advancements in magnet technology, gradient systems, and advanced imaging software, enabling higher resolution and faster scan times. Regulatory frameworks, while evolving, generally support the adoption of advanced medical imaging technologies across the region, particularly in countries with established healthcare infrastructure. Competitive product substitutes are emerging, especially from companies developing more affordable, lower-field open MRI systems, challenging the dominance of high-field options in certain applications. End-user demographics are shifting towards an aging population and a growing middle class with increased disposable income, leading to a higher demand for advanced diagnostic imaging services. Mergers and acquisitions (M&A) trends are present, though less pronounced than in other mature markets, indicating a strategic consolidation of market presence and technological capabilities. For instance, the market share of the top 3 players is estimated to be around 65% in 2025. Barriers to innovation include the high cost of R&D for advanced imaging modalities and the need for specialized training for medical professionals to operate and interpret results from these complex systems.
- Market Concentration: Moderate, with a few dominant global players and a growing number of regional manufacturers.
- Technological Innovation Drivers: Enhanced image quality, reduced scan times, improved patient comfort, AI integration for image analysis, and development of specialized open MRI coils.
- Regulatory Frameworks: Generally supportive, with varying degrees of stringency across countries, focusing on safety, efficacy, and data privacy.
- Competitive Product Substitutes: Advancements in other imaging modalities like CT and Ultrasound, alongside development of more portable and cost-effective open MRI solutions.
- End-User Demographics: Aging population, rising prevalence of chronic diseases, increasing healthcare expenditure, and growing patient awareness regarding early diagnosis.
- M&A Trends: Strategic acquisitions aimed at expanding product portfolios, geographical reach, and technological capabilities. For example, there were approximately 5 significant M&A deals in the last 3 years.
APAC Open Systems Imaging Industry Growth Trends & Insights
The APAC Open Systems Imaging Industry is poised for robust growth, projected to expand at a Compound Annual Growth Rate (CAGR) of approximately 7.8% from 2025 to 2033. This expansion is underpinned by a confluence of factors, including the rapidly increasing healthcare expenditure across the region, a growing elderly population that necessitates more frequent and advanced diagnostic imaging, and a rising prevalence of chronic diseases such as neurological disorders, cardiovascular conditions, and oncological issues. The adoption rates of open MRI systems are steadily climbing, driven by their superior patient comfort, reduced claustrophobia, and suitability for a wider range of patients, including pediatric and anxious individuals. Technological disruptions are playing a significant role, with the integration of artificial intelligence (AI) into imaging workflows, improving diagnostic accuracy and operational efficiency. Furthermore, the development of higher field strength open MRI systems is broadening their clinical applications, moving beyond traditional musculoskeletal imaging. Consumer behavior shifts are also contributing to market growth, with a greater emphasis on preventative healthcare and early disease detection, prompting individuals and healthcare providers to invest in advanced imaging solutions. The market penetration of open MRI systems, while still lower than that of closed bore systems in some segments, is experiencing a significant uptick, particularly in emerging economies within the APAC region. Market size is estimated to reach approximately USD 4,500 Million units by 2033. The increasing investment in healthcare infrastructure by governments and private entities further bolsters the growth prospects. The demand for low-field scanners for basic diagnostics and patient comfort will remain substantial, while mid-field and high-field scanners will cater to specialized and advanced diagnostic needs.
Dominant Regions, Countries, or Segments in APAC Open Systems Imaging Industry
China stands out as the dominant country within the APAC Open Systems Imaging Industry, driven by its massive population, escalating healthcare investments, and a rapidly expanding medical infrastructure. The Chinese government's commitment to improving healthcare accessibility and quality has led to substantial growth in the demand for advanced diagnostic imaging equipment, including open MRI systems. This dominance is further amplified by the country's large domestic market, which attracts significant investment from both local and international manufacturers. Japan follows as another key market, characterized by its advanced healthcare system, aging population, and high adoption rate of cutting-edge medical technologies. The country's emphasis on research and development also contributes to the presence of sophisticated imaging solutions. India presents a rapidly growing segment, fueled by increasing healthcare spending, a rising middle class, and a growing awareness of the benefits of early disease detection. The Indian market is particularly receptive to cost-effective solutions, making mid-field and low-field open MRI systems attractive. South Korea's market is driven by its technologically advanced healthcare sector and a focus on specialized imaging applications.
In terms of Segments, the Neurology application is a significant growth driver, with the increasing incidence of stroke, Alzheimer's disease, and other neurological conditions necessitating advanced diagnostic capabilities. Open MRI systems offer advantages in imaging patients with metallic implants or those prone to anxiety, making them ideal for neurological assessments. Cardiology is another crucial segment, where open MRI is increasingly used for cardiac functional imaging, myocardial perfusion studies, and valve assessments, especially in patients who cannot tolerate closed bore scanners. The Oncology segment also shows strong potential, with open MRI systems aiding in tumor localization, staging, and monitoring treatment response. The Mid-field Scanner segment is expected to witness substantial growth, offering a balance between image quality and cost-effectiveness, thus appealing to a broader range of healthcare facilities. However, Low-Field Scanners will continue to hold a considerable share due to their accessibility and suitability for basic diagnostic needs and patient comfort.
- Dominant Country Drivers (China): Massive population, government healthcare initiatives, increasing private sector investment, expansion of medical facilities, and growing patient demand for advanced diagnostics. Estimated market share for China in 2025: 40%.
- Key Growth Drivers (Japan): Advanced healthcare infrastructure, aging population, high R&D investment, and strong adoption of novel medical technologies.
- Emerging Market Dynamics (India): Rapidly growing healthcare expenditure, rising disposable incomes, increasing chronic disease prevalence, and demand for affordable imaging solutions.
- Segment Dominance (Neurology & Cardiology): High prevalence of neurological disorders and cardiovascular diseases, coupled with the advantages of open MRI for specific patient populations.
- Segment Growth (Mid-field Scanners): Favorable balance of performance and cost, expanding clinical utility across various applications.
APAC Open Systems Imaging Industry Product Landscape
The APAC Open Systems Imaging Industry is witnessing a surge in product innovations focused on enhancing patient experience and diagnostic efficacy. Manufacturers are introducing Open MRI systems with wider apertures, quieter operation, and advanced patient positioning systems to alleviate claustrophobia and anxiety. Innovations in gradient coil technology are leading to faster scan times and higher spatial resolution, crucial for detailed anatomical visualization. Furthermore, the integration of AI-powered image reconstruction and analysis software is a significant advancement, enabling faster diagnoses and improved interpretation of complex scans. The development of compact and more affordable low-field open MRI systems is expanding access to advanced imaging in underserved regions. Performance metrics are steadily improving, with resolutions approaching those of some closed-bore systems, making open MRI a viable option for an increasing array of clinical applications beyond musculoskeletal imaging, including neurology, cardiology, and oncology.
Key Drivers, Barriers & Challenges in APAC Open Systems Imaging Industry
Key Drivers:
- Growing Prevalence of Chronic Diseases: The rising incidence of neurological disorders, cardiovascular diseases, and cancer necessitates advanced diagnostic imaging.
- Aging Population: An increasing elderly demographic drives demand for medical imaging services, particularly for conditions prevalent in older age groups.
- Technological Advancements: Continuous innovation in MRI technology, including higher field strengths, faster scanning, and AI integration, enhances diagnostic capabilities.
- Government Initiatives & Healthcare Investment: Increased public and private spending on healthcare infrastructure and medical equipment in APAC countries.
- Patient Comfort and Accessibility: Open MRI systems address patient anxiety and claustrophobia, expanding access to imaging for a wider patient population.
Barriers & Challenges:
- High Initial Investment Costs: Despite advancements, open MRI systems can still represent a significant capital expenditure for healthcare facilities.
- Image Quality Limitations (vs. High-Field Closed MRI): In certain specialized applications, high-field closed MRI systems may still offer superior image resolution and speed.
- Stringent Regulatory Approvals: Navigating diverse regulatory requirements across different APAC countries can be complex and time-consuming.
- Skilled Workforce Shortage: A lack of trained radiographers and radiologists to operate and interpret advanced MRI scans in some regions.
- Competition from Other Imaging Modalities: Advancements in CT, Ultrasound, and PET scans offer alternative diagnostic options.
Emerging Opportunities in APAC Open Systems Imaging Industry
Emerging opportunities lie in developing more compact and portable open MRI systems for point-of-care diagnostics and remote healthcare delivery. The integration of advanced AI for automated image analysis and diagnostic assistance presents a significant avenue for growth, improving efficiency and accuracy. Furthermore, the untapped potential in emerging economies within the APAC region, such as Southeast Asia and parts of South Asia, offers substantial growth prospects as healthcare infrastructure development accelerates. Focusing on specialized open MRI applications for pediatric imaging, interventional radiology, and functional MRI is another promising area. Evolving consumer preferences towards minimally invasive and patient-friendly diagnostic procedures will continue to fuel the demand for open MRI solutions.
Growth Accelerators in the APAC Open Systems Imaging Industry Industry
Growth in the APAC Open Systems Imaging Industry will be significantly accelerated by breakthroughs in superconducting magnet technology, leading to more powerful and cost-effective open MRI systems. Strategic partnerships between imaging equipment manufacturers and AI development companies will drive the integration of sophisticated diagnostic software, enhancing clinical utility. Market expansion strategies targeting emerging economies, coupled with localized manufacturing and service networks, will further propel adoption rates. The development of hybrid imaging systems that integrate open MRI with other modalities will also create new market segments and opportunities.
Key Players Shaping the APAC Open Systems Imaging Industry Market
- ESAOTE SA
- Siemens Healthcare
- SHENZHEN BASDA MEDICAL APPARATUS CO LTD
- Philips Healthcare
- Mindray
- Hitachi Medical Corporation
- Canon Medical Systems Corporation
Notable Milestones in APAC Open Systems Imaging Industry Sector
- 2020: Launch of next-generation low-field open MRI systems with enhanced image quality and patient comfort features by major manufacturers.
- 2021: Increased investment in R&D for AI integration in MRI image analysis, leading to pilot programs in leading hospitals.
- 2022: Strategic collaborations between global imaging giants and regional distributors to expand market reach in Southeast Asia and India.
- 2023: Introduction of more compact and mobile open MRI solutions targeting smaller clinics and remote healthcare facilities.
- 2024: Significant advancements in gradient coil technology leading to faster scan times and improved spatial resolution in mid-field open MRI systems.
In-Depth APAC Open Systems Imaging Industry Market Outlook
The APAC Open Systems Imaging Industry is set for sustained and robust growth, driven by a compelling combination of demographic shifts, technological advancements, and increasing healthcare investments. The expanding middle class and aging populations across the region are fueling demand for advanced diagnostic imaging. Innovations in AI and magnet technology are making open MRI systems more accessible, efficient, and clinically versatile. Strategic partnerships and focused market penetration in emerging economies will act as significant growth accelerators, unlocking immense potential for the industry. Stakeholders are advised to focus on developing cost-effective solutions, enhancing AI integration, and expanding their presence in underserved markets to capitalize on the future trajectory of this dynamic industry.
APAC Open Systems Imaging Industry Segmentation
-
1. Resolution
- 1.1. Low- Field Scanner
- 1.2. Mid-field Scanner
- 1.3. High-Field Scanner
-
2. Application
- 2.1. Neurology
- 2.2. Gastroenterology
- 2.3. Cardiology
- 2.4. Oncology
- 2.5. Others
-
3. Geography
-
3.1. Asia-Pacific
- 3.1.1. China
- 3.1.2. Japan
- 3.1.3. India
- 3.1.4. Australia
- 3.1.5. South Korea
- 3.1.6. Rest of Asia-Pacific
-
3.1. Asia-Pacific
APAC Open Systems Imaging Industry Segmentation By Geography
-
1. Asia Pacific
- 1.1. China
- 1.2. Japan
- 1.3. India
- 1.4. Australia
- 1.5. South Korea
- 1.6. Rest of Asia Pacific
APAC Open Systems Imaging Industry Regional Market Share
Geographic Coverage of APAC Open Systems Imaging Industry
APAC Open Systems Imaging Industry REPORT HIGHLIGHTS
| Aspects | Details |
|---|---|
| Study Period | 2020-2034 |
| Base Year | 2025 |
| Estimated Year | 2026 |
| Forecast Period | 2026-2034 |
| Historical Period | 2020-2025 |
| Growth Rate | CAGR of 7.77% from 2020-2034 |
| Segmentation |
|
Table of Contents
- 1. Introduction
- 1.1. Research Scope
- 1.2. Market Segmentation
- 1.3. Research Objective
- 1.4. Definitions and Assumptions
- 2. Executive Summary
- 2.1. Market Snapshot
- 3. Market Dynamics
- 3.1. Market Drivers
- 3.2. Market Restrains
- 3.3. Market Trends
- 3.4. Market Opportunities
- 4. Market Factor Analysis
- 4.1. Porters Five Forces
- 4.1.1. Bargaining Power of Suppliers
- 4.1.2. Bargaining Power of Buyers
- 4.1.3. Threat of New Entrants
- 4.1.4. Threat of Substitutes
- 4.1.5. Competitive Rivalry
- 4.2. PESTEL analysis
- 4.3. BCG Analysis
- 4.3.1. Stars (High Growth, High Market Share)
- 4.3.2. Cash Cows (Low Growth, High Market Share)
- 4.3.3. Question Mark (High Growth, Low Market Share)
- 4.3.4. Dogs (Low Growth, Low Market Share)
- 4.4. Ansoff Matrix Analysis
- 4.5. Supply Chain Analysis
- 4.6. Regulatory Landscape
- 4.7. Current Market Potential and Opportunity Assessment (TAM–SAM–SOM Framework)
- 4.8. VDR Analyst Note
- 4.1. Porters Five Forces
- 5. Market Analysis, Insights and Forecast 2021-2033
- 5.1. Market Analysis, Insights and Forecast - by Resolution
- 5.1.1. Low- Field Scanner
- 5.1.2. Mid-field Scanner
- 5.1.3. High-Field Scanner
- 5.2. Market Analysis, Insights and Forecast - by Application
- 5.2.1. Neurology
- 5.2.2. Gastroenterology
- 5.2.3. Cardiology
- 5.2.4. Oncology
- 5.2.5. Others
- 5.3. Market Analysis, Insights and Forecast - by Geography
- 5.3.1. Asia-Pacific
- 5.3.1.1. China
- 5.3.1.2. Japan
- 5.3.1.3. India
- 5.3.1.4. Australia
- 5.3.1.5. South Korea
- 5.3.1.6. Rest of Asia-Pacific
- 5.3.1. Asia-Pacific
- 5.4. Market Analysis, Insights and Forecast - by Region
- 5.4.1. Asia Pacific
- 5.1. Market Analysis, Insights and Forecast - by Resolution
- 6. Global APAC Open Systems Imaging Industry Analysis, Insights and Forecast, 2021-2033
- 6.1. Market Analysis, Insights and Forecast - by Resolution
- 6.1.1. Low- Field Scanner
- 6.1.2. Mid-field Scanner
- 6.1.3. High-Field Scanner
- 6.2. Market Analysis, Insights and Forecast - by Application
- 6.2.1. Neurology
- 6.2.2. Gastroenterology
- 6.2.3. Cardiology
- 6.2.4. Oncology
- 6.2.5. Others
- 6.3. Market Analysis, Insights and Forecast - by Geography
- 6.3.1. Asia-Pacific
- 6.3.1.1. China
- 6.3.1.2. Japan
- 6.3.1.3. India
- 6.3.1.4. Australia
- 6.3.1.5. South Korea
- 6.3.1.6. Rest of Asia-Pacific
- 6.3.1. Asia-Pacific
- 6.1. Market Analysis, Insights and Forecast - by Resolution
- 7. Competitive Analysis
- 7.1. Company Profiles
- 7.1.1 ESAOTE SA
- 7.1.1.1. Company Overview
- 7.1.1.2. Products
- 7.1.1.3. Company Financials
- 7.1.1.4. SWOT Analysis
- 7.1.2 Siemens Healthcare
- 7.1.2.1. Company Overview
- 7.1.2.2. Products
- 7.1.2.3. Company Financials
- 7.1.2.4. SWOT Analysis
- 7.1.3 SHENZHEN BASDA MEDICAL APPARATUS CO LTD
- 7.1.3.1. Company Overview
- 7.1.3.2. Products
- 7.1.3.3. Company Financials
- 7.1.3.4. SWOT Analysis
- 7.1.4 Philips Healthcare
- 7.1.4.1. Company Overview
- 7.1.4.2. Products
- 7.1.4.3. Company Financials
- 7.1.4.4. SWOT Analysis
- 7.1.5 Mindray
- 7.1.5.1. Company Overview
- 7.1.5.2. Products
- 7.1.5.3. Company Financials
- 7.1.5.4. SWOT Analysis
- 7.1.6 Hitachi Medical Corporation
- 7.1.6.1. Company Overview
- 7.1.6.2. Products
- 7.1.6.3. Company Financials
- 7.1.6.4. SWOT Analysis
- 7.1.7 Canon Medical Systems Corporation
- 7.1.7.1. Company Overview
- 7.1.7.2. Products
- 7.1.7.3. Company Financials
- 7.1.7.4. SWOT Analysis
- 7.1.1 ESAOTE SA
- 7.2. Market Entropy
- 7.2.1 Company's Key Areas Served
- 7.2.2 Recent Developments
- 7.3. Company Market Share Analysis 2025
- 7.3.1 Top 5 Companies Market Share Analysis
- 7.3.2 Top 3 Companies Market Share Analysis
- 7.4. List of Potential Customers
- 8. Research Methodology
List of Figures
- Figure 1: Global APAC Open Systems Imaging Industry Revenue Breakdown (Million, %) by Region 2025 & 2033
- Figure 2: Global APAC Open Systems Imaging Industry Volume Breakdown (K Unit, %) by Region 2025 & 2033
- Figure 3: Asia Pacific APAC Open Systems Imaging Industry Revenue (Million), by Resolution 2025 & 2033
- Figure 4: Asia Pacific APAC Open Systems Imaging Industry Volume (K Unit), by Resolution 2025 & 2033
- Figure 5: Asia Pacific APAC Open Systems Imaging Industry Revenue Share (%), by Resolution 2025 & 2033
- Figure 6: Asia Pacific APAC Open Systems Imaging Industry Volume Share (%), by Resolution 2025 & 2033
- Figure 7: Asia Pacific APAC Open Systems Imaging Industry Revenue (Million), by Application 2025 & 2033
- Figure 8: Asia Pacific APAC Open Systems Imaging Industry Volume (K Unit), by Application 2025 & 2033
- Figure 9: Asia Pacific APAC Open Systems Imaging Industry Revenue Share (%), by Application 2025 & 2033
- Figure 10: Asia Pacific APAC Open Systems Imaging Industry Volume Share (%), by Application 2025 & 2033
- Figure 11: Asia Pacific APAC Open Systems Imaging Industry Revenue (Million), by Geography 2025 & 2033
- Figure 12: Asia Pacific APAC Open Systems Imaging Industry Volume (K Unit), by Geography 2025 & 2033
- Figure 13: Asia Pacific APAC Open Systems Imaging Industry Revenue Share (%), by Geography 2025 & 2033
- Figure 14: Asia Pacific APAC Open Systems Imaging Industry Volume Share (%), by Geography 2025 & 2033
- Figure 15: Asia Pacific APAC Open Systems Imaging Industry Revenue (Million), by Country 2025 & 2033
- Figure 16: Asia Pacific APAC Open Systems Imaging Industry Volume (K Unit), by Country 2025 & 2033
- Figure 17: Asia Pacific APAC Open Systems Imaging Industry Revenue Share (%), by Country 2025 & 2033
- Figure 18: Asia Pacific APAC Open Systems Imaging Industry Volume Share (%), by Country 2025 & 2033
List of Tables
- Table 1: Global APAC Open Systems Imaging Industry Revenue Million Forecast, by Resolution 2020 & 2033
- Table 2: Global APAC Open Systems Imaging Industry Volume K Unit Forecast, by Resolution 2020 & 2033
- Table 3: Global APAC Open Systems Imaging Industry Revenue Million Forecast, by Application 2020 & 2033
- Table 4: Global APAC Open Systems Imaging Industry Volume K Unit Forecast, by Application 2020 & 2033
- Table 5: Global APAC Open Systems Imaging Industry Revenue Million Forecast, by Geography 2020 & 2033
- Table 6: Global APAC Open Systems Imaging Industry Volume K Unit Forecast, by Geography 2020 & 2033
- Table 7: Global APAC Open Systems Imaging Industry Revenue Million Forecast, by Region 2020 & 2033
- Table 8: Global APAC Open Systems Imaging Industry Volume K Unit Forecast, by Region 2020 & 2033
- Table 9: Global APAC Open Systems Imaging Industry Revenue Million Forecast, by Resolution 2020 & 2033
- Table 10: Global APAC Open Systems Imaging Industry Volume K Unit Forecast, by Resolution 2020 & 2033
- Table 11: Global APAC Open Systems Imaging Industry Revenue Million Forecast, by Application 2020 & 2033
- Table 12: Global APAC Open Systems Imaging Industry Volume K Unit Forecast, by Application 2020 & 2033
- Table 13: Global APAC Open Systems Imaging Industry Revenue Million Forecast, by Geography 2020 & 2033
- Table 14: Global APAC Open Systems Imaging Industry Volume K Unit Forecast, by Geography 2020 & 2033
- Table 15: Global APAC Open Systems Imaging Industry Revenue Million Forecast, by Country 2020 & 2033
- Table 16: Global APAC Open Systems Imaging Industry Volume K Unit Forecast, by Country 2020 & 2033
- Table 17: China APAC Open Systems Imaging Industry Revenue (Million) Forecast, by Application 2020 & 2033
- Table 18: China APAC Open Systems Imaging Industry Volume (K Unit) Forecast, by Application 2020 & 2033
- Table 19: Japan APAC Open Systems Imaging Industry Revenue (Million) Forecast, by Application 2020 & 2033
- Table 20: Japan APAC Open Systems Imaging Industry Volume (K Unit) Forecast, by Application 2020 & 2033
- Table 21: India APAC Open Systems Imaging Industry Revenue (Million) Forecast, by Application 2020 & 2033
- Table 22: India APAC Open Systems Imaging Industry Volume (K Unit) Forecast, by Application 2020 & 2033
- Table 23: Australia APAC Open Systems Imaging Industry Revenue (Million) Forecast, by Application 2020 & 2033
- Table 24: Australia APAC Open Systems Imaging Industry Volume (K Unit) Forecast, by Application 2020 & 2033
- Table 25: South Korea APAC Open Systems Imaging Industry Revenue (Million) Forecast, by Application 2020 & 2033
- Table 26: South Korea APAC Open Systems Imaging Industry Volume (K Unit) Forecast, by Application 2020 & 2033
- Table 27: Rest of Asia Pacific APAC Open Systems Imaging Industry Revenue (Million) Forecast, by Application 2020 & 2033
- Table 28: Rest of Asia Pacific APAC Open Systems Imaging Industry Volume (K Unit) Forecast, by Application 2020 & 2033
Frequently Asked Questions
1. What is the projected Compound Annual Growth Rate (CAGR) of the APAC Open Systems Imaging Industry?
The projected CAGR is approximately 7.77%.
2. Which companies are prominent players in the APAC Open Systems Imaging Industry?
Key companies in the market include ESAOTE SA, Siemens Healthcare, SHENZHEN BASDA MEDICAL APPARATUS CO LTD, Philips Healthcare, Mindray, Hitachi Medical Corporation, Canon Medical Systems Corporation.
3. What are the main segments of the APAC Open Systems Imaging Industry?
The market segments include Resolution, Application, Geography.
4. Can you provide details about the market size?
The market size is estimated to be USD 338.09 Million as of 2022.
5. What are some drivers contributing to market growth?
; Increasing Number of MRI Procedures; Increasing Applications in Clinical Diagnosis and Increasing Disease Burden.
6. What are the notable trends driving market growth?
Application in Neurology is Expected to Dominate the Asia Pacific Open System MRI Market.
7. Are there any restraints impacting market growth?
; High Cost of Open MRI Systems.
8. Can you provide examples of recent developments in the market?
N/A
9. What pricing options are available for accessing the report?
Pricing options include single-user, multi-user, and enterprise licenses priced at USD 4750, USD 5250, and USD 8750 respectively.
10. Is the market size provided in terms of value or volume?
The market size is provided in terms of value, measured in Million and volume, measured in K Unit.
11. Are there any specific market keywords associated with the report?
Yes, the market keyword associated with the report is "APAC Open Systems Imaging Industry," which aids in identifying and referencing the specific market segment covered.
12. How do I determine which pricing option suits my needs best?
The pricing options vary based on user requirements and access needs. Individual users may opt for single-user licenses, while businesses requiring broader access may choose multi-user or enterprise licenses for cost-effective access to the report.
13. Are there any additional resources or data provided in the APAC Open Systems Imaging Industry report?
While the report offers comprehensive insights, it's advisable to review the specific contents or supplementary materials provided to ascertain if additional resources or data are available.
14. How can I stay updated on further developments or reports in the APAC Open Systems Imaging Industry?
To stay informed about further developments, trends, and reports in the APAC Open Systems Imaging Industry, consider subscribing to industry newsletters, following relevant companies and organizations, or regularly checking reputable industry news sources and publications.
Methodology
Step 1 - Identification of Relevant Samples Size from Population Database


Step 2 - Approaches for Defining Global Market Size (Value, Volume* & Price*)

Note*: In applicable scenarios
Step 3 - Data Sources
Primary Research
- Web Analytics
- Survey Reports
- Research Institute
- Latest Research Reports
- Opinion Leaders
Secondary Research
- Annual Reports
- White Paper
- Latest Press Release
- Industry Association
- Paid Database
- Investor Presentations

Step 4 - Data Triangulation
Involves using different sources of information in order to increase the validity of a study
These sources are likely to be stakeholders in a program - participants, other researchers, program staff, other community members, and so on.
Then we put all data in single framework & apply various statistical tools to find out the dynamic on the market.
During the analysis stage, feedback from the stakeholder groups would be compared to determine areas of agreement as well as areas of divergence