

Key Insights
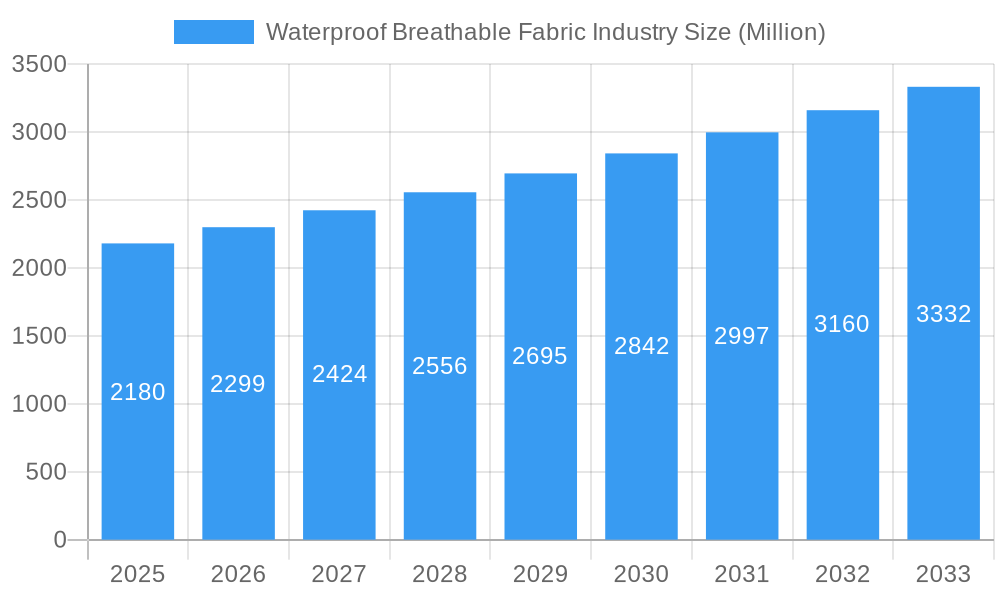
The waterproof breathable fabric market, valued at $2.18 billion in 2025, is projected to experience robust growth, exceeding a 5% compound annual growth rate (CAGR) through 2033. This expansion is driven by several key factors. The increasing popularity of outdoor activities like hiking, camping, and skiing fuels demand for high-performance apparel and gear incorporating these fabrics. Simultaneously, advancements in material science are leading to lighter, more durable, and more breathable fabrics, enhancing comfort and functionality. The growing awareness of sustainable and eco-friendly manufacturing practices is also impacting the market, with brands focusing on reducing their environmental footprint through innovative materials and production processes. Furthermore, technological improvements in waterproofing and breathability are driving innovation within the industry, leading to higher-performing products that cater to diverse consumer needs across various price points.
Waterproof Breathable Fabric Industry Market Size (In Billion)
The market's segmentation encompasses various fabric types, each with its unique properties and applications. Leading brands like Gore-Tex, Polartec, and Sympatex are heavily invested in research and development, pushing the boundaries of fabric performance. The competitive landscape is dynamic, with established players facing increasing pressure from smaller, innovative companies offering specialized and niche products. Geographic distribution shows strong demand in North America and Europe, reflecting the high participation rates in outdoor activities and a higher disposable income in these regions. However, emerging markets in Asia-Pacific are expected to exhibit significant growth potential in the coming years, driven by rising middle-class incomes and increasing awareness of outdoor recreation. This necessitates strategic expansion and targeted marketing initiatives for companies operating in this sector.
Waterproof Breathable Fabric Industry Company Market Share
Waterproof Breathable Fabric Industry Market Report: 2019-2033
This comprehensive report provides a detailed analysis of the Waterproof Breathable Fabric industry, encompassing market dynamics, growth trends, regional dominance, product landscape, key players, and future outlook. With a study period spanning 2019-2033, a base year of 2025, and a forecast period of 2025-2033, this report offers invaluable insights for industry professionals, investors, and strategic decision-makers. The report leverages extensive data analysis to provide a clear picture of the market's current state and its projected trajectory, including detailed breakdowns by segment and region. The total market size is projected to reach xx Million units by 2033.
Waterproof Breathable Fabric Industry Market Dynamics & Structure
The waterproof breathable fabric (WPB) market is characterized by a dynamic interplay of moderate concentration and intense innovation. While a few key players command significant market share, the landscape is continuously reshaped by technological advancements in membrane engineering and material science. A pivotal trend is the escalating global focus on environmental sustainability, with stringent regulations surrounding Per- and Polyfluoroalkyl Substances (PFAS), commonly known as PFCs, compelling manufacturers to pivot towards eco-friendly alternatives and sustainable production methodologies. Despite the competitive pressure from simpler coated fabrics, the superior performance benefits of WPB fabrics, particularly in terms of breathability and user comfort, ensure sustained demand. The end-user spectrum is exceptionally broad, encompassing critical segments such as high-performance outdoor apparel, athletic sportswear, and protective workwear. Mergers and acquisitions (M&A) activity has been measured, with a greater emphasis placed on strategic partnerships and collaborative ventures to expand market reach, foster technological development, and enhance supply chain resilience.
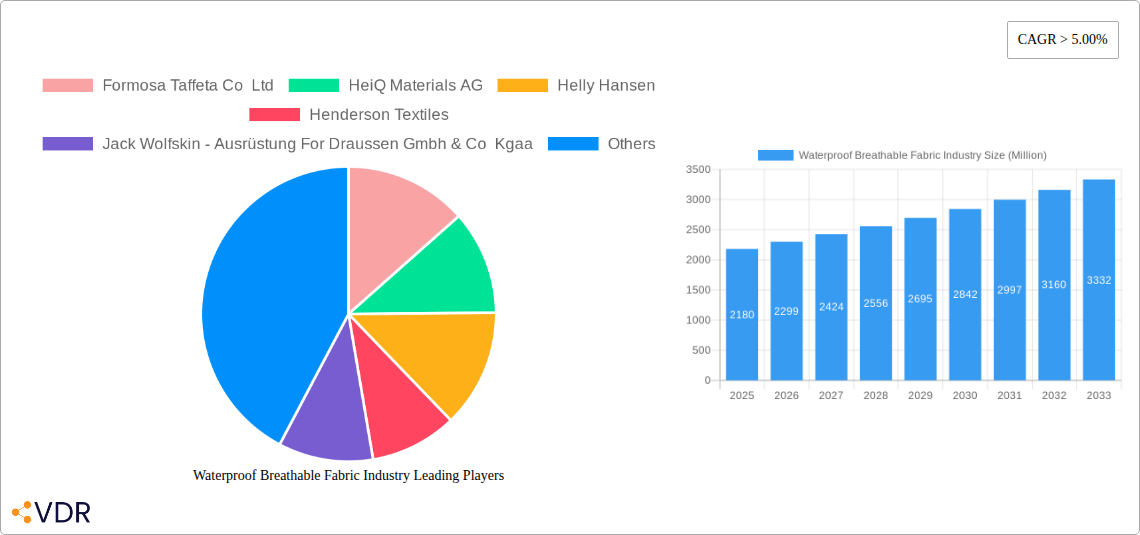
- Market Concentration: The market exhibits moderate concentration, with the top 5 players estimated to hold approximately 45-55% of the global market share in 2024, reflecting a balance between established giants and emerging innovators.
- Technological Innovation Drivers: Key drivers include ongoing advancements in proprietary membrane technologies (such as expanded Polytetrafluoroethylene - ePTFE, and Polyurethane - PU), a robust commitment to developing high-performance PFAS-free alternatives, and continuous efforts to elevate breathability without compromising water resistance.
- Regulatory Frameworks: A significant and growing emphasis on sustainable manufacturing practices and increasingly stringent chemical regulations globally are actively shaping material choices and pushing for greater transparency in the supply chain.
- Competitive Product Substitutes: While coated fabrics offer a more budget-friendly alternative, they often fall short in breathability and long-term comfort. WPB fabrics maintain a distinct advantage in demanding applications where moisture management and user comfort are paramount.
- End-User Demographics: The demand is diversified across key sectors: Outdoor Apparel (estimated at 40-45%), Sportswear (estimated at 25-30%), Workwear (estimated at 15-20%), and other niche applications (estimated at 5-10%).
- M&A Trends: M&A activity remains moderate, with a discernible trend towards strategic partnerships, joint ventures, and licensing agreements being more prevalent for market penetration and technology acquisition. Approximately 8-12 significant M&A deals and over 20 strategic partnerships were recorded within the industry between 2019 and 2024.
Waterproof Breathable Fabric Industry Growth Trends & Insights
The waterproof breathable fabric market exhibited strong growth during the historical period (2019-2024), driven by increasing consumer demand for high-performance outdoor and athletic apparel. The market size experienced a CAGR of xx% during this period, reaching xx Million units in 2024. Adoption rates are high in developed regions but are steadily growing in emerging markets. Technological disruptions, such as the introduction of innovative membrane technologies and sustainable materials, are fueling market expansion. Changing consumer preferences towards more environmentally friendly and ethically sourced products are also significantly impacting growth. The forecast period (2025-2033) anticipates continued market growth, driven by factors such as increasing disposable incomes, rising participation in outdoor activities, and the launch of new, high-performance fabrics.
Dominant Regions, Countries, or Segments in Waterproof Breathable Fabric Industry
North America and Europe currently dominate the waterproof breathable fabric market, driven by strong consumer demand and established manufacturing bases. These regions account for xx% of the global market share. Asia-Pacific is experiencing rapid growth, propelled by increasing disposable incomes, a burgeoning middle class, and a growing outdoor apparel market. The outdoor apparel segment is the largest contributor to market growth, followed by sportswear and workwear.
- Key Drivers in North America: High consumer spending on outdoor and athletic apparel, strong presence of major brands.
- Key Drivers in Europe: Established outdoor and sportswear culture, presence of innovative fabric manufacturers.
- Key Drivers in Asia-Pacific: Rapid economic growth, expanding middle class, increased participation in outdoor activities.
- Segment Dominance: Outdoor apparel (xx% market share), sportswear (xx%), workwear (xx%).
Waterproof Breathable Fabric Industry Product Landscape
The waterproof breathable fabric (WPB) market boasts a rich and diverse product portfolio, meticulously engineered to meet a spectrum of performance requirements. These fabrics are distinguished by their meticulously balanced levels of water resistance, breathability, and inherent durability. Continuous innovation within the sector is sharply focused on optimizing the synergy between enhanced breathability and robust water repellency, the integration of cutting-edge sustainable and recycled materials, and the significant improvement of fabric longevity. Critical performance benchmarks for WPB fabrics include their water column pressure rating (measured in millimeters), breathability capacity (typically assessed in grams of moisture vapor transmitted per square meter per 24 hours - g/m²/24h), and resistance to abrasion. The unique selling propositions (USPs) that differentiate products often revolve around the creation of exceptionally lightweight designs, the delivery of superior user comfort, and the implementation of eco-conscious manufacturing processes. Recent breakthroughs have seen the widespread adoption of recycled polyester and nylon, the development of highly effective PFAS-free DWR (Durable Water Repellent) treatments, and the engineering of advanced multi-layer membrane structures for enhanced performance.
Key Drivers, Barriers & Challenges in Waterproof Breathable Fabric Industry
Key Drivers: Rising consumer demand for high-performance apparel, advancements in membrane technology, growth in outdoor recreation, increasing disposable incomes globally, and focus on sustainability.
Key Challenges & Restraints: High raw material costs, stringent environmental regulations, intense competition, supply chain disruptions (e.g., raw material shortages, geopolitical instability) potentially impacting manufacturing and delivery timelines by xx%.
Emerging Opportunities in Waterproof Breathable Fabric Industry
Emerging opportunities lie in the development of highly breathable, lightweight fabrics for extreme sports, the expansion into sustainable and recycled materials, and the development of specialized fabrics for niche applications (e.g., medical, military). Untapped markets in developing countries present significant growth potential.
Growth Accelerators in the Waterproof Breathable Fabric Industry
Several powerful forces are propelling significant growth within the waterproof breathable fabric industry. Foremost among these are relentless technological breakthroughs in membrane fabrication and application, leading to fabrics with unprecedented performance. Strategic, synergistic partnerships between innovative fabric manufacturers and globally recognized apparel brands are crucial for co-developing market-leading products and expanding their reach. Furthermore, the strategic expansion into emerging geographic markets, where the demand for high-performance outdoor and protective wear is rapidly increasing, represents a substantial growth vector. The burgeoning adoption and maturation of e-commerce platforms are also dramatically accelerating market access, enabling brands to connect directly with consumers and streamline distribution channels.
Key Players Shaping the Waterproof Breathable Fabric Industry Market
- Formosa Taffeta Co Ltd
- HeiQ Materials AG
- Helly Hansen
- Henderson Textiles
- Jack Wolfskin - Ausrüstung For Draussen Gmbh & Co Kgaa
- Marmot Mountain LLC
- Pertex
- Polartec
- Schoeller Switzerland
- Stotz & Co AG
- Sympatex
- Teijin Limited
- The North Face A VF Company
- Toray Industries Inc
- W L Gore & Associates Inc
- List Not Exhaustive
Notable Milestones in Waterproof Breathable Fabric Industry Sector
- February 2022: Moncler Grenoble and Polartec forged a significant collaboration, unveiling a new collection that masterfully integrated Polartec Neoshell technology. This partnership underscored the escalating demand for high-performance, sustainably sourced materials, particularly within the discerning luxury apparel market.
- February 2022: Ornot introduced the innovative Trail Magic Jacket, a testament to the advancements in layering systems, featuring the dual performance of Polartec NeoShell for waterproofing and breathability, complemented by Polartec Alpha Direct insulation for exceptional thermal regulation. This product launch vividly illustrated the increasing trend of incorporating sophisticated insulation technologies into advanced waterproof breathable apparel designs.
In-Depth Waterproof Breathable Fabric Industry Market Outlook
The waterproof breathable fabric market is poised for continued strong growth, driven by technological innovation, expanding consumer demand, and increasing focus on sustainable materials. Strategic partnerships and investments in research and development will further fuel market expansion. The market's future potential is substantial, particularly in emerging markets and specialized applications. Companies that prioritize sustainability and innovation will be best positioned to capitalize on future growth opportunities.
Waterproof Breathable Fabric Industry Segmentation
-
1. Raw Material
- 1.1. Poly Tetra Fluoro Ethylene (PTFE)
- 1.2. Polyester
- 1.3. Polyurethane
- 1.4. Other Raw Materials
-
2. Textile
- 2.1. Densely Woven
- 2.2. Membrane
- 2.3. Coated
-
3. Application
- 3.1. Sportswear and Activewear
- 3.2. Protective and Military
- 3.3. General Clothing and Home Textile
- 3.4. Other Applications
Waterproof Breathable Fabric Industry Segmentation By Geography
-
1. Asia Pacific
- 1.1. China
- 1.2. India
- 1.3. Japan
- 1.4. South Korea
- 1.5. Rest of Asia Pacific
-
2. North America
- 2.1. United States
- 2.2. Canada
- 2.3. Mexico
-
3. Europe
- 3.1. Germany
- 3.2. United Kingdom
- 3.3. France
- 3.4. Italy
- 3.5. Rest of Europe
-
4. South America
- 4.1. Brazil
- 4.2. Argentina
- 4.3. Rest of South America
-
5. Middle East and Africa
- 5.1. Saudi Arabia
- 5.2. South Africa
- 5.3. Rest of Middle East and Africa

Waterproof Breathable Fabric Industry Regional Market Share
Geographic Coverage of Waterproof Breathable Fabric Industry
Waterproof Breathable Fabric Industry REPORT HIGHLIGHTS
| Aspects | Details |
|---|---|
| Study Period | 2020-2034 |
| Base Year | 2025 |
| Estimated Year | 2026 |
| Forecast Period | 2026-2034 |
| Historical Period | 2020-2025 |
| Growth Rate | CAGR of > 5.00% from 2020-2034 |
| Segmentation |
|
Table of Contents
- 1. Introduction
- 1.1. Research Scope
- 1.2. Market Segmentation
- 1.3. Research Objective
- 1.4. Definitions and Assumptions
- 2. Executive Summary
- 2.1. Market Snapshot
- 3. Market Dynamics
- 3.1. Market Drivers
- 3.2. Market Restrains
- 3.3. Market Trends
- 3.4. Market Opportunities
- 4. Market Factor Analysis
- 4.1. Porters Five Forces
- 4.1.1. Bargaining Power of Suppliers
- 4.1.2. Bargaining Power of Buyers
- 4.1.3. Threat of New Entrants
- 4.1.4. Threat of Substitutes
- 4.1.5. Competitive Rivalry
- 4.2. PESTEL analysis
- 4.3. BCG Analysis
- 4.3.1. Stars (High Growth, High Market Share)
- 4.3.2. Cash Cows (Low Growth, High Market Share)
- 4.3.3. Question Mark (High Growth, Low Market Share)
- 4.3.4. Dogs (Low Growth, Low Market Share)
- 4.4. Ansoff Matrix Analysis
- 4.5. Supply Chain Analysis
- 4.6. Regulatory Landscape
- 4.7. Current Market Potential and Opportunity Assessment (TAM–SAM–SOM Framework)
- 4.8. VDR Analyst Note
- 4.1. Porters Five Forces
- 5. Market Analysis, Insights and Forecast 2021-2033
- 5.1. Market Analysis, Insights and Forecast - by Raw Material
- 5.1.1. Poly Tetra Fluoro Ethylene (PTFE)
- 5.1.2. Polyester
- 5.1.3. Polyurethane
- 5.1.4. Other Raw Materials
- 5.2. Market Analysis, Insights and Forecast - by Textile
- 5.2.1. Densely Woven
- 5.2.2. Membrane
- 5.2.3. Coated
- 5.3. Market Analysis, Insights and Forecast - by Application
- 5.3.1. Sportswear and Activewear
- 5.3.2. Protective and Military
- 5.3.3. General Clothing and Home Textile
- 5.3.4. Other Applications
- 5.4. Market Analysis, Insights and Forecast - by Region
- 5.4.1. Asia Pacific
- 5.4.2. North America
- 5.4.3. Europe
- 5.4.4. South America
- 5.4.5. Middle East and Africa
- 5.1. Market Analysis, Insights and Forecast - by Raw Material
- 6. Global Waterproof Breathable Fabric Industry Analysis, Insights and Forecast, 2021-2033
- 6.1. Market Analysis, Insights and Forecast - by Raw Material
- 6.1.1. Poly Tetra Fluoro Ethylene (PTFE)
- 6.1.2. Polyester
- 6.1.3. Polyurethane
- 6.1.4. Other Raw Materials
- 6.2. Market Analysis, Insights and Forecast - by Textile
- 6.2.1. Densely Woven
- 6.2.2. Membrane
- 6.2.3. Coated
- 6.3. Market Analysis, Insights and Forecast - by Application
- 6.3.1. Sportswear and Activewear
- 6.3.2. Protective and Military
- 6.3.3. General Clothing and Home Textile
- 6.3.4. Other Applications
- 6.1. Market Analysis, Insights and Forecast - by Raw Material
- 7. Asia Pacific Waterproof Breathable Fabric Industry Analysis, Insights and Forecast, 2021-2033
- 7.1. Market Analysis, Insights and Forecast - by Raw Material
- 7.1.1. Poly Tetra Fluoro Ethylene (PTFE)
- 7.1.2. Polyester
- 7.1.3. Polyurethane
- 7.1.4. Other Raw Materials
- 7.2. Market Analysis, Insights and Forecast - by Textile
- 7.2.1. Densely Woven
- 7.2.2. Membrane
- 7.2.3. Coated
- 7.3. Market Analysis, Insights and Forecast - by Application
- 7.3.1. Sportswear and Activewear
- 7.3.2. Protective and Military
- 7.3.3. General Clothing and Home Textile
- 7.3.4. Other Applications
- 7.1. Market Analysis, Insights and Forecast - by Raw Material
- 8. North America Waterproof Breathable Fabric Industry Analysis, Insights and Forecast, 2021-2033
- 8.1. Market Analysis, Insights and Forecast - by Raw Material
- 8.1.1. Poly Tetra Fluoro Ethylene (PTFE)
- 8.1.2. Polyester
- 8.1.3. Polyurethane
- 8.1.4. Other Raw Materials
- 8.2. Market Analysis, Insights and Forecast - by Textile
- 8.2.1. Densely Woven
- 8.2.2. Membrane
- 8.2.3. Coated
- 8.3. Market Analysis, Insights and Forecast - by Application
- 8.3.1. Sportswear and Activewear
- 8.3.2. Protective and Military
- 8.3.3. General Clothing and Home Textile
- 8.3.4. Other Applications
- 8.1. Market Analysis, Insights and Forecast - by Raw Material
- 9. Europe Waterproof Breathable Fabric Industry Analysis, Insights and Forecast, 2021-2033
- 9.1. Market Analysis, Insights and Forecast - by Raw Material
- 9.1.1. Poly Tetra Fluoro Ethylene (PTFE)
- 9.1.2. Polyester
- 9.1.3. Polyurethane
- 9.1.4. Other Raw Materials
- 9.2. Market Analysis, Insights and Forecast - by Textile
- 9.2.1. Densely Woven
- 9.2.2. Membrane
- 9.2.3. Coated
- 9.3. Market Analysis, Insights and Forecast - by Application
- 9.3.1. Sportswear and Activewear
- 9.3.2. Protective and Military
- 9.3.3. General Clothing and Home Textile
- 9.3.4. Other Applications
- 9.1. Market Analysis, Insights and Forecast - by Raw Material
- 10. South America Waterproof Breathable Fabric Industry Analysis, Insights and Forecast, 2021-2033
- 10.1. Market Analysis, Insights and Forecast - by Raw Material
- 10.1.1. Poly Tetra Fluoro Ethylene (PTFE)
- 10.1.2. Polyester
- 10.1.3. Polyurethane
- 10.1.4. Other Raw Materials
- 10.2. Market Analysis, Insights and Forecast - by Textile
- 10.2.1. Densely Woven
- 10.2.2. Membrane
- 10.2.3. Coated
- 10.3. Market Analysis, Insights and Forecast - by Application
- 10.3.1. Sportswear and Activewear
- 10.3.2. Protective and Military
- 10.3.3. General Clothing and Home Textile
- 10.3.4. Other Applications
- 10.1. Market Analysis, Insights and Forecast - by Raw Material
- 11. Middle East and Africa Waterproof Breathable Fabric Industry Analysis, Insights and Forecast, 2021-2033
- 11.1. Market Analysis, Insights and Forecast - by Raw Material
- 11.1.1. Poly Tetra Fluoro Ethylene (PTFE)
- 11.1.2. Polyester
- 11.1.3. Polyurethane
- 11.1.4. Other Raw Materials
- 11.2. Market Analysis, Insights and Forecast - by Textile
- 11.2.1. Densely Woven
- 11.2.2. Membrane
- 11.2.3. Coated
- 11.3. Market Analysis, Insights and Forecast - by Application
- 11.3.1. Sportswear and Activewear
- 11.3.2. Protective and Military
- 11.3.3. General Clothing and Home Textile
- 11.3.4. Other Applications
- 11.1. Market Analysis, Insights and Forecast - by Raw Material
- 12. Competitive Analysis
- 12.1. Company Profiles
- 12.1.1 Formosa Taffeta Co Ltd
- 12.1.1.1. Company Overview
- 12.1.1.2. Products
- 12.1.1.3. Company Financials
- 12.1.1.4. SWOT Analysis
- 12.1.2 HeiQ Materials AG
- 12.1.2.1. Company Overview
- 12.1.2.2. Products
- 12.1.2.3. Company Financials
- 12.1.2.4. SWOT Analysis
- 12.1.3 Helly Hansen
- 12.1.3.1. Company Overview
- 12.1.3.2. Products
- 12.1.3.3. Company Financials
- 12.1.3.4. SWOT Analysis
- 12.1.4 Henderson Textiles
- 12.1.4.1. Company Overview
- 12.1.4.2. Products
- 12.1.4.3. Company Financials
- 12.1.4.4. SWOT Analysis
- 12.1.5 Jack Wolfskin - Ausrüstung For Draussen Gmbh & Co Kgaa
- 12.1.5.1. Company Overview
- 12.1.5.2. Products
- 12.1.5.3. Company Financials
- 12.1.5.4. SWOT Analysis
- 12.1.6 Marmot Mountain LLC
- 12.1.6.1. Company Overview
- 12.1.6.2. Products
- 12.1.6.3. Company Financials
- 12.1.6.4. SWOT Analysis
- 12.1.7 Pertex
- 12.1.7.1. Company Overview
- 12.1.7.2. Products
- 12.1.7.3. Company Financials
- 12.1.7.4. SWOT Analysis
- 12.1.8 Polartec
- 12.1.8.1. Company Overview
- 12.1.8.2. Products
- 12.1.8.3. Company Financials
- 12.1.8.4. SWOT Analysis
- 12.1.9 Schoeller Switzerland
- 12.1.9.1. Company Overview
- 12.1.9.2. Products
- 12.1.9.3. Company Financials
- 12.1.9.4. SWOT Analysis
- 12.1.10 Stotz & Co AG
- 12.1.10.1. Company Overview
- 12.1.10.2. Products
- 12.1.10.3. Company Financials
- 12.1.10.4. SWOT Analysis
- 12.1.11 Sympatex
- 12.1.11.1. Company Overview
- 12.1.11.2. Products
- 12.1.11.3. Company Financials
- 12.1.11.4. SWOT Analysis
- 12.1.12 Teijin Limited
- 12.1.12.1. Company Overview
- 12.1.12.2. Products
- 12.1.12.3. Company Financials
- 12.1.12.4. SWOT Analysis
- 12.1.13 The North Face A VF Company
- 12.1.13.1. Company Overview
- 12.1.13.2. Products
- 12.1.13.3. Company Financials
- 12.1.13.4. SWOT Analysis
- 12.1.14 Toray Industries Inc
- 12.1.14.1. Company Overview
- 12.1.14.2. Products
- 12.1.14.3. Company Financials
- 12.1.14.4. SWOT Analysis
- 12.1.15 W L Gore & Associates Inc *List Not Exhaustive
- 12.1.15.1. Company Overview
- 12.1.15.2. Products
- 12.1.15.3. Company Financials
- 12.1.15.4. SWOT Analysis
- 12.1.1 Formosa Taffeta Co Ltd
- 12.2. Market Entropy
- 12.2.1 Company's Key Areas Served
- 12.2.2 Recent Developments
- 12.3. Company Market Share Analysis 2025
- 12.3.1 Top 5 Companies Market Share Analysis
- 12.3.2 Top 3 Companies Market Share Analysis
- 12.4. List of Potential Customers
- 13. Research Methodology
List of Figures
- Figure 1: Global Waterproof Breathable Fabric Industry Revenue Breakdown (Million, %) by Region 2025 & 2033
- Figure 2: Global Waterproof Breathable Fabric Industry Volume Breakdown (Billion, %) by Region 2025 & 2033
- Figure 3: Asia Pacific Waterproof Breathable Fabric Industry Revenue (Million), by Raw Material 2025 & 2033
- Figure 4: Asia Pacific Waterproof Breathable Fabric Industry Volume (Billion), by Raw Material 2025 & 2033
- Figure 5: Asia Pacific Waterproof Breathable Fabric Industry Revenue Share (%), by Raw Material 2025 & 2033
- Figure 6: Asia Pacific Waterproof Breathable Fabric Industry Volume Share (%), by Raw Material 2025 & 2033
- Figure 7: Asia Pacific Waterproof Breathable Fabric Industry Revenue (Million), by Textile 2025 & 2033
- Figure 8: Asia Pacific Waterproof Breathable Fabric Industry Volume (Billion), by Textile 2025 & 2033
- Figure 9: Asia Pacific Waterproof Breathable Fabric Industry Revenue Share (%), by Textile 2025 & 2033
- Figure 10: Asia Pacific Waterproof Breathable Fabric Industry Volume Share (%), by Textile 2025 & 2033
- Figure 11: Asia Pacific Waterproof Breathable Fabric Industry Revenue (Million), by Application 2025 & 2033
- Figure 12: Asia Pacific Waterproof Breathable Fabric Industry Volume (Billion), by Application 2025 & 2033
- Figure 13: Asia Pacific Waterproof Breathable Fabric Industry Revenue Share (%), by Application 2025 & 2033
- Figure 14: Asia Pacific Waterproof Breathable Fabric Industry Volume Share (%), by Application 2025 & 2033
- Figure 15: Asia Pacific Waterproof Breathable Fabric Industry Revenue (Million), by Country 2025 & 2033
- Figure 16: Asia Pacific Waterproof Breathable Fabric Industry Volume (Billion), by Country 2025 & 2033
- Figure 17: Asia Pacific Waterproof Breathable Fabric Industry Revenue Share (%), by Country 2025 & 2033
- Figure 18: Asia Pacific Waterproof Breathable Fabric Industry Volume Share (%), by Country 2025 & 2033
- Figure 19: North America Waterproof Breathable Fabric Industry Revenue (Million), by Raw Material 2025 & 2033
- Figure 20: North America Waterproof Breathable Fabric Industry Volume (Billion), by Raw Material 2025 & 2033
- Figure 21: North America Waterproof Breathable Fabric Industry Revenue Share (%), by Raw Material 2025 & 2033
- Figure 22: North America Waterproof Breathable Fabric Industry Volume Share (%), by Raw Material 2025 & 2033
- Figure 23: North America Waterproof Breathable Fabric Industry Revenue (Million), by Textile 2025 & 2033
- Figure 24: North America Waterproof Breathable Fabric Industry Volume (Billion), by Textile 2025 & 2033
- Figure 25: North America Waterproof Breathable Fabric Industry Revenue Share (%), by Textile 2025 & 2033
- Figure 26: North America Waterproof Breathable Fabric Industry Volume Share (%), by Textile 2025 & 2033
- Figure 27: North America Waterproof Breathable Fabric Industry Revenue (Million), by Application 2025 & 2033
- Figure 28: North America Waterproof Breathable Fabric Industry Volume (Billion), by Application 2025 & 2033
- Figure 29: North America Waterproof Breathable Fabric Industry Revenue Share (%), by Application 2025 & 2033
- Figure 30: North America Waterproof Breathable Fabric Industry Volume Share (%), by Application 2025 & 2033
- Figure 31: North America Waterproof Breathable Fabric Industry Revenue (Million), by Country 2025 & 2033
- Figure 32: North America Waterproof Breathable Fabric Industry Volume (Billion), by Country 2025 & 2033
- Figure 33: North America Waterproof Breathable Fabric Industry Revenue Share (%), by Country 2025 & 2033
- Figure 34: North America Waterproof Breathable Fabric Industry Volume Share (%), by Country 2025 & 2033
- Figure 35: Europe Waterproof Breathable Fabric Industry Revenue (Million), by Raw Material 2025 & 2033
- Figure 36: Europe Waterproof Breathable Fabric Industry Volume (Billion), by Raw Material 2025 & 2033
- Figure 37: Europe Waterproof Breathable Fabric Industry Revenue Share (%), by Raw Material 2025 & 2033
- Figure 38: Europe Waterproof Breathable Fabric Industry Volume Share (%), by Raw Material 2025 & 2033
- Figure 39: Europe Waterproof Breathable Fabric Industry Revenue (Million), by Textile 2025 & 2033
- Figure 40: Europe Waterproof Breathable Fabric Industry Volume (Billion), by Textile 2025 & 2033
- Figure 41: Europe Waterproof Breathable Fabric Industry Revenue Share (%), by Textile 2025 & 2033
- Figure 42: Europe Waterproof Breathable Fabric Industry Volume Share (%), by Textile 2025 & 2033
- Figure 43: Europe Waterproof Breathable Fabric Industry Revenue (Million), by Application 2025 & 2033
- Figure 44: Europe Waterproof Breathable Fabric Industry Volume (Billion), by Application 2025 & 2033
- Figure 45: Europe Waterproof Breathable Fabric Industry Revenue Share (%), by Application 2025 & 2033
- Figure 46: Europe Waterproof Breathable Fabric Industry Volume Share (%), by Application 2025 & 2033
- Figure 47: Europe Waterproof Breathable Fabric Industry Revenue (Million), by Country 2025 & 2033
- Figure 48: Europe Waterproof Breathable Fabric Industry Volume (Billion), by Country 2025 & 2033
- Figure 49: Europe Waterproof Breathable Fabric Industry Revenue Share (%), by Country 2025 & 2033
- Figure 50: Europe Waterproof Breathable Fabric Industry Volume Share (%), by Country 2025 & 2033
- Figure 51: South America Waterproof Breathable Fabric Industry Revenue (Million), by Raw Material 2025 & 2033
- Figure 52: South America Waterproof Breathable Fabric Industry Volume (Billion), by Raw Material 2025 & 2033
- Figure 53: South America Waterproof Breathable Fabric Industry Revenue Share (%), by Raw Material 2025 & 2033
- Figure 54: South America Waterproof Breathable Fabric Industry Volume Share (%), by Raw Material 2025 & 2033
- Figure 55: South America Waterproof Breathable Fabric Industry Revenue (Million), by Textile 2025 & 2033
- Figure 56: South America Waterproof Breathable Fabric Industry Volume (Billion), by Textile 2025 & 2033
- Figure 57: South America Waterproof Breathable Fabric Industry Revenue Share (%), by Textile 2025 & 2033
- Figure 58: South America Waterproof Breathable Fabric Industry Volume Share (%), by Textile 2025 & 2033
- Figure 59: South America Waterproof Breathable Fabric Industry Revenue (Million), by Application 2025 & 2033
- Figure 60: South America Waterproof Breathable Fabric Industry Volume (Billion), by Application 2025 & 2033
- Figure 61: South America Waterproof Breathable Fabric Industry Revenue Share (%), by Application 2025 & 2033
- Figure 62: South America Waterproof Breathable Fabric Industry Volume Share (%), by Application 2025 & 2033
- Figure 63: South America Waterproof Breathable Fabric Industry Revenue (Million), by Country 2025 & 2033
- Figure 64: South America Waterproof Breathable Fabric Industry Volume (Billion), by Country 2025 & 2033
- Figure 65: South America Waterproof Breathable Fabric Industry Revenue Share (%), by Country 2025 & 2033
- Figure 66: South America Waterproof Breathable Fabric Industry Volume Share (%), by Country 2025 & 2033
- Figure 67: Middle East and Africa Waterproof Breathable Fabric Industry Revenue (Million), by Raw Material 2025 & 2033
- Figure 68: Middle East and Africa Waterproof Breathable Fabric Industry Volume (Billion), by Raw Material 2025 & 2033
- Figure 69: Middle East and Africa Waterproof Breathable Fabric Industry Revenue Share (%), by Raw Material 2025 & 2033
- Figure 70: Middle East and Africa Waterproof Breathable Fabric Industry Volume Share (%), by Raw Material 2025 & 2033
- Figure 71: Middle East and Africa Waterproof Breathable Fabric Industry Revenue (Million), by Textile 2025 & 2033
- Figure 72: Middle East and Africa Waterproof Breathable Fabric Industry Volume (Billion), by Textile 2025 & 2033
- Figure 73: Middle East and Africa Waterproof Breathable Fabric Industry Revenue Share (%), by Textile 2025 & 2033
- Figure 74: Middle East and Africa Waterproof Breathable Fabric Industry Volume Share (%), by Textile 2025 & 2033
- Figure 75: Middle East and Africa Waterproof Breathable Fabric Industry Revenue (Million), by Application 2025 & 2033
- Figure 76: Middle East and Africa Waterproof Breathable Fabric Industry Volume (Billion), by Application 2025 & 2033
- Figure 77: Middle East and Africa Waterproof Breathable Fabric Industry Revenue Share (%), by Application 2025 & 2033
- Figure 78: Middle East and Africa Waterproof Breathable Fabric Industry Volume Share (%), by Application 2025 & 2033
- Figure 79: Middle East and Africa Waterproof Breathable Fabric Industry Revenue (Million), by Country 2025 & 2033
- Figure 80: Middle East and Africa Waterproof Breathable Fabric Industry Volume (Billion), by Country 2025 & 2033
- Figure 81: Middle East and Africa Waterproof Breathable Fabric Industry Revenue Share (%), by Country 2025 & 2033
- Figure 82: Middle East and Africa Waterproof Breathable Fabric Industry Volume Share (%), by Country 2025 & 2033
List of Tables
- Table 1: Global Waterproof Breathable Fabric Industry Revenue Million Forecast, by Raw Material 2020 & 2033
- Table 2: Global Waterproof Breathable Fabric Industry Volume Billion Forecast, by Raw Material 2020 & 2033
- Table 3: Global Waterproof Breathable Fabric Industry Revenue Million Forecast, by Textile 2020 & 2033
- Table 4: Global Waterproof Breathable Fabric Industry Volume Billion Forecast, by Textile 2020 & 2033
- Table 5: Global Waterproof Breathable Fabric Industry Revenue Million Forecast, by Application 2020 & 2033
- Table 6: Global Waterproof Breathable Fabric Industry Volume Billion Forecast, by Application 2020 & 2033
- Table 7: Global Waterproof Breathable Fabric Industry Revenue Million Forecast, by Region 2020 & 2033
- Table 8: Global Waterproof Breathable Fabric Industry Volume Billion Forecast, by Region 2020 & 2033
- Table 9: Global Waterproof Breathable Fabric Industry Revenue Million Forecast, by Raw Material 2020 & 2033
- Table 10: Global Waterproof Breathable Fabric Industry Volume Billion Forecast, by Raw Material 2020 & 2033
- Table 11: Global Waterproof Breathable Fabric Industry Revenue Million Forecast, by Textile 2020 & 2033
- Table 12: Global Waterproof Breathable Fabric Industry Volume Billion Forecast, by Textile 2020 & 2033
- Table 13: Global Waterproof Breathable Fabric Industry Revenue Million Forecast, by Application 2020 & 2033
- Table 14: Global Waterproof Breathable Fabric Industry Volume Billion Forecast, by Application 2020 & 2033
- Table 15: Global Waterproof Breathable Fabric Industry Revenue Million Forecast, by Country 2020 & 2033
- Table 16: Global Waterproof Breathable Fabric Industry Volume Billion Forecast, by Country 2020 & 2033
- Table 17: China Waterproof Breathable Fabric Industry Revenue (Million) Forecast, by Application 2020 & 2033
- Table 18: China Waterproof Breathable Fabric Industry Volume (Billion) Forecast, by Application 2020 & 2033
- Table 19: India Waterproof Breathable Fabric Industry Revenue (Million) Forecast, by Application 2020 & 2033
- Table 20: India Waterproof Breathable Fabric Industry Volume (Billion) Forecast, by Application 2020 & 2033
- Table 21: Japan Waterproof Breathable Fabric Industry Revenue (Million) Forecast, by Application 2020 & 2033
- Table 22: Japan Waterproof Breathable Fabric Industry Volume (Billion) Forecast, by Application 2020 & 2033
- Table 23: South Korea Waterproof Breathable Fabric Industry Revenue (Million) Forecast, by Application 2020 & 2033
- Table 24: South Korea Waterproof Breathable Fabric Industry Volume (Billion) Forecast, by Application 2020 & 2033
- Table 25: Rest of Asia Pacific Waterproof Breathable Fabric Industry Revenue (Million) Forecast, by Application 2020 & 2033
- Table 26: Rest of Asia Pacific Waterproof Breathable Fabric Industry Volume (Billion) Forecast, by Application 2020 & 2033
- Table 27: Global Waterproof Breathable Fabric Industry Revenue Million Forecast, by Raw Material 2020 & 2033
- Table 28: Global Waterproof Breathable Fabric Industry Volume Billion Forecast, by Raw Material 2020 & 2033
- Table 29: Global Waterproof Breathable Fabric Industry Revenue Million Forecast, by Textile 2020 & 2033
- Table 30: Global Waterproof Breathable Fabric Industry Volume Billion Forecast, by Textile 2020 & 2033
- Table 31: Global Waterproof Breathable Fabric Industry Revenue Million Forecast, by Application 2020 & 2033
- Table 32: Global Waterproof Breathable Fabric Industry Volume Billion Forecast, by Application 2020 & 2033
- Table 33: Global Waterproof Breathable Fabric Industry Revenue Million Forecast, by Country 2020 & 2033
- Table 34: Global Waterproof Breathable Fabric Industry Volume Billion Forecast, by Country 2020 & 2033
- Table 35: United States Waterproof Breathable Fabric Industry Revenue (Million) Forecast, by Application 2020 & 2033
- Table 36: United States Waterproof Breathable Fabric Industry Volume (Billion) Forecast, by Application 2020 & 2033
- Table 37: Canada Waterproof Breathable Fabric Industry Revenue (Million) Forecast, by Application 2020 & 2033
- Table 38: Canada Waterproof Breathable Fabric Industry Volume (Billion) Forecast, by Application 2020 & 2033
- Table 39: Mexico Waterproof Breathable Fabric Industry Revenue (Million) Forecast, by Application 2020 & 2033
- Table 40: Mexico Waterproof Breathable Fabric Industry Volume (Billion) Forecast, by Application 2020 & 2033
- Table 41: Global Waterproof Breathable Fabric Industry Revenue Million Forecast, by Raw Material 2020 & 2033
- Table 42: Global Waterproof Breathable Fabric Industry Volume Billion Forecast, by Raw Material 2020 & 2033
- Table 43: Global Waterproof Breathable Fabric Industry Revenue Million Forecast, by Textile 2020 & 2033
- Table 44: Global Waterproof Breathable Fabric Industry Volume Billion Forecast, by Textile 2020 & 2033
- Table 45: Global Waterproof Breathable Fabric Industry Revenue Million Forecast, by Application 2020 & 2033
- Table 46: Global Waterproof Breathable Fabric Industry Volume Billion Forecast, by Application 2020 & 2033
- Table 47: Global Waterproof Breathable Fabric Industry Revenue Million Forecast, by Country 2020 & 2033
- Table 48: Global Waterproof Breathable Fabric Industry Volume Billion Forecast, by Country 2020 & 2033
- Table 49: Germany Waterproof Breathable Fabric Industry Revenue (Million) Forecast, by Application 2020 & 2033
- Table 50: Germany Waterproof Breathable Fabric Industry Volume (Billion) Forecast, by Application 2020 & 2033
- Table 51: United Kingdom Waterproof Breathable Fabric Industry Revenue (Million) Forecast, by Application 2020 & 2033
- Table 52: United Kingdom Waterproof Breathable Fabric Industry Volume (Billion) Forecast, by Application 2020 & 2033
- Table 53: France Waterproof Breathable Fabric Industry Revenue (Million) Forecast, by Application 2020 & 2033
- Table 54: France Waterproof Breathable Fabric Industry Volume (Billion) Forecast, by Application 2020 & 2033
- Table 55: Italy Waterproof Breathable Fabric Industry Revenue (Million) Forecast, by Application 2020 & 2033
- Table 56: Italy Waterproof Breathable Fabric Industry Volume (Billion) Forecast, by Application 2020 & 2033
- Table 57: Rest of Europe Waterproof Breathable Fabric Industry Revenue (Million) Forecast, by Application 2020 & 2033
- Table 58: Rest of Europe Waterproof Breathable Fabric Industry Volume (Billion) Forecast, by Application 2020 & 2033
- Table 59: Global Waterproof Breathable Fabric Industry Revenue Million Forecast, by Raw Material 2020 & 2033
- Table 60: Global Waterproof Breathable Fabric Industry Volume Billion Forecast, by Raw Material 2020 & 2033
- Table 61: Global Waterproof Breathable Fabric Industry Revenue Million Forecast, by Textile 2020 & 2033
- Table 62: Global Waterproof Breathable Fabric Industry Volume Billion Forecast, by Textile 2020 & 2033
- Table 63: Global Waterproof Breathable Fabric Industry Revenue Million Forecast, by Application 2020 & 2033
- Table 64: Global Waterproof Breathable Fabric Industry Volume Billion Forecast, by Application 2020 & 2033
- Table 65: Global Waterproof Breathable Fabric Industry Revenue Million Forecast, by Country 2020 & 2033
- Table 66: Global Waterproof Breathable Fabric Industry Volume Billion Forecast, by Country 2020 & 2033
- Table 67: Brazil Waterproof Breathable Fabric Industry Revenue (Million) Forecast, by Application 2020 & 2033
- Table 68: Brazil Waterproof Breathable Fabric Industry Volume (Billion) Forecast, by Application 2020 & 2033
- Table 69: Argentina Waterproof Breathable Fabric Industry Revenue (Million) Forecast, by Application 2020 & 2033
- Table 70: Argentina Waterproof Breathable Fabric Industry Volume (Billion) Forecast, by Application 2020 & 2033
- Table 71: Rest of South America Waterproof Breathable Fabric Industry Revenue (Million) Forecast, by Application 2020 & 2033
- Table 72: Rest of South America Waterproof Breathable Fabric Industry Volume (Billion) Forecast, by Application 2020 & 2033
- Table 73: Global Waterproof Breathable Fabric Industry Revenue Million Forecast, by Raw Material 2020 & 2033
- Table 74: Global Waterproof Breathable Fabric Industry Volume Billion Forecast, by Raw Material 2020 & 2033
- Table 75: Global Waterproof Breathable Fabric Industry Revenue Million Forecast, by Textile 2020 & 2033
- Table 76: Global Waterproof Breathable Fabric Industry Volume Billion Forecast, by Textile 2020 & 2033
- Table 77: Global Waterproof Breathable Fabric Industry Revenue Million Forecast, by Application 2020 & 2033
- Table 78: Global Waterproof Breathable Fabric Industry Volume Billion Forecast, by Application 2020 & 2033
- Table 79: Global Waterproof Breathable Fabric Industry Revenue Million Forecast, by Country 2020 & 2033
- Table 80: Global Waterproof Breathable Fabric Industry Volume Billion Forecast, by Country 2020 & 2033
- Table 81: Saudi Arabia Waterproof Breathable Fabric Industry Revenue (Million) Forecast, by Application 2020 & 2033
- Table 82: Saudi Arabia Waterproof Breathable Fabric Industry Volume (Billion) Forecast, by Application 2020 & 2033
- Table 83: South Africa Waterproof Breathable Fabric Industry Revenue (Million) Forecast, by Application 2020 & 2033
- Table 84: South Africa Waterproof Breathable Fabric Industry Volume (Billion) Forecast, by Application 2020 & 2033
- Table 85: Rest of Middle East and Africa Waterproof Breathable Fabric Industry Revenue (Million) Forecast, by Application 2020 & 2033
- Table 86: Rest of Middle East and Africa Waterproof Breathable Fabric Industry Volume (Billion) Forecast, by Application 2020 & 2033
Frequently Asked Questions
1. What is the projected Compound Annual Growth Rate (CAGR) of the Waterproof Breathable Fabric Industry?
The projected CAGR is approximately > 5.00%.
2. Which companies are prominent players in the Waterproof Breathable Fabric Industry?
Key companies in the market include Formosa Taffeta Co Ltd, HeiQ Materials AG, Helly Hansen, Henderson Textiles, Jack Wolfskin - Ausrüstung For Draussen Gmbh & Co Kgaa, Marmot Mountain LLC, Pertex, Polartec, Schoeller Switzerland, Stotz & Co AG, Sympatex, Teijin Limited, The North Face A VF Company, Toray Industries Inc, W L Gore & Associates Inc *List Not Exhaustive.
3. What are the main segments of the Waterproof Breathable Fabric Industry?
The market segments include Raw Material, Textile, Application.
4. Can you provide details about the market size?
The market size is estimated to be USD 2.18 Million as of 2022.
5. What are some drivers contributing to market growth?
Increasing Demand for Waterproof Breathable Textiles as Protective Wear; Growing Demand from Sportswear and Activewear Industry.
6. What are the notable trends driving market growth?
Sportswear and Activewear Segment Expected to Witness High Growth.
7. Are there any restraints impacting market growth?
Increasing Demand for Waterproof Breathable Textiles as Protective Wear; Growing Demand from Sportswear and Activewear Industry.
8. Can you provide examples of recent developments in the market?
February 2022: Moncler Grenoble and Polartec collaborated on a new collection. Moncler launched its apex award-winning Grenoble Day-namic collection, a new range of activewear. This line makes use of cutting-edge Polartec technology, notably Polartec Neoshell.
9. What pricing options are available for accessing the report?
Pricing options include single-user, multi-user, and enterprise licenses priced at USD 4750, USD 5250, and USD 8750 respectively.
10. Is the market size provided in terms of value or volume?
The market size is provided in terms of value, measured in Million and volume, measured in Billion.
11. Are there any specific market keywords associated with the report?
Yes, the market keyword associated with the report is "Waterproof Breathable Fabric Industry," which aids in identifying and referencing the specific market segment covered.
12. How do I determine which pricing option suits my needs best?
The pricing options vary based on user requirements and access needs. Individual users may opt for single-user licenses, while businesses requiring broader access may choose multi-user or enterprise licenses for cost-effective access to the report.
13. Are there any additional resources or data provided in the Waterproof Breathable Fabric Industry report?
While the report offers comprehensive insights, it's advisable to review the specific contents or supplementary materials provided to ascertain if additional resources or data are available.
14. How can I stay updated on further developments or reports in the Waterproof Breathable Fabric Industry?
To stay informed about further developments, trends, and reports in the Waterproof Breathable Fabric Industry, consider subscribing to industry newsletters, following relevant companies and organizations, or regularly checking reputable industry news sources and publications.
Methodology
Step 1 - Identification of Relevant Samples Size from Population Database


Step 2 - Approaches for Defining Global Market Size (Value, Volume* & Price*)

Note*: In applicable scenarios
Step 3 - Data Sources
Primary Research
- Web Analytics
- Survey Reports
- Research Institute
- Latest Research Reports
- Opinion Leaders
Secondary Research
- Annual Reports
- White Paper
- Latest Press Release
- Industry Association
- Paid Database
- Investor Presentations

Step 4 - Data Triangulation
Involves using different sources of information in order to increase the validity of a study
These sources are likely to be stakeholders in a program - participants, other researchers, program staff, other community members, and so on.
Then we put all data in single framework & apply various statistical tools to find out the dynamic on the market.
During the analysis stage, feedback from the stakeholder groups would be compared to determine areas of agreement as well as areas of divergence