

Key Insights
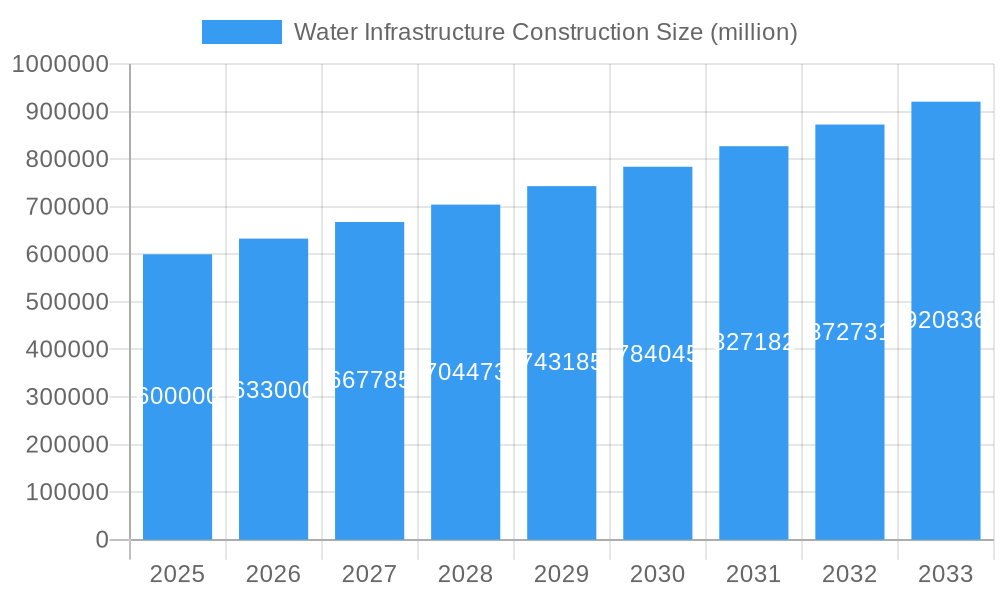
The global Water Infrastructure Construction market is poised for significant expansion, projected to reach an estimated market size of approximately USD 600,000 million by 2025. This growth is driven by an escalating demand for clean water, stringent environmental regulations, and the continuous need to upgrade aging water and wastewater systems worldwide. The market is expected to witness a Compound Annual Growth Rate (CAGR) of around 5.5% between 2025 and 2033, underscoring its robust trajectory. Key applications within this sector include public facilities, industrial operations, and residential buildings, all of which require substantial investment in water infrastructure. The market is segmented by type, encompassing both applied water systems for supply and distribution, and wastewater systems for treatment and disposal. Emerging economies, particularly in the Asia Pacific region, are anticipated to be major growth contributors due to rapid urbanization and increasing per capita water consumption.
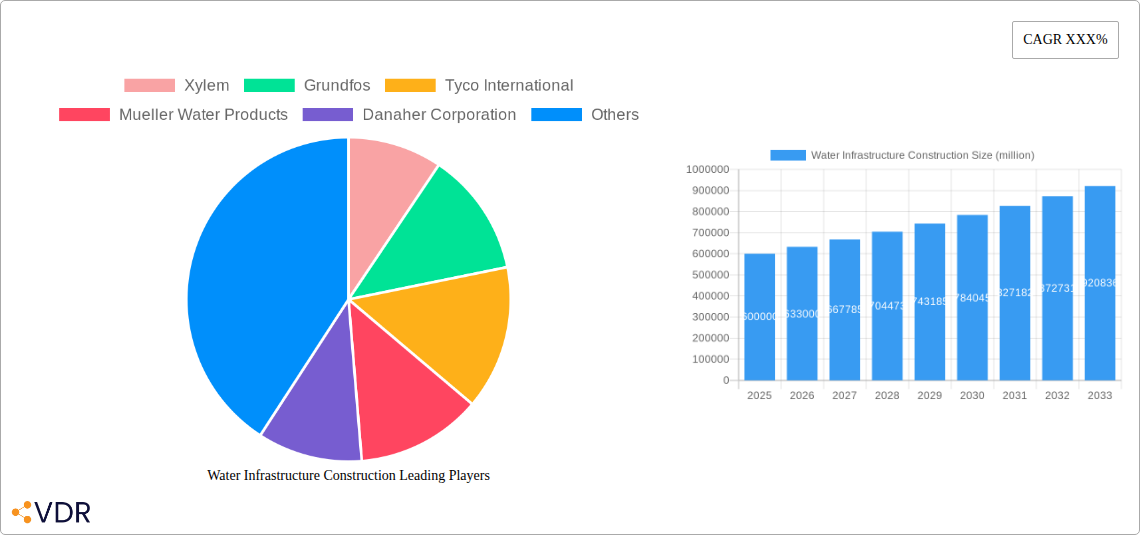
Water Infrastructure Construction Market Size (In Billion)
The expansion of the Water Infrastructure Construction market is primarily fueled by the critical need to address water scarcity, improve sanitation, and mitigate the impacts of climate change on water resources. Governments and private entities are increasingly recognizing the importance of investing in resilient and efficient water management systems. Technological advancements, such as smart water meters, advanced leak detection systems, and sophisticated treatment technologies, are also playing a crucial role in optimizing water usage and reducing operational costs, thereby stimulating market growth. However, the market faces certain restraints, including high initial investment costs, complex regulatory frameworks, and the availability of skilled labor. Nonetheless, the overarching imperative for sustainable water management and the growing awareness of water as a vital resource are expected to propel the market forward, with companies like Xylem, Grundfos, and Mueller Water Products leading the innovation and expansion efforts.
Water Infrastructure Construction Company Market Share
Water Infrastructure Construction Market Dynamics & Structure
The global water infrastructure construction market is characterized by a moderate to high concentration, with key players like Xylem, Grundfos, Tyco International, Mueller Water Products, Danaher Corporation, Sulzer, Itron, KSB, Evoqua Water, United Rental, Kubota, and Kurita Water Industries actively shaping its landscape. Technological innovation is a primary driver, fueled by the increasing demand for advanced treatment technologies, smart water management systems, and leak detection solutions. Regulatory frameworks, particularly stringent environmental standards and government mandates for water quality and conservation, also play a crucial role in shaping investment and development. Competitive product substitutes, while present in certain niche areas, are generally outpaced by the integrated solutions offered by major industry participants. End-user demographics are shifting, with growing urbanization and population density increasing the demand for reliable water and wastewater services. Mergers and acquisitions (M&A) trends are notable, with companies consolidating to gain market share, acquire new technologies, or expand their geographical reach. For instance, the historical period (2019-2024) witnessed approximately 15 significant M&A deals valued at over $500 million collectively, indicating a strategic move towards consolidation. Barriers to innovation include high capital investment requirements and the lengthy approval processes for new technologies in the public sector.
- Market Concentration: Moderately to highly concentrated with a few dominant players.
- Technological Innovation Drivers: Smart water grids, advanced treatment, leak detection, SCADA systems.
- Regulatory Frameworks: Environmental protection acts, water quality standards, government funding initiatives.
- Competitive Product Substitutes: Limited for integrated solutions, but present in specific component markets.
- End-User Demographics: Increasing urbanization, population growth, aging infrastructure replacement.
- M&A Trends: Strategic acquisitions for technology, market access, and economies of scale.
Water Infrastructure Construction Growth Trends & Insights
The water infrastructure construction market is poised for significant expansion, driven by a confluence of factors including increasing global water scarcity, the imperative for aging infrastructure replacement, and burgeoning demand from both public and industrial sectors. The market size, estimated at $1,200,000 million in the base year 2025, is projected to witness a robust Compound Annual Growth Rate (CAGR) of 6.5% throughout the forecast period of 2025–2033. This growth trajectory is underpinned by substantial investments in both applied water and wastewater treatment facilities. The adoption rates for advanced technologies, such as Supervisory Control and Data Acquisition (SCADA) systems for remote monitoring and control of water networks, and Geographic Information Systems (GIS) for asset management, are accelerating. Technological disruptions are primarily focused on enhancing efficiency, reducing water loss, and improving water quality. For example, the proliferation of smart meters and real-time data analytics is enabling water utilities to optimize operations and proactively address issues. Consumer behavior is also evolving, with greater awareness of water conservation and a demand for higher quality drinking water, pushing municipalities and industries to upgrade their infrastructure. Furthermore, the historical period (2019–2024) saw a market size evolution from approximately $950,000 million to $1,150,000 million, demonstrating a consistent upward trend that sets the stage for future growth. The penetration of sustainable water management practices is also a key indicator of market maturity and the increasing focus on long-term solutions. The development of decentralized water treatment systems and the adoption of nature-based solutions for stormwater management are also contributing to the market's dynamic evolution.
Dominant Regions, Countries, or Segments in Water Infrastructure Construction
The Public Facility application segment, encompassing municipal water supply, wastewater treatment, and stormwater management systems, is currently the dominant driver of growth in the global water infrastructure construction market. This dominance is attributed to a multifaceted set of factors, including escalating population density in urban centers worldwide, the critical need to upgrade and expand aging water networks, and increasingly stringent environmental regulations that mandate higher standards for treated wastewater discharge. Regions such as North America, Europe, and Asia-Pacific are at the forefront of this growth. For instance, North America, with an estimated market share of 30% in 2025, is heavily investing in replacing its aging water mains and upgrading its treatment plants to meet evolving regulatory demands and improve resilience against climate change impacts. European nations are focusing on advanced water reclamation technologies and the implementation of smart water grids to optimize resource allocation and reduce non-revenue water. The Asia-Pacific region, driven by rapid urbanization and industrialization, is witnessing substantial investments in new water and wastewater infrastructure projects to cater to the growing demand from its burgeoning populations and expanding industrial base.
In terms of Type, the Wastewater segment is experiencing particularly strong growth. The global wastewater treatment market is projected to reach $350,000 million by 2025, driven by increased industrial discharge regulations and a growing emphasis on public health and environmental protection. This segment is characterized by significant investments in advanced treatment technologies, including membrane bioreactors (MBRs), ultraviolet (UV) disinfection, and nutrient removal systems, to comply with stricter discharge limits. The growth potential in this segment is further amplified by the drive to achieve circular economy principles through water reuse and resource recovery from wastewater.
Key drivers for the dominance of Public Facility and Wastewater segments include:
- Economic Policies: Government stimulus packages and infrastructure spending initiatives are channeling significant funds into public water projects.
- Infrastructure Investment: Decades of underinvestment in aging water infrastructure across developed nations necessitate massive replacement and upgrade projects.
- Environmental Regulations: Increasingly stringent regulations on water quality and discharge standards are compelling significant investments in wastewater treatment technologies.
- Urbanization and Population Growth: The concentration of populations in urban areas places immense pressure on existing water and wastewater systems, requiring expansion and modernization.
- Technological Advancements: Innovations in treatment processes, smart monitoring, and leak detection are enabling more efficient and cost-effective solutions, further spurring investment.
- Climate Change Adaptation: Investments in resilient infrastructure to manage extreme weather events, such as floods and droughts, are also contributing to the growth of wastewater and stormwater management.
The market share for Public Facility applications is estimated to be around 55% in 2025, with Wastewater Type holding a significant portion of that. The growth potential in these segments remains exceptionally high due to the ongoing and future need for essential water services.
Water Infrastructure Construction Product Landscape
The water infrastructure construction product landscape is increasingly defined by smart, sustainable, and resilient solutions. Innovations focus on enhancing efficiency, reducing operational costs, and minimizing environmental impact. This includes advanced pumping systems with variable frequency drives, intelligent filtration membranes for superior water purification, and sophisticated sensor networks for real-time monitoring of water quality and distribution. The integration of digital technologies, such as IoT and AI, is transforming traditional infrastructure into smart grids capable of predictive maintenance and optimized resource management. Performance metrics are continuously improving, with products demonstrating higher energy efficiency, longer lifespans, and enhanced reliability. Unique selling propositions often lie in the ability to integrate seamlessly with existing systems and provide comprehensive data analytics for informed decision-making.
Key Drivers, Barriers & Challenges in Water Infrastructure Construction
The water infrastructure construction industry is propelled by a powerful set of drivers. Government initiatives and funding programs are paramount, with significant public investment aimed at modernizing aging systems and ensuring water security. Increasing global population and urbanization directly translate to higher demand for reliable water and wastewater services, necessitating new and expanded infrastructure. Stricter environmental regulations compel upgrades to treatment facilities and discharge standards. Technological advancements, particularly in smart water management, energy-efficient technologies, and advanced filtration, are driving innovation and creating new market opportunities. The need for climate change adaptation to address extreme weather events also fuels investment in resilient infrastructure.
However, the industry faces substantial barriers and challenges. High capital investment requirements are a significant hurdle, often requiring long-term financing and complex budgeting. Regulatory complexities and lengthy approval processes can delay project timelines and increase costs. Supply chain disruptions, exacerbated by global events, can impact material availability and project schedules. Aging workforce and skilled labor shortages pose a critical operational challenge. Public perception and stakeholder engagement can also be a barrier, requiring effective communication and consensus-building. The economic viability of smaller projects and the competitiveness within the market can also present challenges for some participants.
Emerging Opportunities in Water Infrastructure Construction
Emerging opportunities in water infrastructure construction are abundant and diverse. The growing demand for water reuse and recycling technologies presents a significant avenue, driven by water scarcity and sustainability goals. Decentralized water and wastewater treatment systems, particularly for remote or underserviced areas, offer innovative solutions. The integration of nature-based solutions, such as green infrastructure for stormwater management, is gaining traction. Furthermore, the increasing adoption of digital twins and advanced analytics for optimizing infrastructure performance and predictive maintenance opens up new service-based revenue streams. The focus on resilience and climate adaptation is creating opportunities for advanced flood control and drought management systems.
Growth Accelerators in the Water Infrastructure Construction Industry
Several catalysts are accelerating growth in the water infrastructure construction industry. Strategic partnerships and collaborations between technology providers, engineering firms, and construction companies are vital for delivering complex, integrated solutions. Government stimulus packages and infrastructure spending bills provide essential financial impetus. Technological breakthroughs in areas like nanotechnology for filtration, advanced sensor technology, and AI-powered analytics are creating new efficiencies and capabilities. Market expansion into developing economies with unmet infrastructure needs represents a significant growth frontier. The increasing emphasis on sustainable development and the circular economy is also driving demand for innovative and environmentally friendly solutions, further accelerating industry growth.
Key Players Shaping the Water Infrastructure Construction Market
- Xylem
- Grundfos
- Tyco International
- Mueller Water Products
- Danaher Corporation
- Sulzer
- Itron
- KSB
- Evoqua Water
- United Rental
- Kubota
- Kurita Water Industries
Notable Milestones in Water Infrastructure Construction Sector
- 2019: Launch of Xylem's "smart water network" technologies, enhancing real-time monitoring and control.
- 2020: Significant government infrastructure spending packages announced in North America and Europe, earmarking substantial funds for water projects.
- 2021: Increased M&A activity with Sulzer acquiring smaller, specialized technology firms to expand its water treatment portfolio.
- 2022: Evoqua Water Technologies expanding its advanced wastewater treatment solutions through strategic acquisitions.
- 2023: Introduction of AI-powered predictive maintenance platforms by several key players to optimize infrastructure longevity.
- 2024: Growing focus on nature-based solutions for stormwater management, with pilot projects demonstrating significant environmental and economic benefits.
In-Depth Water Infrastructure Construction Market Outlook
The future of the water infrastructure construction market is exceptionally promising, driven by sustained global demand for clean water and effective wastewater management. Growth accelerators, including ongoing technological innovation in smart water systems and advanced treatment processes, coupled with increasing government investments and a global push towards sustainability, will continue to fuel expansion. The market's trajectory suggests a significant increase in the adoption of digital solutions and resilient infrastructure designed to withstand the impacts of climate change. Strategic partnerships and expansion into emerging economies will further bolster market growth, presenting lucrative opportunities for stakeholders to contribute to essential infrastructure development. The market is expected to witness a continuous rise in investments, with a strong emphasis on efficiency, environmental compliance, and resource optimization, ensuring a robust outlook for the foreseeable future.
Water Infrastructure Construction Segmentation
-
1. Application
- 1.1. Public Facility
- 1.2. Industrial
- 1.3. Residential Building
-
2. Type
- 2.1. Applied water
- 2.2. Waste water
Water Infrastructure Construction Segmentation By Geography
-
1. North America
- 1.1. United States
- 1.2. Canada
- 1.3. Mexico
-
2. South America
- 2.1. Brazil
- 2.2. Argentina
- 2.3. Rest of South America
-
3. Europe
- 3.1. United Kingdom
- 3.2. Germany
- 3.3. France
- 3.4. Italy
- 3.5. Spain
- 3.6. Russia
- 3.7. Benelux
- 3.8. Nordics
- 3.9. Rest of Europe
-
4. Middle East & Africa
- 4.1. Turkey
- 4.2. Israel
- 4.3. GCC
- 4.4. North Africa
- 4.5. South Africa
- 4.6. Rest of Middle East & Africa
-
5. Asia Pacific
- 5.1. China
- 5.2. India
- 5.3. Japan
- 5.4. South Korea
- 5.5. ASEAN
- 5.6. Oceania
- 5.7. Rest of Asia Pacific
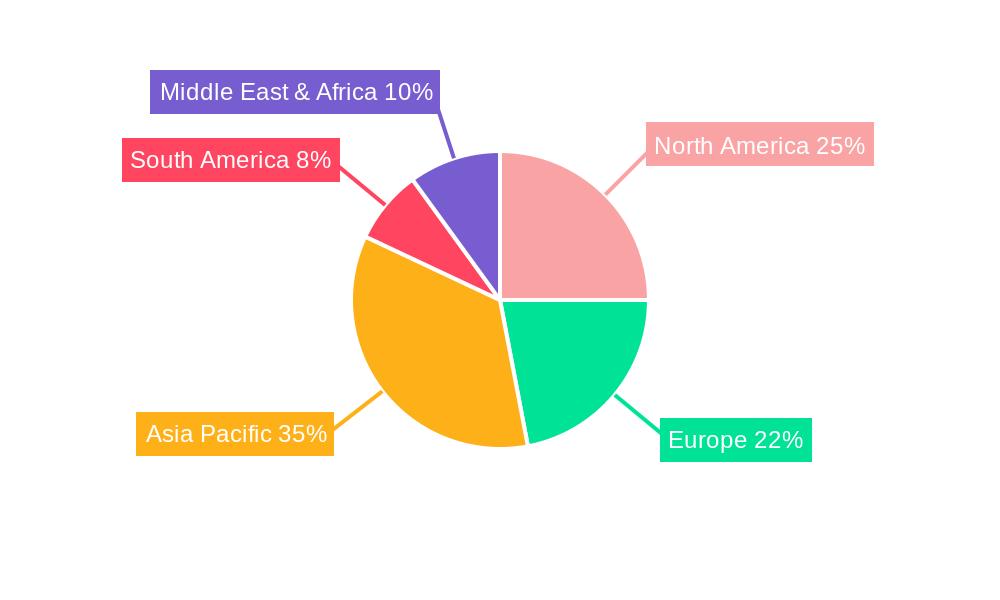
Water Infrastructure Construction Regional Market Share
Geographic Coverage of Water Infrastructure Construction
Water Infrastructure Construction REPORT HIGHLIGHTS
| Aspects | Details |
|---|---|
| Study Period | 2020-2034 |
| Base Year | 2025 |
| Estimated Year | 2026 |
| Forecast Period | 2026-2034 |
| Historical Period | 2020-2025 |
| Growth Rate | CAGR of XXX% from 2020-2034 |
| Segmentation |
|
Table of Contents
- 1. Introduction
- 1.1. Research Scope
- 1.2. Market Segmentation
- 1.3. Research Objective
- 1.4. Definitions and Assumptions
- 2. Executive Summary
- 2.1. Market Snapshot
- 3. Market Dynamics
- 3.1. Market Drivers
- 3.2. Market Restrains
- 3.3. Market Trends
- 3.4. Market Opportunities
- 4. Market Factor Analysis
- 4.1. Porters Five Forces
- 4.1.1. Bargaining Power of Suppliers
- 4.1.2. Bargaining Power of Buyers
- 4.1.3. Threat of New Entrants
- 4.1.4. Threat of Substitutes
- 4.1.5. Competitive Rivalry
- 4.2. PESTEL analysis
- 4.3. BCG Analysis
- 4.3.1. Stars (High Growth, High Market Share)
- 4.3.2. Cash Cows (Low Growth, High Market Share)
- 4.3.3. Question Mark (High Growth, Low Market Share)
- 4.3.4. Dogs (Low Growth, Low Market Share)
- 4.4. Ansoff Matrix Analysis
- 4.5. Supply Chain Analysis
- 4.6. Regulatory Landscape
- 4.7. Current Market Potential and Opportunity Assessment (TAM–SAM–SOM Framework)
- 4.8. VDR Analyst Note
- 4.1. Porters Five Forces
- 5. Market Analysis, Insights and Forecast 2021-2033
- 5.1. Market Analysis, Insights and Forecast - by Application
- 5.1.1. Public Facility
- 5.1.2. Industrial
- 5.1.3. Residential Building
- 5.2. Market Analysis, Insights and Forecast - by Type
- 5.2.1. Applied water
- 5.2.2. Waste water
- 5.3. Market Analysis, Insights and Forecast - by Region
- 5.3.1. North America
- 5.3.2. South America
- 5.3.3. Europe
- 5.3.4. Middle East & Africa
- 5.3.5. Asia Pacific
- 5.1. Market Analysis, Insights and Forecast - by Application
- 6. Global Water Infrastructure Construction Analysis, Insights and Forecast, 2021-2033
- 6.1. Market Analysis, Insights and Forecast - by Application
- 6.1.1. Public Facility
- 6.1.2. Industrial
- 6.1.3. Residential Building
- 6.2. Market Analysis, Insights and Forecast - by Type
- 6.2.1. Applied water
- 6.2.2. Waste water
- 6.1. Market Analysis, Insights and Forecast - by Application
- 7. North America Water Infrastructure Construction Analysis, Insights and Forecast, 2021-2033
- 7.1. Market Analysis, Insights and Forecast - by Application
- 7.1.1. Public Facility
- 7.1.2. Industrial
- 7.1.3. Residential Building
- 7.2. Market Analysis, Insights and Forecast - by Type
- 7.2.1. Applied water
- 7.2.2. Waste water
- 7.1. Market Analysis, Insights and Forecast - by Application
- 8. South America Water Infrastructure Construction Analysis, Insights and Forecast, 2021-2033
- 8.1. Market Analysis, Insights and Forecast - by Application
- 8.1.1. Public Facility
- 8.1.2. Industrial
- 8.1.3. Residential Building
- 8.2. Market Analysis, Insights and Forecast - by Type
- 8.2.1. Applied water
- 8.2.2. Waste water
- 8.1. Market Analysis, Insights and Forecast - by Application
- 9. Europe Water Infrastructure Construction Analysis, Insights and Forecast, 2021-2033
- 9.1. Market Analysis, Insights and Forecast - by Application
- 9.1.1. Public Facility
- 9.1.2. Industrial
- 9.1.3. Residential Building
- 9.2. Market Analysis, Insights and Forecast - by Type
- 9.2.1. Applied water
- 9.2.2. Waste water
- 9.1. Market Analysis, Insights and Forecast - by Application
- 10. Middle East & Africa Water Infrastructure Construction Analysis, Insights and Forecast, 2021-2033
- 10.1. Market Analysis, Insights and Forecast - by Application
- 10.1.1. Public Facility
- 10.1.2. Industrial
- 10.1.3. Residential Building
- 10.2. Market Analysis, Insights and Forecast - by Type
- 10.2.1. Applied water
- 10.2.2. Waste water
- 10.1. Market Analysis, Insights and Forecast - by Application
- 11. Asia Pacific Water Infrastructure Construction Analysis, Insights and Forecast, 2021-2033
- 11.1. Market Analysis, Insights and Forecast - by Application
- 11.1.1. Public Facility
- 11.1.2. Industrial
- 11.1.3. Residential Building
- 11.2. Market Analysis, Insights and Forecast - by Type
- 11.2.1. Applied water
- 11.2.2. Waste water
- 11.1. Market Analysis, Insights and Forecast - by Application
- 12. Competitive Analysis
- 12.1. Company Profiles
- 12.1.1 Xylem
- 12.1.1.1. Company Overview
- 12.1.1.2. Products
- 12.1.1.3. Company Financials
- 12.1.1.4. SWOT Analysis
- 12.1.2 Grundfos
- 12.1.2.1. Company Overview
- 12.1.2.2. Products
- 12.1.2.3. Company Financials
- 12.1.2.4. SWOT Analysis
- 12.1.3 Tyco International
- 12.1.3.1. Company Overview
- 12.1.3.2. Products
- 12.1.3.3. Company Financials
- 12.1.3.4. SWOT Analysis
- 12.1.4 Mueller Water Products
- 12.1.4.1. Company Overview
- 12.1.4.2. Products
- 12.1.4.3. Company Financials
- 12.1.4.4. SWOT Analysis
- 12.1.5 Danaher Corporation
- 12.1.5.1. Company Overview
- 12.1.5.2. Products
- 12.1.5.3. Company Financials
- 12.1.5.4. SWOT Analysis
- 12.1.6 Sulzer
- 12.1.6.1. Company Overview
- 12.1.6.2. Products
- 12.1.6.3. Company Financials
- 12.1.6.4. SWOT Analysis
- 12.1.7 Itron
- 12.1.7.1. Company Overview
- 12.1.7.2. Products
- 12.1.7.3. Company Financials
- 12.1.7.4. SWOT Analysis
- 12.1.8 KSB
- 12.1.8.1. Company Overview
- 12.1.8.2. Products
- 12.1.8.3. Company Financials
- 12.1.8.4. SWOT Analysis
- 12.1.9 Evoqua Water
- 12.1.9.1. Company Overview
- 12.1.9.2. Products
- 12.1.9.3. Company Financials
- 12.1.9.4. SWOT Analysis
- 12.1.10 United Rental
- 12.1.10.1. Company Overview
- 12.1.10.2. Products
- 12.1.10.3. Company Financials
- 12.1.10.4. SWOT Analysis
- 12.1.11 Kubota
- 12.1.11.1. Company Overview
- 12.1.11.2. Products
- 12.1.11.3. Company Financials
- 12.1.11.4. SWOT Analysis
- 12.1.12 Kurita Water Industries
- 12.1.12.1. Company Overview
- 12.1.12.2. Products
- 12.1.12.3. Company Financials
- 12.1.12.4. SWOT Analysis
- 12.1.1 Xylem
- 12.2. Market Entropy
- 12.2.1 Company's Key Areas Served
- 12.2.2 Recent Developments
- 12.3. Company Market Share Analysis 2025
- 12.3.1 Top 5 Companies Market Share Analysis
- 12.3.2 Top 3 Companies Market Share Analysis
- 12.4. List of Potential Customers
- 13. Research Methodology
List of Figures
- Figure 1: Global Water Infrastructure Construction Revenue Breakdown (million, %) by Region 2025 & 2033
- Figure 2: North America Water Infrastructure Construction Revenue (million), by Application 2025 & 2033
- Figure 3: North America Water Infrastructure Construction Revenue Share (%), by Application 2025 & 2033
- Figure 4: North America Water Infrastructure Construction Revenue (million), by Type 2025 & 2033
- Figure 5: North America Water Infrastructure Construction Revenue Share (%), by Type 2025 & 2033
- Figure 6: North America Water Infrastructure Construction Revenue (million), by Country 2025 & 2033
- Figure 7: North America Water Infrastructure Construction Revenue Share (%), by Country 2025 & 2033
- Figure 8: South America Water Infrastructure Construction Revenue (million), by Application 2025 & 2033
- Figure 9: South America Water Infrastructure Construction Revenue Share (%), by Application 2025 & 2033
- Figure 10: South America Water Infrastructure Construction Revenue (million), by Type 2025 & 2033
- Figure 11: South America Water Infrastructure Construction Revenue Share (%), by Type 2025 & 2033
- Figure 12: South America Water Infrastructure Construction Revenue (million), by Country 2025 & 2033
- Figure 13: South America Water Infrastructure Construction Revenue Share (%), by Country 2025 & 2033
- Figure 14: Europe Water Infrastructure Construction Revenue (million), by Application 2025 & 2033
- Figure 15: Europe Water Infrastructure Construction Revenue Share (%), by Application 2025 & 2033
- Figure 16: Europe Water Infrastructure Construction Revenue (million), by Type 2025 & 2033
- Figure 17: Europe Water Infrastructure Construction Revenue Share (%), by Type 2025 & 2033
- Figure 18: Europe Water Infrastructure Construction Revenue (million), by Country 2025 & 2033
- Figure 19: Europe Water Infrastructure Construction Revenue Share (%), by Country 2025 & 2033
- Figure 20: Middle East & Africa Water Infrastructure Construction Revenue (million), by Application 2025 & 2033
- Figure 21: Middle East & Africa Water Infrastructure Construction Revenue Share (%), by Application 2025 & 2033
- Figure 22: Middle East & Africa Water Infrastructure Construction Revenue (million), by Type 2025 & 2033
- Figure 23: Middle East & Africa Water Infrastructure Construction Revenue Share (%), by Type 2025 & 2033
- Figure 24: Middle East & Africa Water Infrastructure Construction Revenue (million), by Country 2025 & 2033
- Figure 25: Middle East & Africa Water Infrastructure Construction Revenue Share (%), by Country 2025 & 2033
- Figure 26: Asia Pacific Water Infrastructure Construction Revenue (million), by Application 2025 & 2033
- Figure 27: Asia Pacific Water Infrastructure Construction Revenue Share (%), by Application 2025 & 2033
- Figure 28: Asia Pacific Water Infrastructure Construction Revenue (million), by Type 2025 & 2033
- Figure 29: Asia Pacific Water Infrastructure Construction Revenue Share (%), by Type 2025 & 2033
- Figure 30: Asia Pacific Water Infrastructure Construction Revenue (million), by Country 2025 & 2033
- Figure 31: Asia Pacific Water Infrastructure Construction Revenue Share (%), by Country 2025 & 2033
List of Tables
- Table 1: Global Water Infrastructure Construction Revenue million Forecast, by Application 2020 & 2033
- Table 2: Global Water Infrastructure Construction Revenue million Forecast, by Type 2020 & 2033
- Table 3: Global Water Infrastructure Construction Revenue million Forecast, by Region 2020 & 2033
- Table 4: Global Water Infrastructure Construction Revenue million Forecast, by Application 2020 & 2033
- Table 5: Global Water Infrastructure Construction Revenue million Forecast, by Type 2020 & 2033
- Table 6: Global Water Infrastructure Construction Revenue million Forecast, by Country 2020 & 2033
- Table 7: United States Water Infrastructure Construction Revenue (million) Forecast, by Application 2020 & 2033
- Table 8: Canada Water Infrastructure Construction Revenue (million) Forecast, by Application 2020 & 2033
- Table 9: Mexico Water Infrastructure Construction Revenue (million) Forecast, by Application 2020 & 2033
- Table 10: Global Water Infrastructure Construction Revenue million Forecast, by Application 2020 & 2033
- Table 11: Global Water Infrastructure Construction Revenue million Forecast, by Type 2020 & 2033
- Table 12: Global Water Infrastructure Construction Revenue million Forecast, by Country 2020 & 2033
- Table 13: Brazil Water Infrastructure Construction Revenue (million) Forecast, by Application 2020 & 2033
- Table 14: Argentina Water Infrastructure Construction Revenue (million) Forecast, by Application 2020 & 2033
- Table 15: Rest of South America Water Infrastructure Construction Revenue (million) Forecast, by Application 2020 & 2033
- Table 16: Global Water Infrastructure Construction Revenue million Forecast, by Application 2020 & 2033
- Table 17: Global Water Infrastructure Construction Revenue million Forecast, by Type 2020 & 2033
- Table 18: Global Water Infrastructure Construction Revenue million Forecast, by Country 2020 & 2033
- Table 19: United Kingdom Water Infrastructure Construction Revenue (million) Forecast, by Application 2020 & 2033
- Table 20: Germany Water Infrastructure Construction Revenue (million) Forecast, by Application 2020 & 2033
- Table 21: France Water Infrastructure Construction Revenue (million) Forecast, by Application 2020 & 2033
- Table 22: Italy Water Infrastructure Construction Revenue (million) Forecast, by Application 2020 & 2033
- Table 23: Spain Water Infrastructure Construction Revenue (million) Forecast, by Application 2020 & 2033
- Table 24: Russia Water Infrastructure Construction Revenue (million) Forecast, by Application 2020 & 2033
- Table 25: Benelux Water Infrastructure Construction Revenue (million) Forecast, by Application 2020 & 2033
- Table 26: Nordics Water Infrastructure Construction Revenue (million) Forecast, by Application 2020 & 2033
- Table 27: Rest of Europe Water Infrastructure Construction Revenue (million) Forecast, by Application 2020 & 2033
- Table 28: Global Water Infrastructure Construction Revenue million Forecast, by Application 2020 & 2033
- Table 29: Global Water Infrastructure Construction Revenue million Forecast, by Type 2020 & 2033
- Table 30: Global Water Infrastructure Construction Revenue million Forecast, by Country 2020 & 2033
- Table 31: Turkey Water Infrastructure Construction Revenue (million) Forecast, by Application 2020 & 2033
- Table 32: Israel Water Infrastructure Construction Revenue (million) Forecast, by Application 2020 & 2033
- Table 33: GCC Water Infrastructure Construction Revenue (million) Forecast, by Application 2020 & 2033
- Table 34: North Africa Water Infrastructure Construction Revenue (million) Forecast, by Application 2020 & 2033
- Table 35: South Africa Water Infrastructure Construction Revenue (million) Forecast, by Application 2020 & 2033
- Table 36: Rest of Middle East & Africa Water Infrastructure Construction Revenue (million) Forecast, by Application 2020 & 2033
- Table 37: Global Water Infrastructure Construction Revenue million Forecast, by Application 2020 & 2033
- Table 38: Global Water Infrastructure Construction Revenue million Forecast, by Type 2020 & 2033
- Table 39: Global Water Infrastructure Construction Revenue million Forecast, by Country 2020 & 2033
- Table 40: China Water Infrastructure Construction Revenue (million) Forecast, by Application 2020 & 2033
- Table 41: India Water Infrastructure Construction Revenue (million) Forecast, by Application 2020 & 2033
- Table 42: Japan Water Infrastructure Construction Revenue (million) Forecast, by Application 2020 & 2033
- Table 43: South Korea Water Infrastructure Construction Revenue (million) Forecast, by Application 2020 & 2033
- Table 44: ASEAN Water Infrastructure Construction Revenue (million) Forecast, by Application 2020 & 2033
- Table 45: Oceania Water Infrastructure Construction Revenue (million) Forecast, by Application 2020 & 2033
- Table 46: Rest of Asia Pacific Water Infrastructure Construction Revenue (million) Forecast, by Application 2020 & 2033
Frequently Asked Questions
1. What is the projected Compound Annual Growth Rate (CAGR) of the Water Infrastructure Construction?
The projected CAGR is approximately XXX%.
2. Which companies are prominent players in the Water Infrastructure Construction?
Key companies in the market include Xylem, Grundfos, Tyco International, Mueller Water Products, Danaher Corporation, Sulzer, Itron, KSB, Evoqua Water, United Rental, Kubota, Kurita Water Industries.
3. What are the main segments of the Water Infrastructure Construction?
The market segments include Application, Type.
4. Can you provide details about the market size?
The market size is estimated to be USD XXX million as of 2022.
5. What are some drivers contributing to market growth?
N/A
6. What are the notable trends driving market growth?
N/A
7. Are there any restraints impacting market growth?
N/A
8. Can you provide examples of recent developments in the market?
N/A
9. What pricing options are available for accessing the report?
Pricing options include single-user, multi-user, and enterprise licenses priced at USD 3950.00, USD 5925.00, and USD 7900.00 respectively.
10. Is the market size provided in terms of value or volume?
The market size is provided in terms of value, measured in million.
11. Are there any specific market keywords associated with the report?
Yes, the market keyword associated with the report is "Water Infrastructure Construction," which aids in identifying and referencing the specific market segment covered.
12. How do I determine which pricing option suits my needs best?
The pricing options vary based on user requirements and access needs. Individual users may opt for single-user licenses, while businesses requiring broader access may choose multi-user or enterprise licenses for cost-effective access to the report.
13. Are there any additional resources or data provided in the Water Infrastructure Construction report?
While the report offers comprehensive insights, it's advisable to review the specific contents or supplementary materials provided to ascertain if additional resources or data are available.
14. How can I stay updated on further developments or reports in the Water Infrastructure Construction?
To stay informed about further developments, trends, and reports in the Water Infrastructure Construction, consider subscribing to industry newsletters, following relevant companies and organizations, or regularly checking reputable industry news sources and publications.
Methodology
Step 1 - Identification of Relevant Samples Size from Population Database


Step 2 - Approaches for Defining Global Market Size (Value, Volume* & Price*)

Note*: In applicable scenarios
Step 3 - Data Sources
Primary Research
- Web Analytics
- Survey Reports
- Research Institute
- Latest Research Reports
- Opinion Leaders
Secondary Research
- Annual Reports
- White Paper
- Latest Press Release
- Industry Association
- Paid Database
- Investor Presentations

Step 4 - Data Triangulation
Involves using different sources of information in order to increase the validity of a study
These sources are likely to be stakeholders in a program - participants, other researchers, program staff, other community members, and so on.
Then we put all data in single framework & apply various statistical tools to find out the dynamic on the market.
During the analysis stage, feedback from the stakeholder groups would be compared to determine areas of agreement as well as areas of divergence