

Key Insights
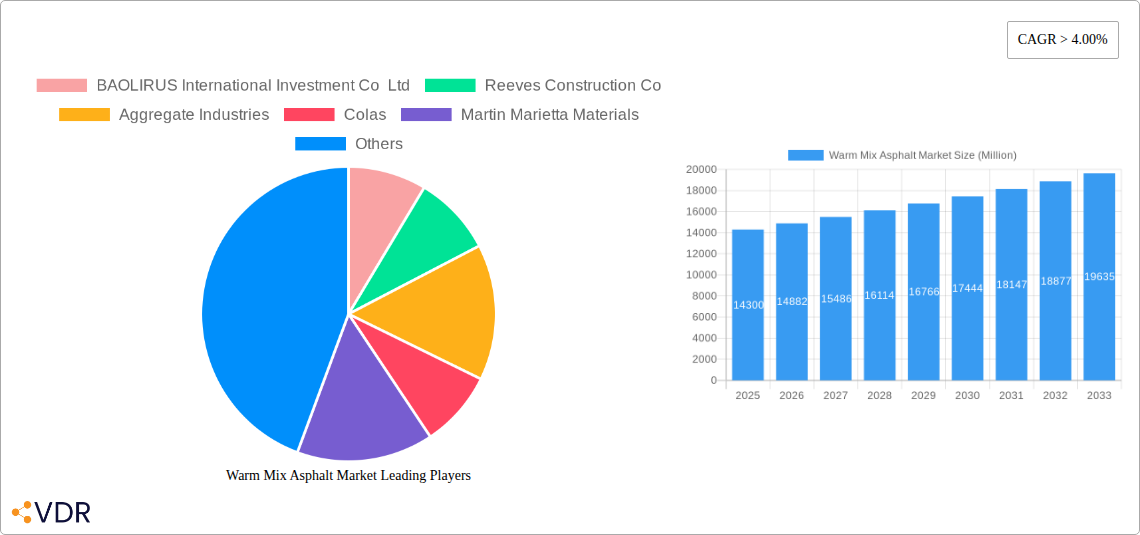
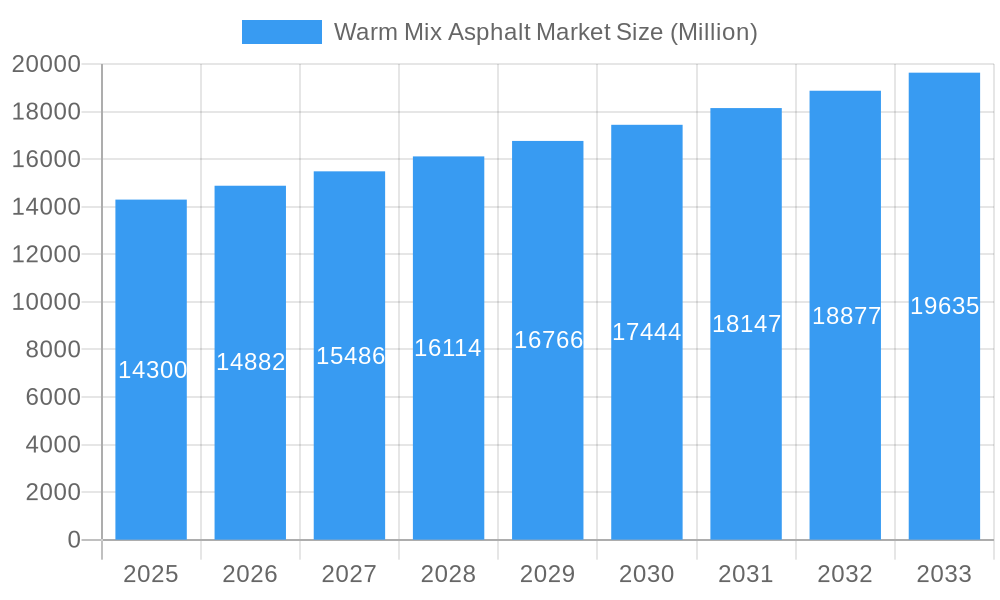
The Warm Mix Asphalt (WMA) market, valued at $14,300 million in 2025, is projected to experience robust growth, exhibiting a Compound Annual Growth Rate (CAGR) exceeding 4.00% from 2025 to 2033. This expansion is driven by several key factors. Increasing infrastructure development globally, particularly in rapidly developing economies within Asia-Pacific and the Middle East, fuels significant demand for WMA. Its environmentally friendly attributes, such as reduced emissions during production and application, align with growing sustainability concerns and stringent environmental regulations worldwide. Furthermore, WMA's improved workability and extended paving seasons, especially beneficial in colder climates, enhance its competitiveness against traditional hot mix asphalt. The diverse application across pavements, roadways, and driveways further contributes to market growth. Leading companies like BAOLIRUS International Investment Co Ltd, Aggregate Industries, Colas, and Martin Marietta Materials are strategically investing in research and development to enhance WMA's performance characteristics and expand its applications, driving innovation within the market.
Warm Mix Asphalt Market Market Size (In Billion)
However, the market faces certain challenges. Fluctuations in raw material prices, particularly bitumen, can impact profitability and affect WMA's overall cost-competitiveness. Furthermore, the need for specialized equipment and skilled labor for WMA production and application might pose an entry barrier for smaller players. Despite these constraints, the long-term outlook remains positive, fueled by ongoing infrastructure investments and the increasing preference for sustainable construction materials. The market segmentation by application (pavements, roadways, driveways, and others) provides diverse avenues for growth, with pavements and roadways expected to dominate the market share due to the extensive requirement for road construction and maintenance globally. Regional variations in growth rates are expected, reflecting differences in infrastructure spending and regulatory landscapes across various regions, including North America, Europe, Asia-Pacific, South America, and the Middle East & Africa.
Warm Mix Asphalt Market Company Market Share
Warm Mix Asphalt Market: A Comprehensive Report (2019-2033)
This comprehensive report provides an in-depth analysis of the Warm Mix Asphalt (WMA) market, encompassing market dynamics, growth trends, regional dominance, product landscape, challenges, opportunities, and key players. The study covers the historical period (2019-2024), base year (2025), and forecast period (2025-2033), offering valuable insights for industry professionals, investors, and stakeholders. The report segments the market by application (Pavements, Roadways, Driveways, Others) offering a granular view of this rapidly evolving sector. The total market value is predicted to reach xx Million by 2033.
Warm Mix Asphalt Market Dynamics & Structure
The Warm Mix Asphalt market is characterized by moderate concentration, with several key players dominating significant market shares. Technological innovation, driven by the need for sustainable and cost-effective road construction, is a key driver. Stringent environmental regulations concerning carbon emissions are also shaping market dynamics, pushing adoption of WMA. Competitive substitutes, such as traditional hot mix asphalt, continue to exist, but WMA's advantages in terms of reduced energy consumption and improved performance are gradually increasing its market penetration. The market has witnessed several mergers and acquisitions (M&A) in recent years, primarily focused on expanding geographical reach and product portfolios.
- Market Concentration: Moderately concentrated, with top 5 players holding approximately xx% market share in 2025.
- Technological Innovation: Focus on improving binder formulations, additives, and production processes to enhance WMA performance and reduce environmental impact.
- Regulatory Framework: Increasingly stringent environmental regulations favoring sustainable construction materials are driving WMA adoption.
- Competitive Substitutes: Hot mix asphalt remains a key competitor, but WMA's advantages in terms of reduced emissions and lower production costs are eroding its market share.
- M&A Activity: xx M&A deals were recorded between 2019 and 2024, primarily driven by expansion strategies.
- End-User Demographics: Primarily driven by government agencies and private construction companies involved in road infrastructure development.
Warm Mix Asphalt Market Growth Trends & Insights
The WMA market exhibits a steady growth trajectory, driven by increasing infrastructure development globally and a growing emphasis on sustainable construction practices. The market size is projected to expand at a CAGR of xx% during the forecast period (2025-2033). Technological advancements, such as the development of advanced binder formulations and improved mixing techniques, are further accelerating adoption rates. Changing consumer preferences toward environmentally friendly solutions are also influencing market growth. Market penetration is expected to increase from xx% in 2025 to xx% by 2033.
Dominant Regions, Countries, or Segments in Warm Mix Asphalt Market
North America currently holds the largest market share in the WMA market, driven by robust infrastructure spending and stringent environmental regulations. The Pavements segment dominates the application-based market, accounting for the majority of WMA consumption.
- Key Drivers in North America: Significant investments in road infrastructure projects, supportive government policies promoting sustainable construction, and a growing awareness of environmental concerns.
- Dominance Factors: Strong economic growth, well-established construction industry, and early adoption of WMA technology.
- Growth Potential: Continued investment in infrastructure modernization and increasing focus on reducing carbon emissions will fuel market expansion.
- Other key Regions: Europe, Asia-Pacific, and the Middle East are expected to witness significant growth in WMA adoption.
Warm Mix Asphalt Market Product Landscape
WMA products are characterized by diverse binder formulations, additives, and production methods, each offering unique properties and performance characteristics. Recent innovations have focused on developing WMA mixes with enhanced durability, lower energy consumption, and reduced environmental impact. These advancements aim to address specific application requirements, from high-traffic roadways to residential driveways. Unique selling propositions include improved workability, reduced emissions, cost savings, and enhanced pavement life.
Key Drivers, Barriers & Challenges in Warm Mix Asphalt Market
Key Drivers:
- Increasing government investments in infrastructure development.
- Growing demand for sustainable and environmentally friendly construction materials.
- Technological advancements leading to improved WMA performance and cost-effectiveness.
Challenges:
- Higher initial investment costs compared to traditional hot mix asphalt.
- Lack of awareness and knowledge among contractors regarding WMA application.
- Potential supply chain disruptions affecting the availability of raw materials and additives. (Estimated impact: xx% reduction in production in worst-case scenarios).
Emerging Opportunities in Warm Mix Asphalt Market
Untapped markets in developing economies present significant opportunities for WMA growth. Innovative applications, such as the use of WMA in airport runways and railway tracks, are emerging. Evolving consumer preferences toward environmentally responsible construction practices will further drive demand.
Growth Accelerators in the Warm Mix Asphalt Market Industry
Technological breakthroughs, such as the development of new binder formulations and improved production technologies, will continue to drive market growth. Strategic partnerships between WMA manufacturers and construction companies are also expected to accelerate market expansion. Expanding into new geographical markets and exploring novel applications will further stimulate growth.
Key Players Shaping the Warm Mix Asphalt Market Market
- BAOLIRUS International Investment Co Ltd
- Reeves Construction Co
- Aggregate Industries
- Colas
- Martin Marietta Materials
- Blue Diamond Asphalt
- Zydex Industries
- PJ Keating
- Prospect Hill Road
- Americas Materials Inc
Notable Milestones in Warm Mix Asphalt Market Sector
- June 2022: Aggregate Industries announced the transition to WMA manufacturing as a standard across its asphalt product portfolio, highlighting its commitment to sustainability and cost reduction.
In-Depth Warm Mix Asphalt Market Market Outlook
The WMA market is poised for significant growth, driven by several factors, including increasing infrastructure spending, rising environmental concerns, and technological advancements. The focus on sustainability and cost optimization will further propel market expansion. Strategic partnerships and market expansion into new regions will contribute to long-term growth, creating numerous opportunities for existing and new market entrants.
Warm Mix Asphalt Market Segmentation
-
1. Application
- 1.1. Pavements
- 1.2. Roadways
- 1.3. Driveways
- 1.4. Others Applications
Warm Mix Asphalt Market Segmentation By Geography
-
1. Asia Pacific
- 1.1. China
- 1.2. India
- 1.3. Japan
- 1.4. South Korea
- 1.5. Rest of Asia Pacific
-
2. North America
- 2.1. United States
- 2.2. Canada
- 2.3. Mexico
-
3. Europe
- 3.1. Germany
- 3.2. United Kingdom
- 3.3. Italy
- 3.4. France
- 3.5. Rest of Europe
-
4. South America
- 4.1. Brazil
- 4.2. Argentina
- 4.3. Rest of South America
-
5. Middle East and Africa
- 5.1. Saudi Arabia
- 5.2. South Africa
- 5.3. Rest of Middle East and Africa
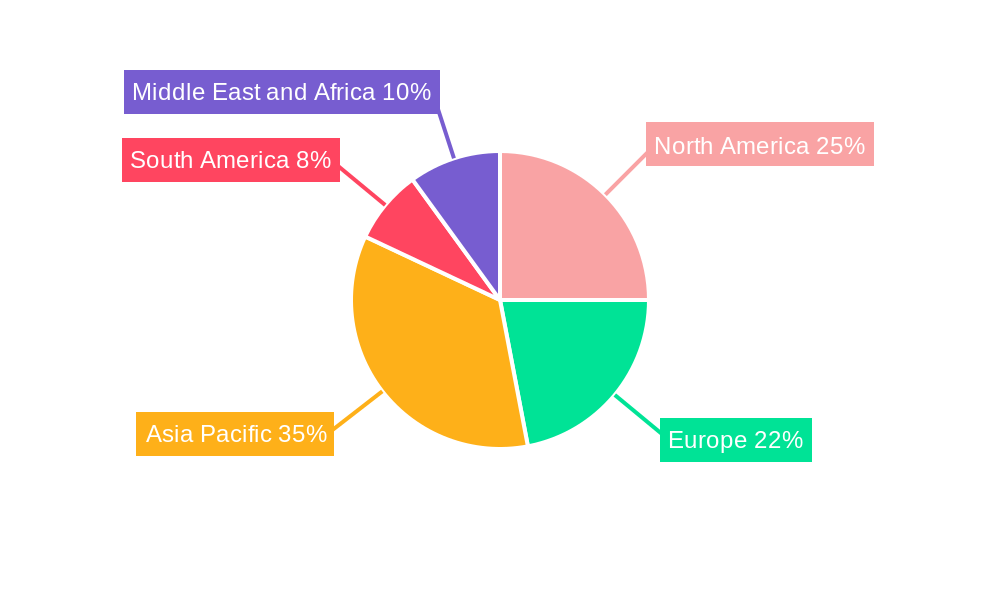
Warm Mix Asphalt Market Regional Market Share
Geographic Coverage of Warm Mix Asphalt Market
Warm Mix Asphalt Market REPORT HIGHLIGHTS
| Aspects | Details |
|---|---|
| Study Period | 2020-2034 |
| Base Year | 2025 |
| Estimated Year | 2026 |
| Forecast Period | 2026-2034 |
| Historical Period | 2020-2025 |
| Growth Rate | CAGR of > 4.00% from 2020-2034 |
| Segmentation |
|
Table of Contents
- 1. Introduction
- 1.1. Research Scope
- 1.2. Market Segmentation
- 1.3. Research Objective
- 1.4. Definitions and Assumptions
- 2. Executive Summary
- 2.1. Market Snapshot
- 3. Market Dynamics
- 3.1. Market Drivers
- 3.2. Market Restrains
- 3.3. Market Trends
- 3.4. Market Opportunities
- 4. Market Factor Analysis
- 4.1. Porters Five Forces
- 4.1.1. Bargaining Power of Suppliers
- 4.1.2. Bargaining Power of Buyers
- 4.1.3. Threat of New Entrants
- 4.1.4. Threat of Substitutes
- 4.1.5. Competitive Rivalry
- 4.2. PESTEL analysis
- 4.3. BCG Analysis
- 4.3.1. Stars (High Growth, High Market Share)
- 4.3.2. Cash Cows (Low Growth, High Market Share)
- 4.3.3. Question Mark (High Growth, Low Market Share)
- 4.3.4. Dogs (Low Growth, Low Market Share)
- 4.4. Ansoff Matrix Analysis
- 4.5. Supply Chain Analysis
- 4.6. Regulatory Landscape
- 4.7. Current Market Potential and Opportunity Assessment (TAM–SAM–SOM Framework)
- 4.8. VDR Analyst Note
- 4.1. Porters Five Forces
- 5. Market Analysis, Insights and Forecast 2021-2033
- 5.1. Market Analysis, Insights and Forecast - by Application
- 5.1.1. Pavements
- 5.1.2. Roadways
- 5.1.3. Driveways
- 5.1.4. Others Applications
- 5.2. Market Analysis, Insights and Forecast - by Region
- 5.2.1. Asia Pacific
- 5.2.2. North America
- 5.2.3. Europe
- 5.2.4. South America
- 5.2.5. Middle East and Africa
- 5.1. Market Analysis, Insights and Forecast - by Application
- 6. Global Warm Mix Asphalt Market Analysis, Insights and Forecast, 2021-2033
- 6.1. Market Analysis, Insights and Forecast - by Application
- 6.1.1. Pavements
- 6.1.2. Roadways
- 6.1.3. Driveways
- 6.1.4. Others Applications
- 6.1. Market Analysis, Insights and Forecast - by Application
- 7. Asia Pacific Warm Mix Asphalt Market Analysis, Insights and Forecast, 2021-2033
- 7.1. Market Analysis, Insights and Forecast - by Application
- 7.1.1. Pavements
- 7.1.2. Roadways
- 7.1.3. Driveways
- 7.1.4. Others Applications
- 7.1. Market Analysis, Insights and Forecast - by Application
- 8. North America Warm Mix Asphalt Market Analysis, Insights and Forecast, 2021-2033
- 8.1. Market Analysis, Insights and Forecast - by Application
- 8.1.1. Pavements
- 8.1.2. Roadways
- 8.1.3. Driveways
- 8.1.4. Others Applications
- 8.1. Market Analysis, Insights and Forecast - by Application
- 9. Europe Warm Mix Asphalt Market Analysis, Insights and Forecast, 2021-2033
- 9.1. Market Analysis, Insights and Forecast - by Application
- 9.1.1. Pavements
- 9.1.2. Roadways
- 9.1.3. Driveways
- 9.1.4. Others Applications
- 9.1. Market Analysis, Insights and Forecast - by Application
- 10. South America Warm Mix Asphalt Market Analysis, Insights and Forecast, 2021-2033
- 10.1. Market Analysis, Insights and Forecast - by Application
- 10.1.1. Pavements
- 10.1.2. Roadways
- 10.1.3. Driveways
- 10.1.4. Others Applications
- 10.1. Market Analysis, Insights and Forecast - by Application
- 11. Middle East and Africa Warm Mix Asphalt Market Analysis, Insights and Forecast, 2021-2033
- 11.1. Market Analysis, Insights and Forecast - by Application
- 11.1.1. Pavements
- 11.1.2. Roadways
- 11.1.3. Driveways
- 11.1.4. Others Applications
- 11.1. Market Analysis, Insights and Forecast - by Application
- 12. Competitive Analysis
- 12.1. Company Profiles
- 12.1.1 BAOLIRUS International Investment Co Ltd
- 12.1.1.1. Company Overview
- 12.1.1.2. Products
- 12.1.1.3. Company Financials
- 12.1.1.4. SWOT Analysis
- 12.1.2 Reeves Construction Co
- 12.1.2.1. Company Overview
- 12.1.2.2. Products
- 12.1.2.3. Company Financials
- 12.1.2.4. SWOT Analysis
- 12.1.3 Aggregate Industries
- 12.1.3.1. Company Overview
- 12.1.3.2. Products
- 12.1.3.3. Company Financials
- 12.1.3.4. SWOT Analysis
- 12.1.4 Colas
- 12.1.4.1. Company Overview
- 12.1.4.2. Products
- 12.1.4.3. Company Financials
- 12.1.4.4. SWOT Analysis
- 12.1.5 Martin Marietta Materials
- 12.1.5.1. Company Overview
- 12.1.5.2. Products
- 12.1.5.3. Company Financials
- 12.1.5.4. SWOT Analysis
- 12.1.6 Blue Diamond Asphalt
- 12.1.6.1. Company Overview
- 12.1.6.2. Products
- 12.1.6.3. Company Financials
- 12.1.6.4. SWOT Analysis
- 12.1.7 Zydex Industries*List Not Exhaustive
- 12.1.7.1. Company Overview
- 12.1.7.2. Products
- 12.1.7.3. Company Financials
- 12.1.7.4. SWOT Analysis
- 12.1.8 PJ Keating
- 12.1.8.1. Company Overview
- 12.1.8.2. Products
- 12.1.8.3. Company Financials
- 12.1.8.4. SWOT Analysis
- 12.1.9 Prospect Hill Road
- 12.1.9.1. Company Overview
- 12.1.9.2. Products
- 12.1.9.3. Company Financials
- 12.1.9.4. SWOT Analysis
- 12.1.10 Americas Materials Inc
- 12.1.10.1. Company Overview
- 12.1.10.2. Products
- 12.1.10.3. Company Financials
- 12.1.10.4. SWOT Analysis
- 12.1.1 BAOLIRUS International Investment Co Ltd
- 12.2. Market Entropy
- 12.2.1 Company's Key Areas Served
- 12.2.2 Recent Developments
- 12.3. Company Market Share Analysis 2025
- 12.3.1 Top 5 Companies Market Share Analysis
- 12.3.2 Top 3 Companies Market Share Analysis
- 12.4. List of Potential Customers
- 13. Research Methodology
List of Figures
- Figure 1: Global Warm Mix Asphalt Market Revenue Breakdown (Million, %) by Region 2025 & 2033
- Figure 2: Global Warm Mix Asphalt Market Volume Breakdown (K Tons, %) by Region 2025 & 2033
- Figure 3: Asia Pacific Warm Mix Asphalt Market Revenue (Million), by Application 2025 & 2033
- Figure 4: Asia Pacific Warm Mix Asphalt Market Volume (K Tons), by Application 2025 & 2033
- Figure 5: Asia Pacific Warm Mix Asphalt Market Revenue Share (%), by Application 2025 & 2033
- Figure 6: Asia Pacific Warm Mix Asphalt Market Volume Share (%), by Application 2025 & 2033
- Figure 7: Asia Pacific Warm Mix Asphalt Market Revenue (Million), by Country 2025 & 2033
- Figure 8: Asia Pacific Warm Mix Asphalt Market Volume (K Tons), by Country 2025 & 2033
- Figure 9: Asia Pacific Warm Mix Asphalt Market Revenue Share (%), by Country 2025 & 2033
- Figure 10: Asia Pacific Warm Mix Asphalt Market Volume Share (%), by Country 2025 & 2033
- Figure 11: North America Warm Mix Asphalt Market Revenue (Million), by Application 2025 & 2033
- Figure 12: North America Warm Mix Asphalt Market Volume (K Tons), by Application 2025 & 2033
- Figure 13: North America Warm Mix Asphalt Market Revenue Share (%), by Application 2025 & 2033
- Figure 14: North America Warm Mix Asphalt Market Volume Share (%), by Application 2025 & 2033
- Figure 15: North America Warm Mix Asphalt Market Revenue (Million), by Country 2025 & 2033
- Figure 16: North America Warm Mix Asphalt Market Volume (K Tons), by Country 2025 & 2033
- Figure 17: North America Warm Mix Asphalt Market Revenue Share (%), by Country 2025 & 2033
- Figure 18: North America Warm Mix Asphalt Market Volume Share (%), by Country 2025 & 2033
- Figure 19: Europe Warm Mix Asphalt Market Revenue (Million), by Application 2025 & 2033
- Figure 20: Europe Warm Mix Asphalt Market Volume (K Tons), by Application 2025 & 2033
- Figure 21: Europe Warm Mix Asphalt Market Revenue Share (%), by Application 2025 & 2033
- Figure 22: Europe Warm Mix Asphalt Market Volume Share (%), by Application 2025 & 2033
- Figure 23: Europe Warm Mix Asphalt Market Revenue (Million), by Country 2025 & 2033
- Figure 24: Europe Warm Mix Asphalt Market Volume (K Tons), by Country 2025 & 2033
- Figure 25: Europe Warm Mix Asphalt Market Revenue Share (%), by Country 2025 & 2033
- Figure 26: Europe Warm Mix Asphalt Market Volume Share (%), by Country 2025 & 2033
- Figure 27: South America Warm Mix Asphalt Market Revenue (Million), by Application 2025 & 2033
- Figure 28: South America Warm Mix Asphalt Market Volume (K Tons), by Application 2025 & 2033
- Figure 29: South America Warm Mix Asphalt Market Revenue Share (%), by Application 2025 & 2033
- Figure 30: South America Warm Mix Asphalt Market Volume Share (%), by Application 2025 & 2033
- Figure 31: South America Warm Mix Asphalt Market Revenue (Million), by Country 2025 & 2033
- Figure 32: South America Warm Mix Asphalt Market Volume (K Tons), by Country 2025 & 2033
- Figure 33: South America Warm Mix Asphalt Market Revenue Share (%), by Country 2025 & 2033
- Figure 34: South America Warm Mix Asphalt Market Volume Share (%), by Country 2025 & 2033
- Figure 35: Middle East and Africa Warm Mix Asphalt Market Revenue (Million), by Application 2025 & 2033
- Figure 36: Middle East and Africa Warm Mix Asphalt Market Volume (K Tons), by Application 2025 & 2033
- Figure 37: Middle East and Africa Warm Mix Asphalt Market Revenue Share (%), by Application 2025 & 2033
- Figure 38: Middle East and Africa Warm Mix Asphalt Market Volume Share (%), by Application 2025 & 2033
- Figure 39: Middle East and Africa Warm Mix Asphalt Market Revenue (Million), by Country 2025 & 2033
- Figure 40: Middle East and Africa Warm Mix Asphalt Market Volume (K Tons), by Country 2025 & 2033
- Figure 41: Middle East and Africa Warm Mix Asphalt Market Revenue Share (%), by Country 2025 & 2033
- Figure 42: Middle East and Africa Warm Mix Asphalt Market Volume Share (%), by Country 2025 & 2033
List of Tables
- Table 1: Global Warm Mix Asphalt Market Revenue Million Forecast, by Application 2020 & 2033
- Table 2: Global Warm Mix Asphalt Market Volume K Tons Forecast, by Application 2020 & 2033
- Table 3: Global Warm Mix Asphalt Market Revenue Million Forecast, by Region 2020 & 2033
- Table 4: Global Warm Mix Asphalt Market Volume K Tons Forecast, by Region 2020 & 2033
- Table 5: Global Warm Mix Asphalt Market Revenue Million Forecast, by Application 2020 & 2033
- Table 6: Global Warm Mix Asphalt Market Volume K Tons Forecast, by Application 2020 & 2033
- Table 7: Global Warm Mix Asphalt Market Revenue Million Forecast, by Country 2020 & 2033
- Table 8: Global Warm Mix Asphalt Market Volume K Tons Forecast, by Country 2020 & 2033
- Table 9: China Warm Mix Asphalt Market Revenue (Million) Forecast, by Application 2020 & 2033
- Table 10: China Warm Mix Asphalt Market Volume (K Tons) Forecast, by Application 2020 & 2033
- Table 11: India Warm Mix Asphalt Market Revenue (Million) Forecast, by Application 2020 & 2033
- Table 12: India Warm Mix Asphalt Market Volume (K Tons) Forecast, by Application 2020 & 2033
- Table 13: Japan Warm Mix Asphalt Market Revenue (Million) Forecast, by Application 2020 & 2033
- Table 14: Japan Warm Mix Asphalt Market Volume (K Tons) Forecast, by Application 2020 & 2033
- Table 15: South Korea Warm Mix Asphalt Market Revenue (Million) Forecast, by Application 2020 & 2033
- Table 16: South Korea Warm Mix Asphalt Market Volume (K Tons) Forecast, by Application 2020 & 2033
- Table 17: Rest of Asia Pacific Warm Mix Asphalt Market Revenue (Million) Forecast, by Application 2020 & 2033
- Table 18: Rest of Asia Pacific Warm Mix Asphalt Market Volume (K Tons) Forecast, by Application 2020 & 2033
- Table 19: Global Warm Mix Asphalt Market Revenue Million Forecast, by Application 2020 & 2033
- Table 20: Global Warm Mix Asphalt Market Volume K Tons Forecast, by Application 2020 & 2033
- Table 21: Global Warm Mix Asphalt Market Revenue Million Forecast, by Country 2020 & 2033
- Table 22: Global Warm Mix Asphalt Market Volume K Tons Forecast, by Country 2020 & 2033
- Table 23: United States Warm Mix Asphalt Market Revenue (Million) Forecast, by Application 2020 & 2033
- Table 24: United States Warm Mix Asphalt Market Volume (K Tons) Forecast, by Application 2020 & 2033
- Table 25: Canada Warm Mix Asphalt Market Revenue (Million) Forecast, by Application 2020 & 2033
- Table 26: Canada Warm Mix Asphalt Market Volume (K Tons) Forecast, by Application 2020 & 2033
- Table 27: Mexico Warm Mix Asphalt Market Revenue (Million) Forecast, by Application 2020 & 2033
- Table 28: Mexico Warm Mix Asphalt Market Volume (K Tons) Forecast, by Application 2020 & 2033
- Table 29: Global Warm Mix Asphalt Market Revenue Million Forecast, by Application 2020 & 2033
- Table 30: Global Warm Mix Asphalt Market Volume K Tons Forecast, by Application 2020 & 2033
- Table 31: Global Warm Mix Asphalt Market Revenue Million Forecast, by Country 2020 & 2033
- Table 32: Global Warm Mix Asphalt Market Volume K Tons Forecast, by Country 2020 & 2033
- Table 33: Germany Warm Mix Asphalt Market Revenue (Million) Forecast, by Application 2020 & 2033
- Table 34: Germany Warm Mix Asphalt Market Volume (K Tons) Forecast, by Application 2020 & 2033
- Table 35: United Kingdom Warm Mix Asphalt Market Revenue (Million) Forecast, by Application 2020 & 2033
- Table 36: United Kingdom Warm Mix Asphalt Market Volume (K Tons) Forecast, by Application 2020 & 2033
- Table 37: Italy Warm Mix Asphalt Market Revenue (Million) Forecast, by Application 2020 & 2033
- Table 38: Italy Warm Mix Asphalt Market Volume (K Tons) Forecast, by Application 2020 & 2033
- Table 39: France Warm Mix Asphalt Market Revenue (Million) Forecast, by Application 2020 & 2033
- Table 40: France Warm Mix Asphalt Market Volume (K Tons) Forecast, by Application 2020 & 2033
- Table 41: Rest of Europe Warm Mix Asphalt Market Revenue (Million) Forecast, by Application 2020 & 2033
- Table 42: Rest of Europe Warm Mix Asphalt Market Volume (K Tons) Forecast, by Application 2020 & 2033
- Table 43: Global Warm Mix Asphalt Market Revenue Million Forecast, by Application 2020 & 2033
- Table 44: Global Warm Mix Asphalt Market Volume K Tons Forecast, by Application 2020 & 2033
- Table 45: Global Warm Mix Asphalt Market Revenue Million Forecast, by Country 2020 & 2033
- Table 46: Global Warm Mix Asphalt Market Volume K Tons Forecast, by Country 2020 & 2033
- Table 47: Brazil Warm Mix Asphalt Market Revenue (Million) Forecast, by Application 2020 & 2033
- Table 48: Brazil Warm Mix Asphalt Market Volume (K Tons) Forecast, by Application 2020 & 2033
- Table 49: Argentina Warm Mix Asphalt Market Revenue (Million) Forecast, by Application 2020 & 2033
- Table 50: Argentina Warm Mix Asphalt Market Volume (K Tons) Forecast, by Application 2020 & 2033
- Table 51: Rest of South America Warm Mix Asphalt Market Revenue (Million) Forecast, by Application 2020 & 2033
- Table 52: Rest of South America Warm Mix Asphalt Market Volume (K Tons) Forecast, by Application 2020 & 2033
- Table 53: Global Warm Mix Asphalt Market Revenue Million Forecast, by Application 2020 & 2033
- Table 54: Global Warm Mix Asphalt Market Volume K Tons Forecast, by Application 2020 & 2033
- Table 55: Global Warm Mix Asphalt Market Revenue Million Forecast, by Country 2020 & 2033
- Table 56: Global Warm Mix Asphalt Market Volume K Tons Forecast, by Country 2020 & 2033
- Table 57: Saudi Arabia Warm Mix Asphalt Market Revenue (Million) Forecast, by Application 2020 & 2033
- Table 58: Saudi Arabia Warm Mix Asphalt Market Volume (K Tons) Forecast, by Application 2020 & 2033
- Table 59: South Africa Warm Mix Asphalt Market Revenue (Million) Forecast, by Application 2020 & 2033
- Table 60: South Africa Warm Mix Asphalt Market Volume (K Tons) Forecast, by Application 2020 & 2033
- Table 61: Rest of Middle East and Africa Warm Mix Asphalt Market Revenue (Million) Forecast, by Application 2020 & 2033
- Table 62: Rest of Middle East and Africa Warm Mix Asphalt Market Volume (K Tons) Forecast, by Application 2020 & 2033
Frequently Asked Questions
1. What is the projected Compound Annual Growth Rate (CAGR) of the Warm Mix Asphalt Market?
The projected CAGR is approximately > 4.00%.
2. Which companies are prominent players in the Warm Mix Asphalt Market?
Key companies in the market include BAOLIRUS International Investment Co Ltd, Reeves Construction Co, Aggregate Industries, Colas, Martin Marietta Materials, Blue Diamond Asphalt, Zydex Industries*List Not Exhaustive, PJ Keating, Prospect Hill Road, Americas Materials Inc.
3. What are the main segments of the Warm Mix Asphalt Market?
The market segments include Application.
4. Can you provide details about the market size?
The market size is estimated to be USD 14300 Million as of 2022.
5. What are some drivers contributing to market growth?
Increasing Road Construction Globally Under Various Government Initiatives; Rising Awareness Related to Climate Change Worldwide.
6. What are the notable trends driving market growth?
Increasing Usage in the Roadways Application.
7. Are there any restraints impacting market growth?
Lower Processing Temperature Leads To Excess Water Trapping; Other Restraints.
8. Can you provide examples of recent developments in the market?
In June 2022, Aggregate Industries decided to transition to warm-mix asphalt (WMA) manufacturing as a standard across its asphalt product portfolio. This will benefit the company by reducing building costs, enhancing life expectancy, and carbon savings.
9. What pricing options are available for accessing the report?
Pricing options include single-user, multi-user, and enterprise licenses priced at USD 4750, USD 5250, and USD 8750 respectively.
10. Is the market size provided in terms of value or volume?
The market size is provided in terms of value, measured in Million and volume, measured in K Tons.
11. Are there any specific market keywords associated with the report?
Yes, the market keyword associated with the report is "Warm Mix Asphalt Market," which aids in identifying and referencing the specific market segment covered.
12. How do I determine which pricing option suits my needs best?
The pricing options vary based on user requirements and access needs. Individual users may opt for single-user licenses, while businesses requiring broader access may choose multi-user or enterprise licenses for cost-effective access to the report.
13. Are there any additional resources or data provided in the Warm Mix Asphalt Market report?
While the report offers comprehensive insights, it's advisable to review the specific contents or supplementary materials provided to ascertain if additional resources or data are available.
14. How can I stay updated on further developments or reports in the Warm Mix Asphalt Market?
To stay informed about further developments, trends, and reports in the Warm Mix Asphalt Market, consider subscribing to industry newsletters, following relevant companies and organizations, or regularly checking reputable industry news sources and publications.
Methodology
Step 1 - Identification of Relevant Samples Size from Population Database


Step 2 - Approaches for Defining Global Market Size (Value, Volume* & Price*)

Note*: In applicable scenarios
Step 3 - Data Sources
Primary Research
- Web Analytics
- Survey Reports
- Research Institute
- Latest Research Reports
- Opinion Leaders
Secondary Research
- Annual Reports
- White Paper
- Latest Press Release
- Industry Association
- Paid Database
- Investor Presentations

Step 4 - Data Triangulation
Involves using different sources of information in order to increase the validity of a study
These sources are likely to be stakeholders in a program - participants, other researchers, program staff, other community members, and so on.
Then we put all data in single framework & apply various statistical tools to find out the dynamic on the market.
During the analysis stage, feedback from the stakeholder groups would be compared to determine areas of agreement as well as areas of divergence