
Key Insights
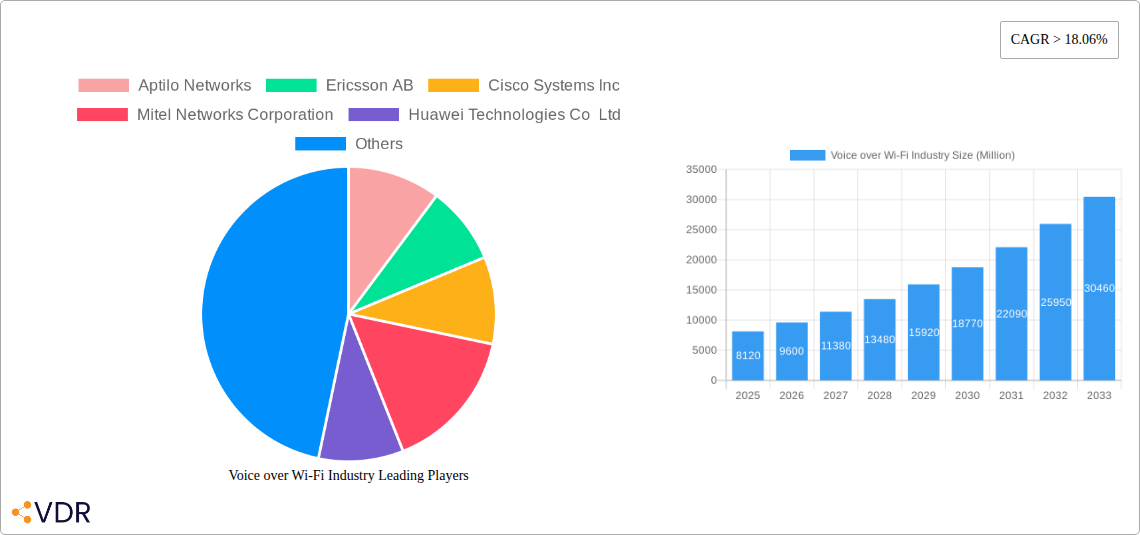
The Voice over Wi-Fi (VoWiFi) market is experiencing robust growth, projected to reach \$8.12 billion in 2025 and maintain a Compound Annual Growth Rate (CAGR) exceeding 18.06% from 2025 to 2033. This expansion is fueled by several key drivers. The increasing adoption of smartphones and other smart devices creates a larger potential user base for VoWiFi services. Furthermore, the demand for high-quality, cost-effective communication solutions, particularly in areas with limited or unreliable cellular coverage, is propelling market growth. Improvements in Wi-Fi infrastructure and the development of more sophisticated VoWiFi clients are also significant contributing factors. The market is segmented by client type (integrated, separate, browser-based) and device type (smartphones, tablets, laptops, and others), with smartphones currently dominating the market share. Competitive landscape analysis reveals key players like Cisco, Ericsson, and Huawei actively contributing to technological advancements and market expansion through continuous innovation and strategic partnerships. Regional growth varies; North America and Europe are currently leading, but the Asia-Pacific region presents significant future growth potential due to its expanding technological infrastructure and increasing smartphone penetration.
The restraints on VoWiFi market growth are primarily related to concerns about call quality and security. Interoperability issues between different VoWiFi systems can also hinder seamless communication. However, ongoing improvements in Wi-Fi technologies, such as Wi-Fi 6 and beyond, address some of these limitations, enhancing call quality and reliability. The increasing adoption of 5G technology, while not directly replacing VoWiFi, complements its capabilities by providing a robust alternative for superior connectivity in areas where Wi-Fi may be less reliable. Further technological advancements and standardization efforts to improve interoperability are anticipated to mitigate existing challenges and further fuel the market's expansion in the coming years, creating a more unified and efficient communication ecosystem.
Voice over Wi-Fi (VoWiFi) Industry Market Report: 2019-2033
This comprehensive report provides a detailed analysis of the Voice over Wi-Fi (VoWiFi) industry, encompassing market dynamics, growth trends, regional performance, product landscape, and key players. The study period covers 2019-2033, with a base year of 2025 and a forecast period of 2025-2033. The report segments the market by Voice Client (Integrated VoWiFi Client, Separate VoWiFi Client, Browser VoWiFi Client) and Device Type (Smartphones, Tablets and Laptops, Other Device Types), offering a granular understanding of this rapidly evolving sector. This report is essential for industry professionals, investors, and strategists seeking to navigate the complexities and capitalize on the growth opportunities within the VoWiFi market.
Voice over Wi-Fi Industry Market Dynamics & Structure
The VoWiFi market is characterized by a moderately concentrated landscape with key players such as Aptilo Networks, Ericsson AB, Cisco Systems Inc, and others actively competing. Technological innovation, particularly in 5G and cloud infrastructure, is a primary driver of market growth. Regulatory frameworks impacting telecom infrastructure and data privacy significantly influence market expansion. Competitive substitutes, primarily traditional cellular networks and other VoIP solutions, pose a challenge. The end-user demographics are expanding as the adoption of smartphones and Wi-Fi enabled devices increases across various age groups and regions. M&A activities are moderate, primarily focused on strategic acquisitions to enhance technological capabilities and market reach.
- Market Concentration: Moderately concentrated, with a few dominant players holding significant market share (xx%).
- Technological Innovation: 5G integration, cloud-based VoWiFi solutions, and improved quality of service (QoS) are key drivers.
- Regulatory Frameworks: Government policies on spectrum allocation and data privacy significantly impact market growth.
- Competitive Substitutes: Traditional cellular networks and other VoIP technologies represent competitive threats.
- End-User Demographics: Growth driven by increasing smartphone and Wi-Fi penetration across various demographics.
- M&A Trends: Moderate M&A activity, focused on technological enhancements and geographical expansion. Approximate deal volume during the historical period: xx deals.
Voice over Wi-Fi Industry Growth Trends & Insights
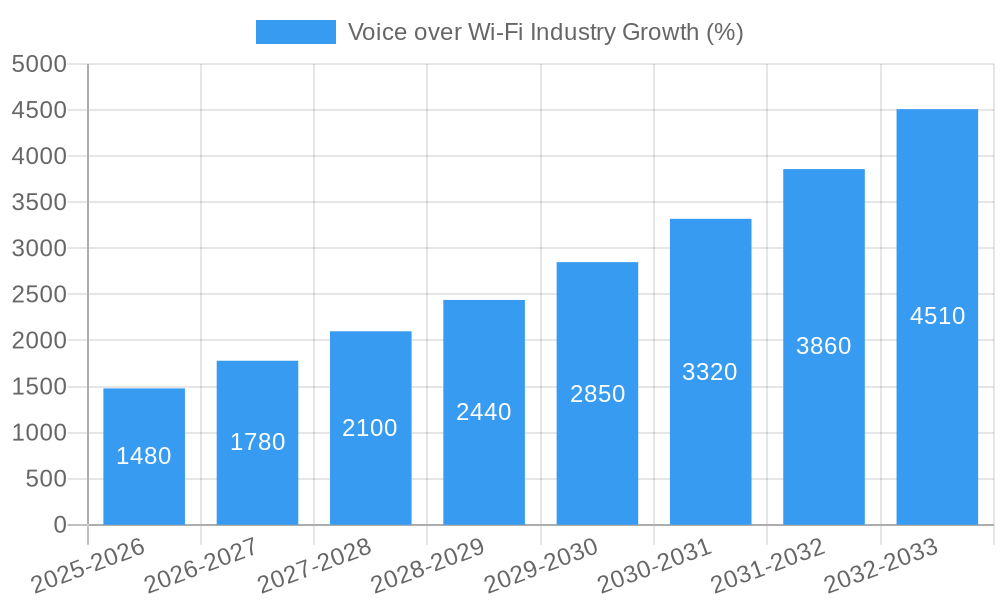
The VoWiFi market has witnessed significant growth over the past few years, driven by increasing demand for high-quality, cost-effective communication solutions. The market size expanded from xx million units in 2019 to xx million units in 2024, exhibiting a CAGR of xx%. This growth is projected to continue, with the market expected to reach xx million units by 2033, driven by factors including the proliferation of Wi-Fi hotspots, increasing smartphone penetration, and the rising adoption of cloud-based communication platforms. Technological advancements, such as the integration of VoWiFi with 5G networks, are further fueling market expansion. Consumer behavior shifts, with an increased preference for seamless communication across devices, are also driving the adoption of VoWiFi technology. Market penetration is anticipated to increase from xx% in 2024 to xx% by 2033.
Dominant Regions, Countries, or Segments in Voice over Wi-Fi Industry
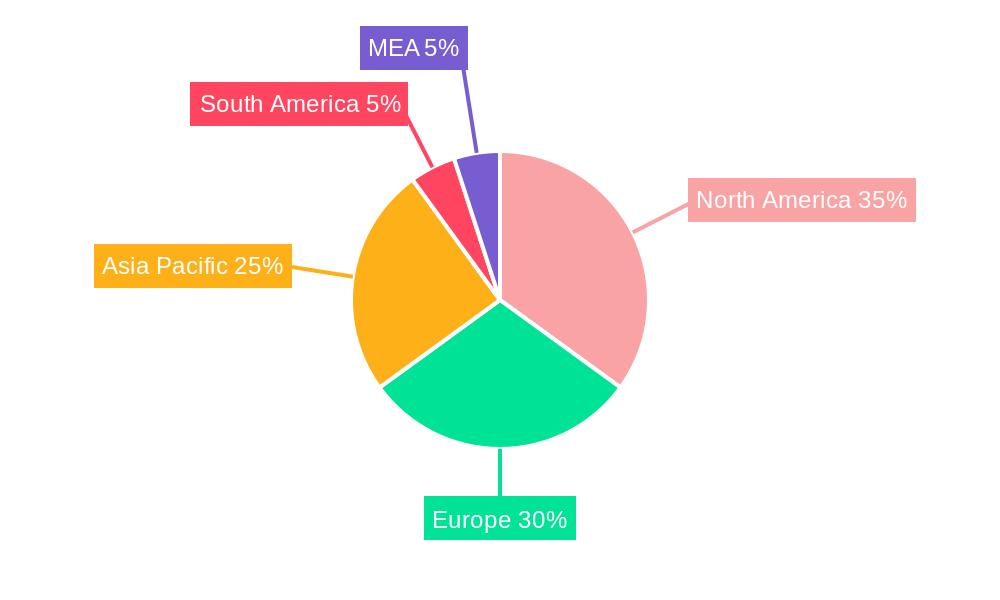
North America and Asia-Pacific currently dominate the VoWiFi market, exhibiting the highest growth rates. Within these regions, countries with well-established telecommunications infrastructure and high smartphone penetration are leading the adoption of VoWiFi. The "Smartphones" segment holds the largest market share among device types, owing to the ubiquitous nature of smartphones and their integration with various communication apps. The “Integrated VoWiFi Client” segment is also a significant growth driver due to its ease of use and seamless integration with existing communication platforms.
- Key Drivers (North America): Strong telecom infrastructure, high smartphone penetration, early adoption of advanced technologies.
- Key Drivers (Asia-Pacific): Rapid urbanization, growing smartphone adoption, expanding internet infrastructure.
- Dominant Segment (Voice Client): Integrated VoWiFi Client (xx% market share).
- Dominant Segment (Device Type): Smartphones (xx% market share).
- Growth Potential: Significant potential exists in emerging markets with developing telecom infrastructure.
Voice over Wi-Fi Industry Product Landscape
The VoWiFi product landscape is characterized by a wide range of solutions, from integrated clients embedded in smartphones to standalone applications and browser-based clients. Key product innovations focus on enhancing call quality, improving security, and optimizing bandwidth utilization. Unique selling propositions include features like seamless handover between Wi-Fi and cellular networks, advanced call management capabilities, and integration with various communication platforms. Technological advancements are driven by improvements in voice codecs, the adoption of cloud-based platforms, and the integration of VoWiFi with 5G networks.
Key Drivers, Barriers & Challenges in Voice over Wi-Fi Industry
Key Drivers: The increasing demand for high-quality, cost-effective communication, the proliferation of Wi-Fi hotspots, and the growing adoption of cloud-based communication platforms are major drivers for the market's growth. Furthermore, technological advancements like 5G integration and improved voice codecs are enhancing the user experience and fueling market expansion.
Key Barriers & Challenges: Interoperability issues between different VoWiFi systems, security concerns, and the need for reliable Wi-Fi infrastructure are major challenges. Regulatory hurdles and competitive pressures from existing communication technologies also pose significant obstacles to market growth. Estimated impact of supply chain issues on market growth: xx% reduction in 2024.
Emerging Opportunities in Voice over Wi-Fi Industry
Untapped market opportunities exist in emerging economies with rapidly expanding internet penetration and a growing demand for affordable communication solutions. Innovative applications of VoWiFi, such as its integration with IoT devices and the development of specialized solutions for enterprise communication, offer significant growth potential. Evolving consumer preferences towards seamless communication across multiple devices and platforms will further drive market demand.
Growth Accelerators in the Voice over Wi-Fi Industry Industry
The integration of VoWiFi with 5G networks promises to significantly enhance call quality and reliability, thereby accelerating market adoption. Strategic partnerships between telecom operators, device manufacturers, and software providers are creating a more robust and interconnected ecosystem, fueling market growth. Expanding VoWiFi into new markets and developing specialized applications for various industry segments will further stimulate market expansion.
Key Players Shaping the Voice over Wi-Fi Industry Market
- Aptilo Networks
- Ericsson AB
- Cisco Systems Inc
- Mitel Networks Corporation
- Huawei Technologies Co Ltd
- Oracle Corporation
- Nokia Corporation
- Ribbon Communications
- Alcatel-Lucent
- KT Corporation
Notable Milestones in Voice over Wi-Fi Industry Sector
- October 2023: Bharti Airtel partners with Microsoft to offer calling services over Microsoft Teams via Airtel IQ.
- February 2023: Econet Wireless Zimbabwe strengthens its partnership with Ericsson for 5G expansion, including VoWiFi implementation.
In-Depth Voice over Wi-Fi Industry Market Outlook
The future of the VoWiFi market is bright, driven by the convergence of 5G technology, cloud-based solutions, and the increasing demand for seamless communication. Strategic partnerships, technological advancements, and expansion into untapped markets will contribute to sustained growth. The market is poised for significant expansion, offering lucrative opportunities for both established players and new entrants. The long-term outlook is positive, with a projected market size of xx million units by 2033.
Voice over Wi-Fi Industry Segmentation
-
1. Voice Client
- 1.1. Integrated VoWiFi Client
- 1.2. Separate VoWiFi Client
- 1.3. Browser VoWiFi Client
-
2. Device Type
- 2.1. Smartphones
- 2.2. Tablets and Laptops
- 2.3. Other Device Types
Voice over Wi-Fi Industry Segmentation By Geography
- 1. North America
- 2. Europe
- 3. Asia Pacific
- 4. Latin America
- 5. Middle East and Africa
Voice over Wi-Fi Industry REPORT HIGHLIGHTS
| Aspects | Details |
|---|---|
| Study Period | 2019-2033 |
| Base Year | 2024 |
| Estimated Year | 2025 |
| Forecast Period | 2025-2033 |
| Historical Period | 2019-2024 |
| Growth Rate | CAGR of > 18.06% from 2019-2033 |
| Segmentation |
|
Table of Contents
- 1. Introduction
- 1.1. Research Scope
- 1.2. Market Segmentation
- 1.3. Research Methodology
- 1.4. Definitions and Assumptions
- 2. Executive Summary
- 2.1. Introduction
- 3. Market Dynamics
- 3.1. Introduction
- 3.2. Market Drivers
- 3.2.1. Increasing Internet Penetration; Reduction of Indoor Coverage Problems
- 3.3. Market Restrains
- 3.3.1. Maintenance Problems Due to Carriers
- 3.4. Market Trends
- 3.4.1. Public WiFi Hotspot to Gain Significant Market Share
- 4. Market Factor Analysis
- 4.1. Porters Five Forces
- 4.2. Supply/Value Chain
- 4.3. PESTEL analysis
- 4.4. Market Entropy
- 4.5. Patent/Trademark Analysis
- 5. Global Voice over Wi-Fi Industry Analysis, Insights and Forecast, 2019-2031
- 5.1. Market Analysis, Insights and Forecast - by Voice Client
- 5.1.1. Integrated VoWiFi Client
- 5.1.2. Separate VoWiFi Client
- 5.1.3. Browser VoWiFi Client
- 5.2. Market Analysis, Insights and Forecast - by Device Type
- 5.2.1. Smartphones
- 5.2.2. Tablets and Laptops
- 5.2.3. Other Device Types
- 5.3. Market Analysis, Insights and Forecast - by Region
- 5.3.1. North America
- 5.3.2. Europe
- 5.3.3. Asia Pacific
- 5.3.4. Latin America
- 5.3.5. Middle East and Africa
- 5.1. Market Analysis, Insights and Forecast - by Voice Client
- 6. North America Voice over Wi-Fi Industry Analysis, Insights and Forecast, 2019-2031
- 6.1. Market Analysis, Insights and Forecast - by Voice Client
- 6.1.1. Integrated VoWiFi Client
- 6.1.2. Separate VoWiFi Client
- 6.1.3. Browser VoWiFi Client
- 6.2. Market Analysis, Insights and Forecast - by Device Type
- 6.2.1. Smartphones
- 6.2.2. Tablets and Laptops
- 6.2.3. Other Device Types
- 6.1. Market Analysis, Insights and Forecast - by Voice Client
- 7. Europe Voice over Wi-Fi Industry Analysis, Insights and Forecast, 2019-2031
- 7.1. Market Analysis, Insights and Forecast - by Voice Client
- 7.1.1. Integrated VoWiFi Client
- 7.1.2. Separate VoWiFi Client
- 7.1.3. Browser VoWiFi Client
- 7.2. Market Analysis, Insights and Forecast - by Device Type
- 7.2.1. Smartphones
- 7.2.2. Tablets and Laptops
- 7.2.3. Other Device Types
- 7.1. Market Analysis, Insights and Forecast - by Voice Client
- 8. Asia Pacific Voice over Wi-Fi Industry Analysis, Insights and Forecast, 2019-2031
- 8.1. Market Analysis, Insights and Forecast - by Voice Client
- 8.1.1. Integrated VoWiFi Client
- 8.1.2. Separate VoWiFi Client
- 8.1.3. Browser VoWiFi Client
- 8.2. Market Analysis, Insights and Forecast - by Device Type
- 8.2.1. Smartphones
- 8.2.2. Tablets and Laptops
- 8.2.3. Other Device Types
- 8.1. Market Analysis, Insights and Forecast - by Voice Client
- 9. Latin America Voice over Wi-Fi Industry Analysis, Insights and Forecast, 2019-2031
- 9.1. Market Analysis, Insights and Forecast - by Voice Client
- 9.1.1. Integrated VoWiFi Client
- 9.1.2. Separate VoWiFi Client
- 9.1.3. Browser VoWiFi Client
- 9.2. Market Analysis, Insights and Forecast - by Device Type
- 9.2.1. Smartphones
- 9.2.2. Tablets and Laptops
- 9.2.3. Other Device Types
- 9.1. Market Analysis, Insights and Forecast - by Voice Client
- 10. Middle East and Africa Voice over Wi-Fi Industry Analysis, Insights and Forecast, 2019-2031
- 10.1. Market Analysis, Insights and Forecast - by Voice Client
- 10.1.1. Integrated VoWiFi Client
- 10.1.2. Separate VoWiFi Client
- 10.1.3. Browser VoWiFi Client
- 10.2. Market Analysis, Insights and Forecast - by Device Type
- 10.2.1. Smartphones
- 10.2.2. Tablets and Laptops
- 10.2.3. Other Device Types
- 10.1. Market Analysis, Insights and Forecast - by Voice Client
- 11. North America Voice over Wi-Fi Industry Analysis, Insights and Forecast, 2019-2031
- 11.1. Market Analysis, Insights and Forecast - By Country/Sub-region
- 11.1.1 United States
- 11.1.2 Canada
- 11.1.3 Mexico
- 12. Europe Voice over Wi-Fi Industry Analysis, Insights and Forecast, 2019-2031
- 12.1. Market Analysis, Insights and Forecast - By Country/Sub-region
- 12.1.1 Germany
- 12.1.2 United Kingdom
- 12.1.3 France
- 12.1.4 Spain
- 12.1.5 Italy
- 12.1.6 Spain
- 12.1.7 Belgium
- 12.1.8 Netherland
- 12.1.9 Nordics
- 12.1.10 Rest of Europe
- 13. Asia Pacific Voice over Wi-Fi Industry Analysis, Insights and Forecast, 2019-2031
- 13.1. Market Analysis, Insights and Forecast - By Country/Sub-region
- 13.1.1 China
- 13.1.2 Japan
- 13.1.3 India
- 13.1.4 South Korea
- 13.1.5 Southeast Asia
- 13.1.6 Australia
- 13.1.7 Indonesia
- 13.1.8 Phillipes
- 13.1.9 Singapore
- 13.1.10 Thailandc
- 13.1.11 Rest of Asia Pacific
- 14. South America Voice over Wi-Fi Industry Analysis, Insights and Forecast, 2019-2031
- 14.1. Market Analysis, Insights and Forecast - By Country/Sub-region
- 14.1.1 Brazil
- 14.1.2 Argentina
- 14.1.3 Peru
- 14.1.4 Chile
- 14.1.5 Colombia
- 14.1.6 Ecuador
- 14.1.7 Venezuela
- 14.1.8 Rest of South America
- 15. North America Voice over Wi-Fi Industry Analysis, Insights and Forecast, 2019-2031
- 15.1. Market Analysis, Insights and Forecast - By Country/Sub-region
- 15.1.1 United States
- 15.1.2 Canada
- 15.1.3 Mexico
- 16. MEA Voice over Wi-Fi Industry Analysis, Insights and Forecast, 2019-2031
- 16.1. Market Analysis, Insights and Forecast - By Country/Sub-region
- 16.1.1 United Arab Emirates
- 16.1.2 Saudi Arabia
- 16.1.3 South Africa
- 16.1.4 Rest of Middle East and Africa
- 17. Competitive Analysis
- 17.1. Global Market Share Analysis 2024
- 17.2. Company Profiles
- 17.2.1 Aptilo Networks
- 17.2.1.1. Overview
- 17.2.1.2. Products
- 17.2.1.3. SWOT Analysis
- 17.2.1.4. Recent Developments
- 17.2.1.5. Financials (Based on Availability)
- 17.2.2 Ericsson AB
- 17.2.2.1. Overview
- 17.2.2.2. Products
- 17.2.2.3. SWOT Analysis
- 17.2.2.4. Recent Developments
- 17.2.2.5. Financials (Based on Availability)
- 17.2.3 Cisco Systems Inc
- 17.2.3.1. Overview
- 17.2.3.2. Products
- 17.2.3.3. SWOT Analysis
- 17.2.3.4. Recent Developments
- 17.2.3.5. Financials (Based on Availability)
- 17.2.4 Mitel Networks Corporation
- 17.2.4.1. Overview
- 17.2.4.2. Products
- 17.2.4.3. SWOT Analysis
- 17.2.4.4. Recent Developments
- 17.2.4.5. Financials (Based on Availability)
- 17.2.5 Huawei Technologies Co Ltd
- 17.2.5.1. Overview
- 17.2.5.2. Products
- 17.2.5.3. SWOT Analysis
- 17.2.5.4. Recent Developments
- 17.2.5.5. Financials (Based on Availability)
- 17.2.6 Oracle Corporation
- 17.2.6.1. Overview
- 17.2.6.2. Products
- 17.2.6.3. SWOT Analysis
- 17.2.6.4. Recent Developments
- 17.2.6.5. Financials (Based on Availability)
- 17.2.7 Nokia Corporation
- 17.2.7.1. Overview
- 17.2.7.2. Products
- 17.2.7.3. SWOT Analysis
- 17.2.7.4. Recent Developments
- 17.2.7.5. Financials (Based on Availability)
- 17.2.8 Ribbon Communications
- 17.2.8.1. Overview
- 17.2.8.2. Products
- 17.2.8.3. SWOT Analysis
- 17.2.8.4. Recent Developments
- 17.2.8.5. Financials (Based on Availability)
- 17.2.9 Alcatel-Lucent
- 17.2.9.1. Overview
- 17.2.9.2. Products
- 17.2.9.3. SWOT Analysis
- 17.2.9.4. Recent Developments
- 17.2.9.5. Financials (Based on Availability)
- 17.2.10 KT Corporation
- 17.2.10.1. Overview
- 17.2.10.2. Products
- 17.2.10.3. SWOT Analysis
- 17.2.10.4. Recent Developments
- 17.2.10.5. Financials (Based on Availability)
- 17.2.1 Aptilo Networks
List of Figures
- Figure 1: Global Voice over Wi-Fi Industry Revenue Breakdown (Million, %) by Region 2024 & 2032
- Figure 2: Global Voice over Wi-Fi Industry Volume Breakdown (K Unit, %) by Region 2024 & 2032
- Figure 3: North America Voice over Wi-Fi Industry Revenue (Million), by Country 2024 & 2032
- Figure 4: North America Voice over Wi-Fi Industry Volume (K Unit), by Country 2024 & 2032
- Figure 5: North America Voice over Wi-Fi Industry Revenue Share (%), by Country 2024 & 2032
- Figure 6: North America Voice over Wi-Fi Industry Volume Share (%), by Country 2024 & 2032
- Figure 7: Europe Voice over Wi-Fi Industry Revenue (Million), by Country 2024 & 2032
- Figure 8: Europe Voice over Wi-Fi Industry Volume (K Unit), by Country 2024 & 2032
- Figure 9: Europe Voice over Wi-Fi Industry Revenue Share (%), by Country 2024 & 2032
- Figure 10: Europe Voice over Wi-Fi Industry Volume Share (%), by Country 2024 & 2032
- Figure 11: Asia Pacific Voice over Wi-Fi Industry Revenue (Million), by Country 2024 & 2032
- Figure 12: Asia Pacific Voice over Wi-Fi Industry Volume (K Unit), by Country 2024 & 2032
- Figure 13: Asia Pacific Voice over Wi-Fi Industry Revenue Share (%), by Country 2024 & 2032
- Figure 14: Asia Pacific Voice over Wi-Fi Industry Volume Share (%), by Country 2024 & 2032
- Figure 15: South America Voice over Wi-Fi Industry Revenue (Million), by Country 2024 & 2032
- Figure 16: South America Voice over Wi-Fi Industry Volume (K Unit), by Country 2024 & 2032
- Figure 17: South America Voice over Wi-Fi Industry Revenue Share (%), by Country 2024 & 2032
- Figure 18: South America Voice over Wi-Fi Industry Volume Share (%), by Country 2024 & 2032
- Figure 19: North America Voice over Wi-Fi Industry Revenue (Million), by Country 2024 & 2032
- Figure 20: North America Voice over Wi-Fi Industry Volume (K Unit), by Country 2024 & 2032
- Figure 21: North America Voice over Wi-Fi Industry Revenue Share (%), by Country 2024 & 2032
- Figure 22: North America Voice over Wi-Fi Industry Volume Share (%), by Country 2024 & 2032
- Figure 23: MEA Voice over Wi-Fi Industry Revenue (Million), by Country 2024 & 2032
- Figure 24: MEA Voice over Wi-Fi Industry Volume (K Unit), by Country 2024 & 2032
- Figure 25: MEA Voice over Wi-Fi Industry Revenue Share (%), by Country 2024 & 2032
- Figure 26: MEA Voice over Wi-Fi Industry Volume Share (%), by Country 2024 & 2032
- Figure 27: North America Voice over Wi-Fi Industry Revenue (Million), by Voice Client 2024 & 2032
- Figure 28: North America Voice over Wi-Fi Industry Volume (K Unit), by Voice Client 2024 & 2032
- Figure 29: North America Voice over Wi-Fi Industry Revenue Share (%), by Voice Client 2024 & 2032
- Figure 30: North America Voice over Wi-Fi Industry Volume Share (%), by Voice Client 2024 & 2032
- Figure 31: North America Voice over Wi-Fi Industry Revenue (Million), by Device Type 2024 & 2032
- Figure 32: North America Voice over Wi-Fi Industry Volume (K Unit), by Device Type 2024 & 2032
- Figure 33: North America Voice over Wi-Fi Industry Revenue Share (%), by Device Type 2024 & 2032
- Figure 34: North America Voice over Wi-Fi Industry Volume Share (%), by Device Type 2024 & 2032
- Figure 35: North America Voice over Wi-Fi Industry Revenue (Million), by Country 2024 & 2032
- Figure 36: North America Voice over Wi-Fi Industry Volume (K Unit), by Country 2024 & 2032
- Figure 37: North America Voice over Wi-Fi Industry Revenue Share (%), by Country 2024 & 2032
- Figure 38: North America Voice over Wi-Fi Industry Volume Share (%), by Country 2024 & 2032
- Figure 39: Europe Voice over Wi-Fi Industry Revenue (Million), by Voice Client 2024 & 2032
- Figure 40: Europe Voice over Wi-Fi Industry Volume (K Unit), by Voice Client 2024 & 2032
- Figure 41: Europe Voice over Wi-Fi Industry Revenue Share (%), by Voice Client 2024 & 2032
- Figure 42: Europe Voice over Wi-Fi Industry Volume Share (%), by Voice Client 2024 & 2032
- Figure 43: Europe Voice over Wi-Fi Industry Revenue (Million), by Device Type 2024 & 2032
- Figure 44: Europe Voice over Wi-Fi Industry Volume (K Unit), by Device Type 2024 & 2032
- Figure 45: Europe Voice over Wi-Fi Industry Revenue Share (%), by Device Type 2024 & 2032
- Figure 46: Europe Voice over Wi-Fi Industry Volume Share (%), by Device Type 2024 & 2032
- Figure 47: Europe Voice over Wi-Fi Industry Revenue (Million), by Country 2024 & 2032
- Figure 48: Europe Voice over Wi-Fi Industry Volume (K Unit), by Country 2024 & 2032
- Figure 49: Europe Voice over Wi-Fi Industry Revenue Share (%), by Country 2024 & 2032
- Figure 50: Europe Voice over Wi-Fi Industry Volume Share (%), by Country 2024 & 2032
- Figure 51: Asia Pacific Voice over Wi-Fi Industry Revenue (Million), by Voice Client 2024 & 2032
- Figure 52: Asia Pacific Voice over Wi-Fi Industry Volume (K Unit), by Voice Client 2024 & 2032
- Figure 53: Asia Pacific Voice over Wi-Fi Industry Revenue Share (%), by Voice Client 2024 & 2032
- Figure 54: Asia Pacific Voice over Wi-Fi Industry Volume Share (%), by Voice Client 2024 & 2032
- Figure 55: Asia Pacific Voice over Wi-Fi Industry Revenue (Million), by Device Type 2024 & 2032
- Figure 56: Asia Pacific Voice over Wi-Fi Industry Volume (K Unit), by Device Type 2024 & 2032
- Figure 57: Asia Pacific Voice over Wi-Fi Industry Revenue Share (%), by Device Type 2024 & 2032
- Figure 58: Asia Pacific Voice over Wi-Fi Industry Volume Share (%), by Device Type 2024 & 2032
- Figure 59: Asia Pacific Voice over Wi-Fi Industry Revenue (Million), by Country 2024 & 2032
- Figure 60: Asia Pacific Voice over Wi-Fi Industry Volume (K Unit), by Country 2024 & 2032
- Figure 61: Asia Pacific Voice over Wi-Fi Industry Revenue Share (%), by Country 2024 & 2032
- Figure 62: Asia Pacific Voice over Wi-Fi Industry Volume Share (%), by Country 2024 & 2032
- Figure 63: Latin America Voice over Wi-Fi Industry Revenue (Million), by Voice Client 2024 & 2032
- Figure 64: Latin America Voice over Wi-Fi Industry Volume (K Unit), by Voice Client 2024 & 2032
- Figure 65: Latin America Voice over Wi-Fi Industry Revenue Share (%), by Voice Client 2024 & 2032
- Figure 66: Latin America Voice over Wi-Fi Industry Volume Share (%), by Voice Client 2024 & 2032
- Figure 67: Latin America Voice over Wi-Fi Industry Revenue (Million), by Device Type 2024 & 2032
- Figure 68: Latin America Voice over Wi-Fi Industry Volume (K Unit), by Device Type 2024 & 2032
- Figure 69: Latin America Voice over Wi-Fi Industry Revenue Share (%), by Device Type 2024 & 2032
- Figure 70: Latin America Voice over Wi-Fi Industry Volume Share (%), by Device Type 2024 & 2032
- Figure 71: Latin America Voice over Wi-Fi Industry Revenue (Million), by Country 2024 & 2032
- Figure 72: Latin America Voice over Wi-Fi Industry Volume (K Unit), by Country 2024 & 2032
- Figure 73: Latin America Voice over Wi-Fi Industry Revenue Share (%), by Country 2024 & 2032
- Figure 74: Latin America Voice over Wi-Fi Industry Volume Share (%), by Country 2024 & 2032
- Figure 75: Middle East and Africa Voice over Wi-Fi Industry Revenue (Million), by Voice Client 2024 & 2032
- Figure 76: Middle East and Africa Voice over Wi-Fi Industry Volume (K Unit), by Voice Client 2024 & 2032
- Figure 77: Middle East and Africa Voice over Wi-Fi Industry Revenue Share (%), by Voice Client 2024 & 2032
- Figure 78: Middle East and Africa Voice over Wi-Fi Industry Volume Share (%), by Voice Client 2024 & 2032
- Figure 79: Middle East and Africa Voice over Wi-Fi Industry Revenue (Million), by Device Type 2024 & 2032
- Figure 80: Middle East and Africa Voice over Wi-Fi Industry Volume (K Unit), by Device Type 2024 & 2032
- Figure 81: Middle East and Africa Voice over Wi-Fi Industry Revenue Share (%), by Device Type 2024 & 2032
- Figure 82: Middle East and Africa Voice over Wi-Fi Industry Volume Share (%), by Device Type 2024 & 2032
- Figure 83: Middle East and Africa Voice over Wi-Fi Industry Revenue (Million), by Country 2024 & 2032
- Figure 84: Middle East and Africa Voice over Wi-Fi Industry Volume (K Unit), by Country 2024 & 2032
- Figure 85: Middle East and Africa Voice over Wi-Fi Industry Revenue Share (%), by Country 2024 & 2032
- Figure 86: Middle East and Africa Voice over Wi-Fi Industry Volume Share (%), by Country 2024 & 2032
List of Tables
- Table 1: Global Voice over Wi-Fi Industry Revenue Million Forecast, by Region 2019 & 2032
- Table 2: Global Voice over Wi-Fi Industry Volume K Unit Forecast, by Region 2019 & 2032
- Table 3: Global Voice over Wi-Fi Industry Revenue Million Forecast, by Voice Client 2019 & 2032
- Table 4: Global Voice over Wi-Fi Industry Volume K Unit Forecast, by Voice Client 2019 & 2032
- Table 5: Global Voice over Wi-Fi Industry Revenue Million Forecast, by Device Type 2019 & 2032
- Table 6: Global Voice over Wi-Fi Industry Volume K Unit Forecast, by Device Type 2019 & 2032
- Table 7: Global Voice over Wi-Fi Industry Revenue Million Forecast, by Region 2019 & 2032
- Table 8: Global Voice over Wi-Fi Industry Volume K Unit Forecast, by Region 2019 & 2032
- Table 9: Global Voice over Wi-Fi Industry Revenue Million Forecast, by Country 2019 & 2032
- Table 10: Global Voice over Wi-Fi Industry Volume K Unit Forecast, by Country 2019 & 2032
- Table 11: United States Voice over Wi-Fi Industry Revenue (Million) Forecast, by Application 2019 & 2032
- Table 12: United States Voice over Wi-Fi Industry Volume (K Unit) Forecast, by Application 2019 & 2032
- Table 13: Canada Voice over Wi-Fi Industry Revenue (Million) Forecast, by Application 2019 & 2032
- Table 14: Canada Voice over Wi-Fi Industry Volume (K Unit) Forecast, by Application 2019 & 2032
- Table 15: Mexico Voice over Wi-Fi Industry Revenue (Million) Forecast, by Application 2019 & 2032
- Table 16: Mexico Voice over Wi-Fi Industry Volume (K Unit) Forecast, by Application 2019 & 2032
- Table 17: Global Voice over Wi-Fi Industry Revenue Million Forecast, by Country 2019 & 2032
- Table 18: Global Voice over Wi-Fi Industry Volume K Unit Forecast, by Country 2019 & 2032
- Table 19: Germany Voice over Wi-Fi Industry Revenue (Million) Forecast, by Application 2019 & 2032
- Table 20: Germany Voice over Wi-Fi Industry Volume (K Unit) Forecast, by Application 2019 & 2032
- Table 21: United Kingdom Voice over Wi-Fi Industry Revenue (Million) Forecast, by Application 2019 & 2032
- Table 22: United Kingdom Voice over Wi-Fi Industry Volume (K Unit) Forecast, by Application 2019 & 2032
- Table 23: France Voice over Wi-Fi Industry Revenue (Million) Forecast, by Application 2019 & 2032
- Table 24: France Voice over Wi-Fi Industry Volume (K Unit) Forecast, by Application 2019 & 2032
- Table 25: Spain Voice over Wi-Fi Industry Revenue (Million) Forecast, by Application 2019 & 2032
- Table 26: Spain Voice over Wi-Fi Industry Volume (K Unit) Forecast, by Application 2019 & 2032
- Table 27: Italy Voice over Wi-Fi Industry Revenue (Million) Forecast, by Application 2019 & 2032
- Table 28: Italy Voice over Wi-Fi Industry Volume (K Unit) Forecast, by Application 2019 & 2032
- Table 29: Spain Voice over Wi-Fi Industry Revenue (Million) Forecast, by Application 2019 & 2032
- Table 30: Spain Voice over Wi-Fi Industry Volume (K Unit) Forecast, by Application 2019 & 2032
- Table 31: Belgium Voice over Wi-Fi Industry Revenue (Million) Forecast, by Application 2019 & 2032
- Table 32: Belgium Voice over Wi-Fi Industry Volume (K Unit) Forecast, by Application 2019 & 2032
- Table 33: Netherland Voice over Wi-Fi Industry Revenue (Million) Forecast, by Application 2019 & 2032
- Table 34: Netherland Voice over Wi-Fi Industry Volume (K Unit) Forecast, by Application 2019 & 2032
- Table 35: Nordics Voice over Wi-Fi Industry Revenue (Million) Forecast, by Application 2019 & 2032
- Table 36: Nordics Voice over Wi-Fi Industry Volume (K Unit) Forecast, by Application 2019 & 2032
- Table 37: Rest of Europe Voice over Wi-Fi Industry Revenue (Million) Forecast, by Application 2019 & 2032
- Table 38: Rest of Europe Voice over Wi-Fi Industry Volume (K Unit) Forecast, by Application 2019 & 2032
- Table 39: Global Voice over Wi-Fi Industry Revenue Million Forecast, by Country 2019 & 2032
- Table 40: Global Voice over Wi-Fi Industry Volume K Unit Forecast, by Country 2019 & 2032
- Table 41: China Voice over Wi-Fi Industry Revenue (Million) Forecast, by Application 2019 & 2032
- Table 42: China Voice over Wi-Fi Industry Volume (K Unit) Forecast, by Application 2019 & 2032
- Table 43: Japan Voice over Wi-Fi Industry Revenue (Million) Forecast, by Application 2019 & 2032
- Table 44: Japan Voice over Wi-Fi Industry Volume (K Unit) Forecast, by Application 2019 & 2032
- Table 45: India Voice over Wi-Fi Industry Revenue (Million) Forecast, by Application 2019 & 2032
- Table 46: India Voice over Wi-Fi Industry Volume (K Unit) Forecast, by Application 2019 & 2032
- Table 47: South Korea Voice over Wi-Fi Industry Revenue (Million) Forecast, by Application 2019 & 2032
- Table 48: South Korea Voice over Wi-Fi Industry Volume (K Unit) Forecast, by Application 2019 & 2032
- Table 49: Southeast Asia Voice over Wi-Fi Industry Revenue (Million) Forecast, by Application 2019 & 2032
- Table 50: Southeast Asia Voice over Wi-Fi Industry Volume (K Unit) Forecast, by Application 2019 & 2032
- Table 51: Australia Voice over Wi-Fi Industry Revenue (Million) Forecast, by Application 2019 & 2032
- Table 52: Australia Voice over Wi-Fi Industry Volume (K Unit) Forecast, by Application 2019 & 2032
- Table 53: Indonesia Voice over Wi-Fi Industry Revenue (Million) Forecast, by Application 2019 & 2032
- Table 54: Indonesia Voice over Wi-Fi Industry Volume (K Unit) Forecast, by Application 2019 & 2032
- Table 55: Phillipes Voice over Wi-Fi Industry Revenue (Million) Forecast, by Application 2019 & 2032
- Table 56: Phillipes Voice over Wi-Fi Industry Volume (K Unit) Forecast, by Application 2019 & 2032
- Table 57: Singapore Voice over Wi-Fi Industry Revenue (Million) Forecast, by Application 2019 & 2032
- Table 58: Singapore Voice over Wi-Fi Industry Volume (K Unit) Forecast, by Application 2019 & 2032
- Table 59: Thailandc Voice over Wi-Fi Industry Revenue (Million) Forecast, by Application 2019 & 2032
- Table 60: Thailandc Voice over Wi-Fi Industry Volume (K Unit) Forecast, by Application 2019 & 2032
- Table 61: Rest of Asia Pacific Voice over Wi-Fi Industry Revenue (Million) Forecast, by Application 2019 & 2032
- Table 62: Rest of Asia Pacific Voice over Wi-Fi Industry Volume (K Unit) Forecast, by Application 2019 & 2032
- Table 63: Global Voice over Wi-Fi Industry Revenue Million Forecast, by Country 2019 & 2032
- Table 64: Global Voice over Wi-Fi Industry Volume K Unit Forecast, by Country 2019 & 2032
- Table 65: Brazil Voice over Wi-Fi Industry Revenue (Million) Forecast, by Application 2019 & 2032
- Table 66: Brazil Voice over Wi-Fi Industry Volume (K Unit) Forecast, by Application 2019 & 2032
- Table 67: Argentina Voice over Wi-Fi Industry Revenue (Million) Forecast, by Application 2019 & 2032
- Table 68: Argentina Voice over Wi-Fi Industry Volume (K Unit) Forecast, by Application 2019 & 2032
- Table 69: Peru Voice over Wi-Fi Industry Revenue (Million) Forecast, by Application 2019 & 2032
- Table 70: Peru Voice over Wi-Fi Industry Volume (K Unit) Forecast, by Application 2019 & 2032
- Table 71: Chile Voice over Wi-Fi Industry Revenue (Million) Forecast, by Application 2019 & 2032
- Table 72: Chile Voice over Wi-Fi Industry Volume (K Unit) Forecast, by Application 2019 & 2032
- Table 73: Colombia Voice over Wi-Fi Industry Revenue (Million) Forecast, by Application 2019 & 2032
- Table 74: Colombia Voice over Wi-Fi Industry Volume (K Unit) Forecast, by Application 2019 & 2032
- Table 75: Ecuador Voice over Wi-Fi Industry Revenue (Million) Forecast, by Application 2019 & 2032
- Table 76: Ecuador Voice over Wi-Fi Industry Volume (K Unit) Forecast, by Application 2019 & 2032
- Table 77: Venezuela Voice over Wi-Fi Industry Revenue (Million) Forecast, by Application 2019 & 2032
- Table 78: Venezuela Voice over Wi-Fi Industry Volume (K Unit) Forecast, by Application 2019 & 2032
- Table 79: Rest of South America Voice over Wi-Fi Industry Revenue (Million) Forecast, by Application 2019 & 2032
- Table 80: Rest of South America Voice over Wi-Fi Industry Volume (K Unit) Forecast, by Application 2019 & 2032
- Table 81: Global Voice over Wi-Fi Industry Revenue Million Forecast, by Country 2019 & 2032
- Table 82: Global Voice over Wi-Fi Industry Volume K Unit Forecast, by Country 2019 & 2032
- Table 83: United States Voice over Wi-Fi Industry Revenue (Million) Forecast, by Application 2019 & 2032
- Table 84: United States Voice over Wi-Fi Industry Volume (K Unit) Forecast, by Application 2019 & 2032
- Table 85: Canada Voice over Wi-Fi Industry Revenue (Million) Forecast, by Application 2019 & 2032
- Table 86: Canada Voice over Wi-Fi Industry Volume (K Unit) Forecast, by Application 2019 & 2032
- Table 87: Mexico Voice over Wi-Fi Industry Revenue (Million) Forecast, by Application 2019 & 2032
- Table 88: Mexico Voice over Wi-Fi Industry Volume (K Unit) Forecast, by Application 2019 & 2032
- Table 89: Global Voice over Wi-Fi Industry Revenue Million Forecast, by Country 2019 & 2032
- Table 90: Global Voice over Wi-Fi Industry Volume K Unit Forecast, by Country 2019 & 2032
- Table 91: United Arab Emirates Voice over Wi-Fi Industry Revenue (Million) Forecast, by Application 2019 & 2032
- Table 92: United Arab Emirates Voice over Wi-Fi Industry Volume (K Unit) Forecast, by Application 2019 & 2032
- Table 93: Saudi Arabia Voice over Wi-Fi Industry Revenue (Million) Forecast, by Application 2019 & 2032
- Table 94: Saudi Arabia Voice over Wi-Fi Industry Volume (K Unit) Forecast, by Application 2019 & 2032
- Table 95: South Africa Voice over Wi-Fi Industry Revenue (Million) Forecast, by Application 2019 & 2032
- Table 96: South Africa Voice over Wi-Fi Industry Volume (K Unit) Forecast, by Application 2019 & 2032
- Table 97: Rest of Middle East and Africa Voice over Wi-Fi Industry Revenue (Million) Forecast, by Application 2019 & 2032
- Table 98: Rest of Middle East and Africa Voice over Wi-Fi Industry Volume (K Unit) Forecast, by Application 2019 & 2032
- Table 99: Global Voice over Wi-Fi Industry Revenue Million Forecast, by Voice Client 2019 & 2032
- Table 100: Global Voice over Wi-Fi Industry Volume K Unit Forecast, by Voice Client 2019 & 2032
- Table 101: Global Voice over Wi-Fi Industry Revenue Million Forecast, by Device Type 2019 & 2032
- Table 102: Global Voice over Wi-Fi Industry Volume K Unit Forecast, by Device Type 2019 & 2032
- Table 103: Global Voice over Wi-Fi Industry Revenue Million Forecast, by Country 2019 & 2032
- Table 104: Global Voice over Wi-Fi Industry Volume K Unit Forecast, by Country 2019 & 2032
- Table 105: Global Voice over Wi-Fi Industry Revenue Million Forecast, by Voice Client 2019 & 2032
- Table 106: Global Voice over Wi-Fi Industry Volume K Unit Forecast, by Voice Client 2019 & 2032
- Table 107: Global Voice over Wi-Fi Industry Revenue Million Forecast, by Device Type 2019 & 2032
- Table 108: Global Voice over Wi-Fi Industry Volume K Unit Forecast, by Device Type 2019 & 2032
- Table 109: Global Voice over Wi-Fi Industry Revenue Million Forecast, by Country 2019 & 2032
- Table 110: Global Voice over Wi-Fi Industry Volume K Unit Forecast, by Country 2019 & 2032
- Table 111: Global Voice over Wi-Fi Industry Revenue Million Forecast, by Voice Client 2019 & 2032
- Table 112: Global Voice over Wi-Fi Industry Volume K Unit Forecast, by Voice Client 2019 & 2032
- Table 113: Global Voice over Wi-Fi Industry Revenue Million Forecast, by Device Type 2019 & 2032
- Table 114: Global Voice over Wi-Fi Industry Volume K Unit Forecast, by Device Type 2019 & 2032
- Table 115: Global Voice over Wi-Fi Industry Revenue Million Forecast, by Country 2019 & 2032
- Table 116: Global Voice over Wi-Fi Industry Volume K Unit Forecast, by Country 2019 & 2032
- Table 117: Global Voice over Wi-Fi Industry Revenue Million Forecast, by Voice Client 2019 & 2032
- Table 118: Global Voice over Wi-Fi Industry Volume K Unit Forecast, by Voice Client 2019 & 2032
- Table 119: Global Voice over Wi-Fi Industry Revenue Million Forecast, by Device Type 2019 & 2032
- Table 120: Global Voice over Wi-Fi Industry Volume K Unit Forecast, by Device Type 2019 & 2032
- Table 121: Global Voice over Wi-Fi Industry Revenue Million Forecast, by Country 2019 & 2032
- Table 122: Global Voice over Wi-Fi Industry Volume K Unit Forecast, by Country 2019 & 2032
- Table 123: Global Voice over Wi-Fi Industry Revenue Million Forecast, by Voice Client 2019 & 2032
- Table 124: Global Voice over Wi-Fi Industry Volume K Unit Forecast, by Voice Client 2019 & 2032
- Table 125: Global Voice over Wi-Fi Industry Revenue Million Forecast, by Device Type 2019 & 2032
- Table 126: Global Voice over Wi-Fi Industry Volume K Unit Forecast, by Device Type 2019 & 2032
- Table 127: Global Voice over Wi-Fi Industry Revenue Million Forecast, by Country 2019 & 2032
- Table 128: Global Voice over Wi-Fi Industry Volume K Unit Forecast, by Country 2019 & 2032
Frequently Asked Questions
1. What is the projected Compound Annual Growth Rate (CAGR) of the Voice over Wi-Fi Industry?
The projected CAGR is approximately > 18.06%.
2. Which companies are prominent players in the Voice over Wi-Fi Industry?
Key companies in the market include Aptilo Networks, Ericsson AB, Cisco Systems Inc, Mitel Networks Corporation, Huawei Technologies Co Ltd, Oracle Corporation, Nokia Corporation, Ribbon Communications, Alcatel-Lucent, KT Corporation.
3. What are the main segments of the Voice over Wi-Fi Industry?
The market segments include Voice Client, Device Type.
4. Can you provide details about the market size?
The market size is estimated to be USD 8.12 Million as of 2022.
5. What are some drivers contributing to market growth?
Increasing Internet Penetration; Reduction of Indoor Coverage Problems.
6. What are the notable trends driving market growth?
Public WiFi Hotspot to Gain Significant Market Share.
7. Are there any restraints impacting market growth?
Maintenance Problems Due to Carriers.
8. Can you provide examples of recent developments in the market?
October 2023 - Bharti Airtel, one of India’s leading telecommunications service providers, announced that it has partnered with Microsoft to provide Indian organizations calling services over Microsoft Teams through an integration with Airtel IQ. With Airtel IQ for Microsoft Teams, enterprises could enjoy greater flexibility in connecting with customers across the country over the fixed line through the internet.
9. What pricing options are available for accessing the report?
Pricing options include single-user, multi-user, and enterprise licenses priced at USD 4750, USD 5250, and USD 8750 respectively.
10. Is the market size provided in terms of value or volume?
The market size is provided in terms of value, measured in Million and volume, measured in K Unit.
11. Are there any specific market keywords associated with the report?
Yes, the market keyword associated with the report is "Voice over Wi-Fi Industry," which aids in identifying and referencing the specific market segment covered.
12. How do I determine which pricing option suits my needs best?
The pricing options vary based on user requirements and access needs. Individual users may opt for single-user licenses, while businesses requiring broader access may choose multi-user or enterprise licenses for cost-effective access to the report.
13. Are there any additional resources or data provided in the Voice over Wi-Fi Industry report?
While the report offers comprehensive insights, it's advisable to review the specific contents or supplementary materials provided to ascertain if additional resources or data are available.
14. How can I stay updated on further developments or reports in the Voice over Wi-Fi Industry?
To stay informed about further developments, trends, and reports in the Voice over Wi-Fi Industry, consider subscribing to industry newsletters, following relevant companies and organizations, or regularly checking reputable industry news sources and publications.
Methodology
Step 1 - Identification of Relevant Samples Size from Population Database


Step 2 - Approaches for Defining Global Market Size (Value, Volume* & Price*)

Note*: In applicable scenarios
Step 3 - Data Sources
Primary Research
- Web Analytics
- Survey Reports
- Research Institute
- Latest Research Reports
- Opinion Leaders
Secondary Research
- Annual Reports
- White Paper
- Latest Press Release
- Industry Association
- Paid Database
- Investor Presentations

Step 4 - Data Triangulation
Involves using different sources of information in order to increase the validity of a study
These sources are likely to be stakeholders in a program - participants, other researchers, program staff, other community members, and so on.
Then we put all data in single framework & apply various statistical tools to find out the dynamic on the market.
During the analysis stage, feedback from the stakeholder groups would be compared to determine areas of agreement as well as areas of divergence


