

Key Insights
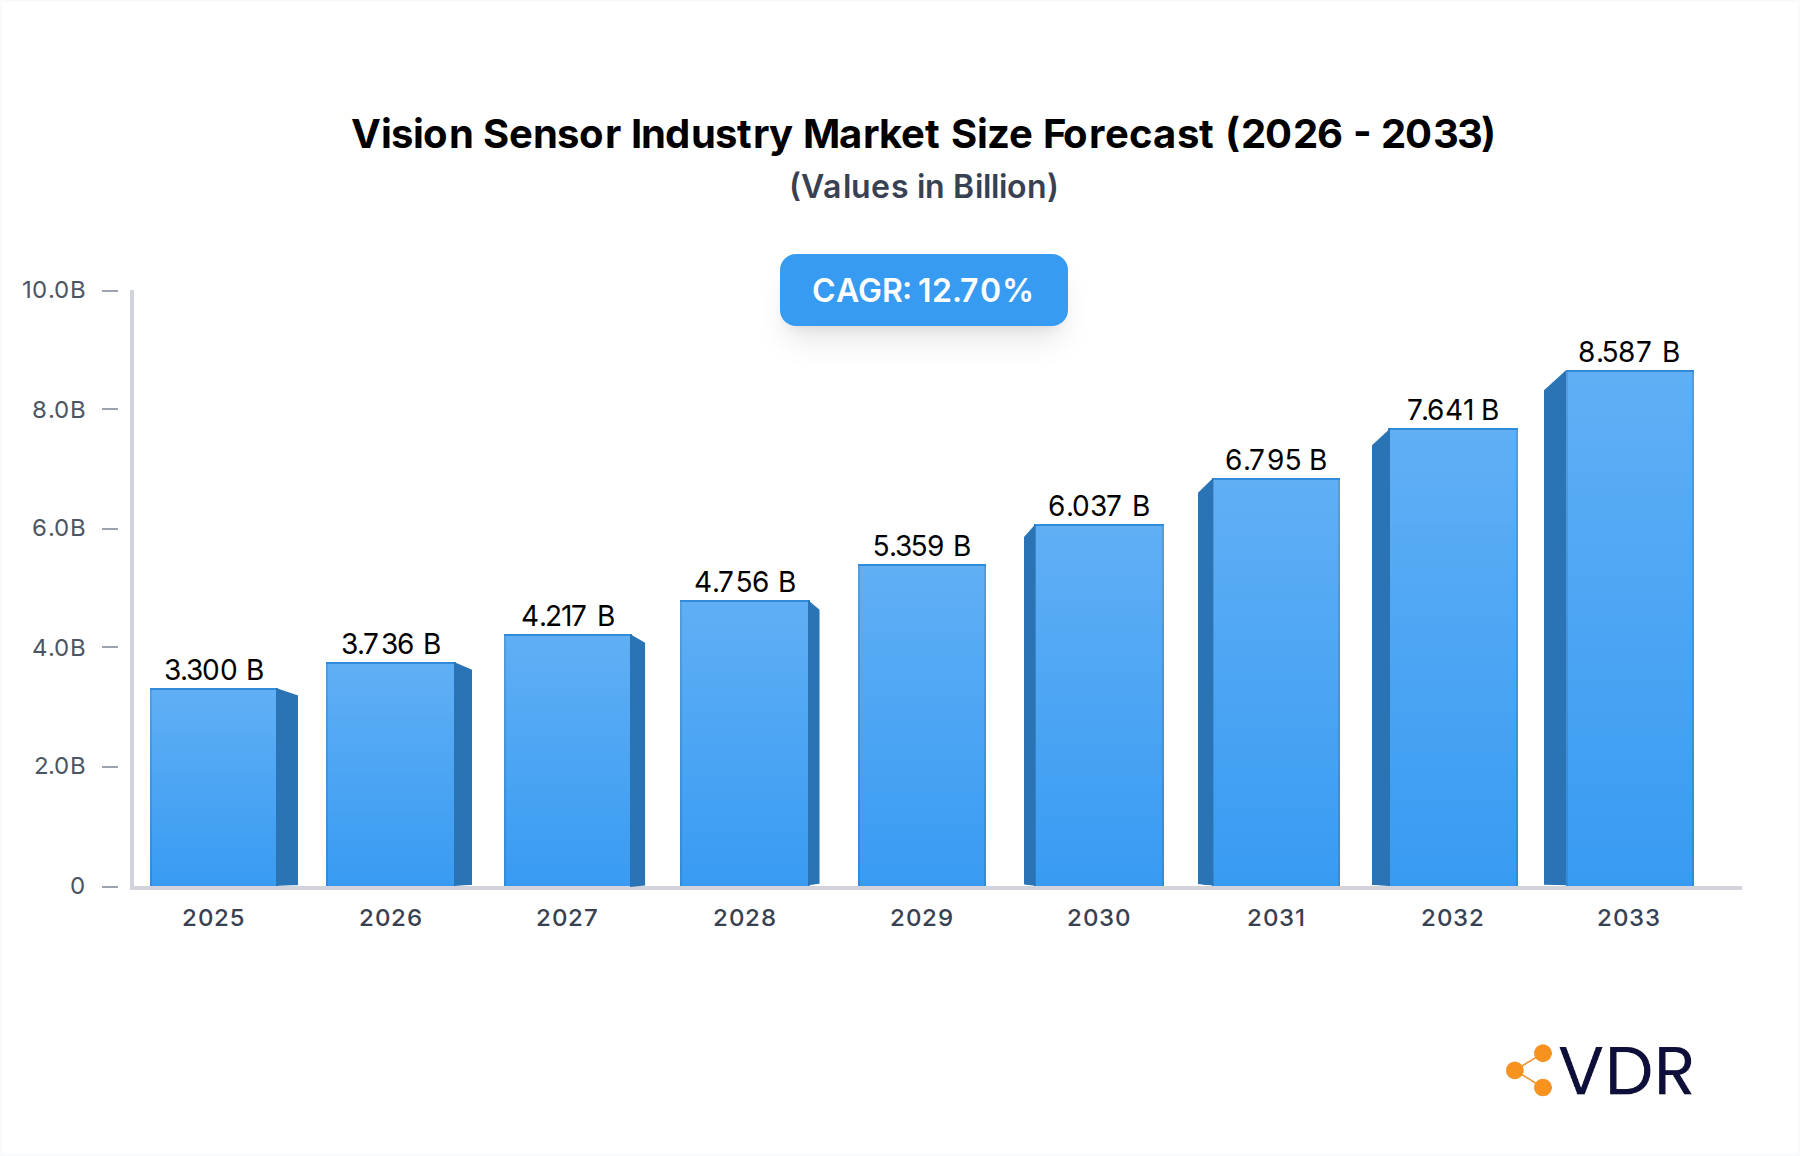
The global Vision Sensor Industry is poised for significant expansion, driven by escalating demand for automation and quality control across diverse manufacturing sectors. With an estimated market size of USD 3.3 billion in 2025, the industry is projected to experience a robust CAGR of 13.3% over the forecast period of 2025-2033. This growth is primarily fueled by the increasing adoption of smart manufacturing principles and Industry 4.0 initiatives. Key applications such as inspection, gauging, and code reading are witnessing widespread implementation, enabling manufacturers to enhance product quality, reduce defects, and optimize production processes. The automotive and consumer electronics industries are leading this surge, demanding sophisticated vision solutions for intricate assembly, defect detection, and traceability. Furthermore, the pharmaceutical and food & beverages sectors are increasingly recognizing the value of vision sensors for ensuring compliance with stringent regulatory standards and maintaining product integrity.

Vision Sensor Industry Market Size (In Billion)
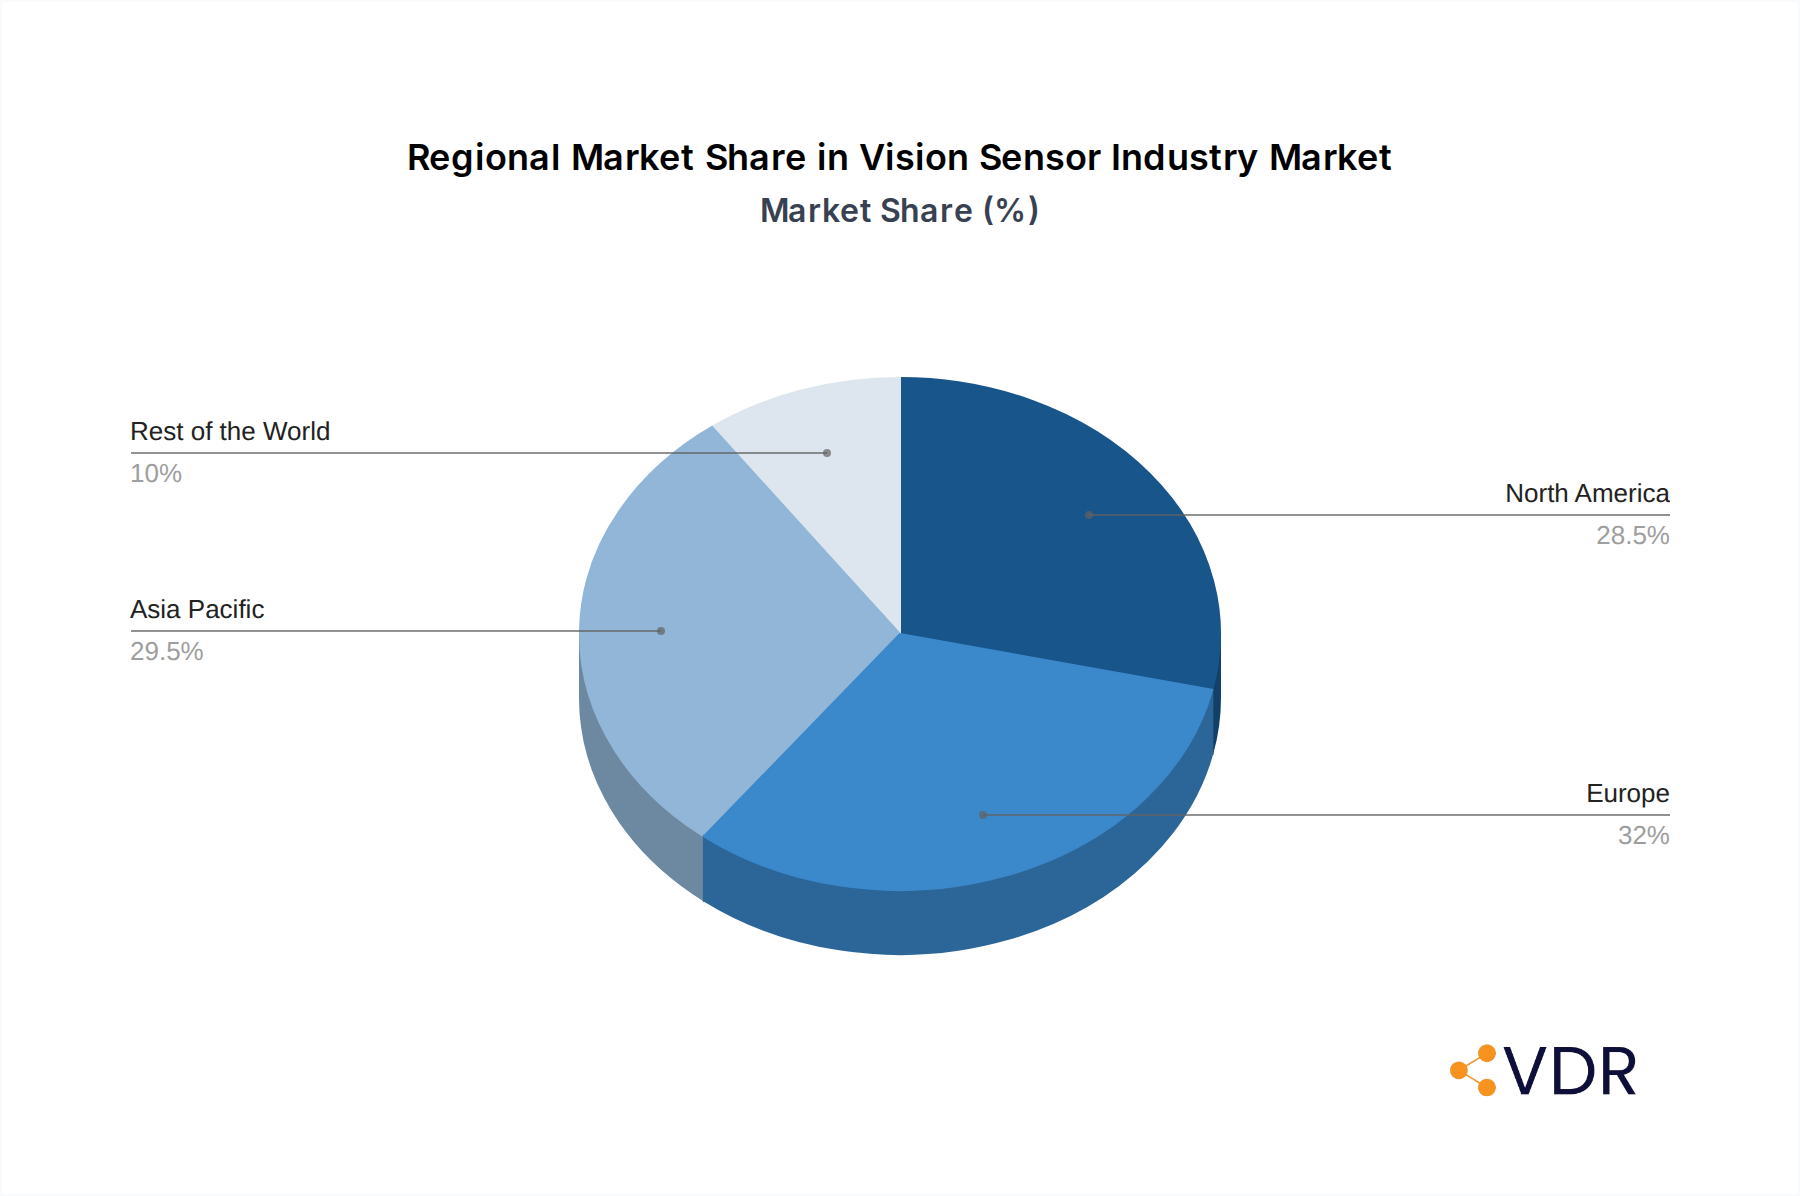
Emerging trends like the integration of AI and machine learning into vision systems are further propelling market growth, offering advanced analytical capabilities and predictive maintenance insights. These intelligent systems are becoming crucial for tackling complex inspection tasks and adapting to dynamic production environments. While the market exhibits strong growth potential, certain restraints may influence its trajectory. These include the initial high cost of sophisticated vision systems and the need for specialized technical expertise for implementation and maintenance. However, the continuous innovation by leading companies like Keyence Corporation, Cognex Corporation, and Sick AG, coupled with a growing understanding of the long-term return on investment, is expected to mitigate these challenges. The market's regional distribution indicates a strong presence in North America and Europe, with the Asia Pacific region expected to emerge as a significant growth engine due to rapid industrialization and a burgeoning manufacturing base, particularly in China and India.
Vision Sensor Industry Company Market Share
Vision Sensor Industry: Comprehensive Market Analysis & Future Outlook (2019-2033)
This in-depth report offers a comprehensive analysis of the global Vision Sensor Industry, charting its trajectory from 2019 to 2033. With a base year of 2025, the study provides critical insights into market dynamics, growth trends, regional dominance, product landscapes, key drivers, emerging opportunities, and the strategic moves of leading players. Leveraging high-traffic keywords such as "machine vision," "industrial automation," "quality control," "robot guidance," and "AI in manufacturing," this report is optimized for maximum search engine visibility and delivers unparalleled value to industry professionals. Explore the intricate parent and child market structures that define this rapidly evolving sector, with all monetary values presented in billions of U.S. dollars.
Vision Sensor Industry Market Dynamics & Structure
The Vision Sensor Industry is characterized by a moderately concentrated market structure, with a handful of global players holding significant market shares, alongside a growing number of niche and regional providers. Technological innovation is a primary driver, fueled by advancements in artificial intelligence (AI), deep learning algorithms, and enhanced sensor resolution, enabling more sophisticated inspection and guidance capabilities. Regulatory frameworks, particularly concerning product safety and data privacy in end-user industries like pharmaceuticals and food & beverages, are also shaping market demands for compliant and reliable vision solutions. Competitive product substitutes, such as traditional quality control methods and simpler sensing technologies, are gradually being displaced by the superior accuracy and efficiency offered by advanced vision sensors. End-user demographics are shifting towards industries prioritizing automation, precision, and traceability, including automotive manufacturing, consumer electronics production, and sophisticated packaging lines. Mergers and acquisitions (M&A) trends indicate a consolidation drive, with larger companies acquiring innovative startups to enhance their technology portfolios and expand their market reach.
- Market Concentration: Key players like Keyence Corporation, Cognex Corporation, and Sick AG hold a substantial collective market share, reflecting their established technological leadership and extensive product portfolios.
- Technological Innovation Drivers: The integration of AI and deep learning for pattern recognition and anomaly detection, along with the development of high-speed, high-resolution imaging sensors, are critical innovation catalysts.
- Regulatory Frameworks: Stringent quality and safety standards in the pharmaceutical and food & beverage sectors mandate precise inspection capabilities, driving demand for compliant vision systems.
- Competitive Product Substitutes: Traditional manual inspection and less sophisticated proximity sensors are facing increasing obsolescence as vision sensors offer superior performance in terms of speed, accuracy, and data collection.
- End-User Demographics: A growing demand from the automotive industry for advanced driver-assistance systems (ADAS) and autonomous driving technologies, as well as the consumer electronics sector's need for high-volume, high-precision assembly, are significant demographic shifts.
- M&A Trends: Strategic acquisitions by major players aim to integrate cutting-edge AI capabilities and expand into emerging application areas like robotics and logistics.
Vision Sensor Industry Growth Trends & Insights
The global Vision Sensor Industry is poised for robust growth, driven by the relentless pursuit of industrial automation, enhanced quality control, and increased operational efficiency across diverse end-user sectors. The market size is projected to expand significantly, from approximately $10.5 billion in 2019 to an estimated $25.2 billion by 2033, exhibiting a Compound Annual Growth Rate (CAGR) of XX% during the forecast period. This expansion is underpinned by increasing adoption rates of smart manufacturing technologies and the proliferation of Industry 4.0 initiatives worldwide. Technological disruptions, particularly the integration of AI, machine learning, and advanced imaging processing, are revolutionizing the capabilities of vision sensors, enabling them to perform complex tasks such as defect detection, object recognition, and precise measurement with unprecedented accuracy and speed. Consumer behavior shifts, including a growing demand for higher quality products with minimal defects and greater traceability throughout the supply chain, are also compelling manufacturers to invest in sophisticated vision inspection systems.
The adoption of machine vision in the automotive sector is being propelled by the need for advanced driver-assistance systems (ADAS) and the development of autonomous vehicles, where sophisticated object detection and scene understanding are paramount. Furthermore, the consumer electronics industry is leveraging vision sensors for high-volume, high-precision assembly and quality assurance of intricate components. The pharmaceutical industry's stringent regulatory requirements for product integrity and counterfeit prevention are driving the demand for advanced vision systems for drug inspection, packaging verification, and serialization. In the food and beverage sector, vision sensors are critical for ensuring product quality, safety, and compliance with labeling regulations, from ingredient inspection to final packaging checks. The “Other End-user Industries” segment, encompassing sectors like logistics, aerospace, and medical device manufacturing, is also witnessing substantial growth as these industries increasingly embrace automation and sophisticated quality control measures.
The continuous miniaturization of vision sensor components, coupled with advancements in processing power and AI algorithms, is leading to the development of more intelligent, compact, and cost-effective solutions. This trend is further democratizing access to advanced vision technology, enabling adoption even by small and medium-sized enterprises (SMEs). The increasing focus on predictive maintenance, where vision sensors can monitor machinery and identify potential issues before they lead to downtime, is another significant growth driver. Moreover, the integration of vision sensors with robotics is creating smarter, more adaptable automated systems capable of performing complex manipulation and assembly tasks with greater precision. The evolving landscape of industrial IoT (IIoT) platforms is also fostering greater connectivity and data exchange, allowing vision sensor data to be integrated into broader manufacturing intelligence systems for real-time decision-making and process optimization.
Dominant Regions, Countries, or Segments in Vision Sensor Industry
The global Vision Sensor Industry is currently experiencing dominant growth driven by advancements and adoption within specific regions and end-user industries, with the Automotive sector emerging as a leading segment. North America and Europe have historically been dominant regions due to early adoption of industrial automation and strong manufacturing bases. However, the Asia-Pacific region, particularly China, is rapidly emerging as a critical hub for manufacturing growth and technological advancement, significantly influencing global market dynamics. This region's dominance is fueled by its vast manufacturing capacity, increasing investments in Industry 4.0 technologies, and a burgeoning demand for sophisticated vision solutions from its expanding automotive and electronics sectors.
The Automotive industry stands out as a primary growth driver for the vision sensor market. The increasing complexity of vehicle manufacturing, coupled with the stringent safety regulations and the rapid development of autonomous driving technologies and advanced driver-assistance systems (ADAS), necessitates highly precise and reliable vision systems. These systems are crucial for tasks such as component inspection, robotic guidance for assembly, quality control of painted surfaces, and the detection of minute defects that could compromise safety or performance.
Key Drivers in the Automotive Segment:
- ADAS and Autonomous Driving: The development and adoption of ADAS features like adaptive cruise control, lane keeping assist, and automatic emergency braking rely heavily on vision sensors for object detection, recognition, and environmental perception.
- Robotic Integration: Vision-guided robots are indispensable for complex and repetitive tasks in automotive assembly lines, enhancing precision, speed, and flexibility.
- Quality Control and Defect Detection: Ensuring the highest quality standards for vehicle components, from small electronic parts to large body panels, is paramount, and vision sensors provide efficient and accurate inspection capabilities.
- Traceability and Compliance: Vision systems play a vital role in tracking components and ensuring compliance with rigorous automotive manufacturing standards and regulations.
Dominance Factors:
- Market Share: The automotive sector represents a substantial portion of the overall vision sensor market revenue, estimated at approximately 25-30% of the total market value.
- Growth Potential: With the continuous evolution of automotive technology and increasing global vehicle production, this segment offers significant growth potential for vision sensor manufacturers.
- Technological Advancement: The high-performance demands of the automotive industry push the boundaries of vision sensor technology, driving innovation in areas like 3D vision, deep learning for anomaly detection, and high-speed processing.
While other end-user industries such as Consumer Electronics, Electrical & Electronics, and Pharmaceuticals also contribute significantly to the vision sensor market, the automotive sector's demand for cutting-edge, high-volume, and safety-critical vision solutions positions it as a dominant force shaping the industry's growth trajectory. The integration of vision sensors into the automotive supply chain, from component manufacturing to final vehicle assembly, underscores its pivotal role in driving market expansion and technological innovation.
Vision Sensor Industry Product Landscape
The vision sensor product landscape is characterized by a rapid evolution of sophisticated technologies designed to meet increasingly demanding industrial applications. Innovations include high-resolution smart cameras with integrated processing capabilities, 2D and 3D vision sensors for precise measurements and defect detection, and specialized code readers for intricate bar codes and QR codes. Key product advancements focus on enhanced image processing algorithms, the integration of artificial intelligence for anomaly detection, and improved performance in challenging environments, such as high-speed production lines or extreme temperatures. Unique selling propositions often revolve around speed, accuracy, ease of integration, and the ability to handle complex inspection tasks.
Key Drivers, Barriers & Challenges in Vision Sensor Industry
Key Drivers: The Vision Sensor Industry is propelled by the relentless drive for automation and efficiency in manufacturing, enabling higher throughput and reduced labor costs. The growing demand for superior product quality and consistency, particularly in sectors like automotive and pharmaceuticals, mandates precise inspection capabilities. Advancements in Artificial Intelligence (AI) and Machine Learning (ML) are enabling more sophisticated defect detection and data analysis. Furthermore, the implementation of Industry 4.0 and smart manufacturing initiatives globally is creating a fertile ground for advanced vision solutions. The need for enhanced traceability and compliance with regulatory standards across various industries also acts as a significant catalyst.
Barriers & Challenges: One of the primary challenges is the initial high cost of implementation, which can be a barrier for small and medium-sized enterprises (SMEs). The complexity of integration with existing manufacturing systems and the requirement for specialized technical expertise pose another hurdle. Supply chain disruptions and component shortages can impact product availability and pricing. Moreover, data security and privacy concerns, especially with the increasing interconnectedness of vision systems, need careful consideration. The rapid pace of technological change also presents a challenge in keeping systems up-to-date and ensuring long-term compatibility, leading to potential obsolescence.
Emerging Opportunities in Vision Sensor Industry
Emerging opportunities in the Vision Sensor Industry are centered around the increasing adoption of AI-powered vision systems for predictive maintenance, enabling manufacturers to identify potential equipment failures before they occur. The growth of robotics and collaborative robots (cobots) creates a significant demand for vision sensors for guidance and interaction in complex assembly and logistics operations. The expansion of e-commerce and the need for efficient warehouse automation presents substantial opportunities for advanced barcode scanning and object recognition solutions. Furthermore, the growing demand for high-quality, defect-free products in emerging economies and the expansion of the medical device manufacturing sector offer untapped market potential for specialized vision inspection solutions. The development of more compact, cost-effective, and user-friendly vision sensors is also opening doors for wider adoption in niche applications and by smaller businesses.
Growth Accelerators in the Vision Sensor Industry Industry
Several key factors are accelerating the growth of the Vision Sensor Industry. The continuous development and integration of advanced AI and deep learning algorithms are making vision systems more intelligent and capable of handling increasingly complex inspection tasks with higher accuracy. Strategic partnerships and collaborations between vision sensor manufacturers and automation solution providers are expanding market reach and creating integrated solutions. The increasing global focus on smart manufacturing and Industry 4.0 adoption by governments and industries worldwide is a significant growth accelerator, driving demand for automation technologies, including vision systems. Furthermore, innovative product development leading to reduced costs and improved performance is making these technologies more accessible to a broader range of industries and applications. The expansion into new application areas such as quality control in additive manufacturing and advanced inspection in the renewable energy sector also contributes to sustained growth.
Key Players Shaping the Vision Sensor Industry Market
- Keyence Corporation
- Leuze Electronic GmbH & Co Kg
- Pepperl Fuchs GmbH
- Cognex Corporation
- Baumer Holding AG
- Sick AG
- Balluff GmbH
- Hans Turck GmbH & Co Kg
- Datalogic SPA
- Ifm Electronic GmbH
- Teledyne Technologies
- Basler AG
Notable Milestones in Vision Sensor Industry Sector
- 2019: Increased integration of deep learning algorithms into machine vision software, enhancing defect detection capabilities.
- 2020: Rise in demand for vision systems in the pharmaceutical industry for drug serialization and counterfeit detection due to global health concerns.
- 2021: Significant advancements in 3D vision technology, enabling more precise depth perception and volumetric measurements in industrial applications.
- 2022: Growing adoption of AI-powered vision sensors for robotic guidance in warehouse automation and logistics.
- 2023: Introduction of more compact and cost-effective smart cameras with enhanced processing power for wider market accessibility.
- 2024: Increased focus on sustainable manufacturing practices, driving demand for vision systems that improve process efficiency and reduce waste.
In-Depth Vision Sensor Industry Market Outlook
The future outlook for the Vision Sensor Industry is exceptionally bright, fueled by the sustained demand for automation, precision, and quality assurance across a multitude of global industries. Growth accelerators such as the pervasive integration of AI and machine learning, strategic collaborations, and the accelerating adoption of Industry 4.0 principles are set to drive significant market expansion. The industry is poised for continued innovation, with a focus on developing more intelligent, user-friendly, and cost-effective solutions that address emerging manufacturing challenges. The expanding application scope in areas like autonomous systems, advanced robotics, and critical infrastructure monitoring further solidifies the long-term growth potential and strategic importance of vision sensors in shaping the future of industrial operations.
Vision Sensor Industry Segmentation
-
1. Application
- 1.1. Inspection
- 1.2. Gauging
- 1.3. Code Reading
-
2. End-user Industry
- 2.1. Automotive
- 2.2. Consumer Electronics
- 2.3. Electrical & Electronics
- 2.4. Pharmaceutical
- 2.5. Food & Beverages
- 2.6. Other End-user Industries
Vision Sensor Industry Segmentation By Geography
-
1. North America
- 1.1. United States
- 1.2. Canada
-
2. Europe
- 2.1. United Kingdom
- 2.2. Germany
- 2.3. France
- 2.4. Italy
- 2.5. Rest of Europe
-
3. Asia Pacific
- 3.1. China
- 3.2. Japan
- 3.3. South Korea
- 3.4. India
- 3.5. Rest of Asia Pacific
-
4. Rest of the World
- 4.1. Latin America
- 4.2. Middle East
Vision Sensor Industry Regional Market Share
Geographic Coverage of Vision Sensor Industry
Vision Sensor Industry REPORT HIGHLIGHTS
| Aspects | Details |
|---|---|
| Study Period | 2020-2034 |
| Base Year | 2025 |
| Estimated Year | 2026 |
| Forecast Period | 2026-2034 |
| Historical Period | 2020-2025 |
| Growth Rate | CAGR of 13.3% from 2020-2034 |
| Segmentation |
|
Table of Contents
- 1. Introduction
- 1.1. Research Scope
- 1.2. Market Segmentation
- 1.3. Research Objective
- 1.4. Definitions and Assumptions
- 2. Executive Summary
- 2.1. Market Snapshot
- 3. Market Dynamics
- 3.1. Market Drivers
- 3.2. Market Restrains
- 3.3. Market Trends
- 3.4. Market Opportunities
- 4. Market Factor Analysis
- 4.1. Porters Five Forces
- 4.1.1. Bargaining Power of Suppliers
- 4.1.2. Bargaining Power of Buyers
- 4.1.3. Threat of New Entrants
- 4.1.4. Threat of Substitutes
- 4.1.5. Competitive Rivalry
- 4.2. PESTEL analysis
- 4.3. BCG Analysis
- 4.3.1. Stars (High Growth, High Market Share)
- 4.3.2. Cash Cows (Low Growth, High Market Share)
- 4.3.3. Question Mark (High Growth, Low Market Share)
- 4.3.4. Dogs (Low Growth, Low Market Share)
- 4.4. Ansoff Matrix Analysis
- 4.5. Supply Chain Analysis
- 4.6. Regulatory Landscape
- 4.7. Current Market Potential and Opportunity Assessment (TAM–SAM–SOM Framework)
- 4.8. VDR Analyst Note
- 4.1. Porters Five Forces
- 5. Market Analysis, Insights and Forecast 2021-2033
- 5.1. Market Analysis, Insights and Forecast - by Application
- 5.1.1. Inspection
- 5.1.2. Gauging
- 5.1.3. Code Reading
- 5.2. Market Analysis, Insights and Forecast - by End-user Industry
- 5.2.1. Automotive
- 5.2.2. Consumer Electronics
- 5.2.3. Electrical & Electronics
- 5.2.4. Pharmaceutical
- 5.2.5. Food & Beverages
- 5.2.6. Other End-user Industries
- 5.3. Market Analysis, Insights and Forecast - by Region
- 5.3.1. North America
- 5.3.2. Europe
- 5.3.3. Asia Pacific
- 5.3.4. Rest of the World
- 5.1. Market Analysis, Insights and Forecast - by Application
- 6. Global Vision Sensor Industry Analysis, Insights and Forecast, 2021-2033
- 6.1. Market Analysis, Insights and Forecast - by Application
- 6.1.1. Inspection
- 6.1.2. Gauging
- 6.1.3. Code Reading
- 6.2. Market Analysis, Insights and Forecast - by End-user Industry
- 6.2.1. Automotive
- 6.2.2. Consumer Electronics
- 6.2.3. Electrical & Electronics
- 6.2.4. Pharmaceutical
- 6.2.5. Food & Beverages
- 6.2.6. Other End-user Industries
- 6.1. Market Analysis, Insights and Forecast - by Application
- 7. North America Vision Sensor Industry Analysis, Insights and Forecast, 2021-2033
- 7.1. Market Analysis, Insights and Forecast - by Application
- 7.1.1. Inspection
- 7.1.2. Gauging
- 7.1.3. Code Reading
- 7.2. Market Analysis, Insights and Forecast - by End-user Industry
- 7.2.1. Automotive
- 7.2.2. Consumer Electronics
- 7.2.3. Electrical & Electronics
- 7.2.4. Pharmaceutical
- 7.2.5. Food & Beverages
- 7.2.6. Other End-user Industries
- 7.1. Market Analysis, Insights and Forecast - by Application
- 8. Europe Vision Sensor Industry Analysis, Insights and Forecast, 2021-2033
- 8.1. Market Analysis, Insights and Forecast - by Application
- 8.1.1. Inspection
- 8.1.2. Gauging
- 8.1.3. Code Reading
- 8.2. Market Analysis, Insights and Forecast - by End-user Industry
- 8.2.1. Automotive
- 8.2.2. Consumer Electronics
- 8.2.3. Electrical & Electronics
- 8.2.4. Pharmaceutical
- 8.2.5. Food & Beverages
- 8.2.6. Other End-user Industries
- 8.1. Market Analysis, Insights and Forecast - by Application
- 9. Asia Pacific Vision Sensor Industry Analysis, Insights and Forecast, 2021-2033
- 9.1. Market Analysis, Insights and Forecast - by Application
- 9.1.1. Inspection
- 9.1.2. Gauging
- 9.1.3. Code Reading
- 9.2. Market Analysis, Insights and Forecast - by End-user Industry
- 9.2.1. Automotive
- 9.2.2. Consumer Electronics
- 9.2.3. Electrical & Electronics
- 9.2.4. Pharmaceutical
- 9.2.5. Food & Beverages
- 9.2.6. Other End-user Industries
- 9.1. Market Analysis, Insights and Forecast - by Application
- 10. Rest of the World Vision Sensor Industry Analysis, Insights and Forecast, 2021-2033
- 10.1. Market Analysis, Insights and Forecast - by Application
- 10.1.1. Inspection
- 10.1.2. Gauging
- 10.1.3. Code Reading
- 10.2. Market Analysis, Insights and Forecast - by End-user Industry
- 10.2.1. Automotive
- 10.2.2. Consumer Electronics
- 10.2.3. Electrical & Electronics
- 10.2.4. Pharmaceutical
- 10.2.5. Food & Beverages
- 10.2.6. Other End-user Industries
- 10.1. Market Analysis, Insights and Forecast - by Application
- 11. Competitive Analysis
- 11.1. Company Profiles
- 11.1.1 Keyence Corporation
- 11.1.1.1. Company Overview
- 11.1.1.2. Products
- 11.1.1.3. Company Financials
- 11.1.1.4. SWOT Analysis
- 11.1.2 Leuze Electronic GmbH & Co Kg
- 11.1.2.1. Company Overview
- 11.1.2.2. Products
- 11.1.2.3. Company Financials
- 11.1.2.4. SWOT Analysis
- 11.1.3 Pepperl Fuchs GmbH
- 11.1.3.1. Company Overview
- 11.1.3.2. Products
- 11.1.3.3. Company Financials
- 11.1.3.4. SWOT Analysis
- 11.1.4 Cognex Corporation
- 11.1.4.1. Company Overview
- 11.1.4.2. Products
- 11.1.4.3. Company Financials
- 11.1.4.4. SWOT Analysis
- 11.1.5 Baumer Holding AG
- 11.1.5.1. Company Overview
- 11.1.5.2. Products
- 11.1.5.3. Company Financials
- 11.1.5.4. SWOT Analysis
- 11.1.6 Sick AG
- 11.1.6.1. Company Overview
- 11.1.6.2. Products
- 11.1.6.3. Company Financials
- 11.1.6.4. SWOT Analysis
- 11.1.7 Balluff GmbH
- 11.1.7.1. Company Overview
- 11.1.7.2. Products
- 11.1.7.3. Company Financials
- 11.1.7.4. SWOT Analysis
- 11.1.8 Hans Turck GmbH & Co Kg
- 11.1.8.1. Company Overview
- 11.1.8.2. Products
- 11.1.8.3. Company Financials
- 11.1.8.4. SWOT Analysis
- 11.1.9 Datalogic SPA
- 11.1.9.1. Company Overview
- 11.1.9.2. Products
- 11.1.9.3. Company Financials
- 11.1.9.4. SWOT Analysis
- 11.1.10 Ifm Electronic GmbH
- 11.1.10.1. Company Overview
- 11.1.10.2. Products
- 11.1.10.3. Company Financials
- 11.1.10.4. SWOT Analysis
- 11.1.11 Teledyne Technologies
- 11.1.11.1. Company Overview
- 11.1.11.2. Products
- 11.1.11.3. Company Financials
- 11.1.11.4. SWOT Analysis
- 11.1.12 Basler AG
- 11.1.12.1. Company Overview
- 11.1.12.2. Products
- 11.1.12.3. Company Financials
- 11.1.12.4. SWOT Analysis
- 11.1.1 Keyence Corporation
- 11.2. Market Entropy
- 11.2.1 Company's Key Areas Served
- 11.2.2 Recent Developments
- 11.3. Company Market Share Analysis 2025
- 11.3.1 Top 5 Companies Market Share Analysis
- 11.3.2 Top 3 Companies Market Share Analysis
- 11.4. List of Potential Customers
- 12. Research Methodology
List of Figures
- Figure 1: Global Vision Sensor Industry Revenue Breakdown (billion, %) by Region 2025 & 2033
- Figure 2: Global Vision Sensor Industry Volume Breakdown (K Unit, %) by Region 2025 & 2033
- Figure 3: North America Vision Sensor Industry Revenue (billion), by Application 2025 & 2033
- Figure 4: North America Vision Sensor Industry Volume (K Unit), by Application 2025 & 2033
- Figure 5: North America Vision Sensor Industry Revenue Share (%), by Application 2025 & 2033
- Figure 6: North America Vision Sensor Industry Volume Share (%), by Application 2025 & 2033
- Figure 7: North America Vision Sensor Industry Revenue (billion), by End-user Industry 2025 & 2033
- Figure 8: North America Vision Sensor Industry Volume (K Unit), by End-user Industry 2025 & 2033
- Figure 9: North America Vision Sensor Industry Revenue Share (%), by End-user Industry 2025 & 2033
- Figure 10: North America Vision Sensor Industry Volume Share (%), by End-user Industry 2025 & 2033
- Figure 11: North America Vision Sensor Industry Revenue (billion), by Country 2025 & 2033
- Figure 12: North America Vision Sensor Industry Volume (K Unit), by Country 2025 & 2033
- Figure 13: North America Vision Sensor Industry Revenue Share (%), by Country 2025 & 2033
- Figure 14: North America Vision Sensor Industry Volume Share (%), by Country 2025 & 2033
- Figure 15: Europe Vision Sensor Industry Revenue (billion), by Application 2025 & 2033
- Figure 16: Europe Vision Sensor Industry Volume (K Unit), by Application 2025 & 2033
- Figure 17: Europe Vision Sensor Industry Revenue Share (%), by Application 2025 & 2033
- Figure 18: Europe Vision Sensor Industry Volume Share (%), by Application 2025 & 2033
- Figure 19: Europe Vision Sensor Industry Revenue (billion), by End-user Industry 2025 & 2033
- Figure 20: Europe Vision Sensor Industry Volume (K Unit), by End-user Industry 2025 & 2033
- Figure 21: Europe Vision Sensor Industry Revenue Share (%), by End-user Industry 2025 & 2033
- Figure 22: Europe Vision Sensor Industry Volume Share (%), by End-user Industry 2025 & 2033
- Figure 23: Europe Vision Sensor Industry Revenue (billion), by Country 2025 & 2033
- Figure 24: Europe Vision Sensor Industry Volume (K Unit), by Country 2025 & 2033
- Figure 25: Europe Vision Sensor Industry Revenue Share (%), by Country 2025 & 2033
- Figure 26: Europe Vision Sensor Industry Volume Share (%), by Country 2025 & 2033
- Figure 27: Asia Pacific Vision Sensor Industry Revenue (billion), by Application 2025 & 2033
- Figure 28: Asia Pacific Vision Sensor Industry Volume (K Unit), by Application 2025 & 2033
- Figure 29: Asia Pacific Vision Sensor Industry Revenue Share (%), by Application 2025 & 2033
- Figure 30: Asia Pacific Vision Sensor Industry Volume Share (%), by Application 2025 & 2033
- Figure 31: Asia Pacific Vision Sensor Industry Revenue (billion), by End-user Industry 2025 & 2033
- Figure 32: Asia Pacific Vision Sensor Industry Volume (K Unit), by End-user Industry 2025 & 2033
- Figure 33: Asia Pacific Vision Sensor Industry Revenue Share (%), by End-user Industry 2025 & 2033
- Figure 34: Asia Pacific Vision Sensor Industry Volume Share (%), by End-user Industry 2025 & 2033
- Figure 35: Asia Pacific Vision Sensor Industry Revenue (billion), by Country 2025 & 2033
- Figure 36: Asia Pacific Vision Sensor Industry Volume (K Unit), by Country 2025 & 2033
- Figure 37: Asia Pacific Vision Sensor Industry Revenue Share (%), by Country 2025 & 2033
- Figure 38: Asia Pacific Vision Sensor Industry Volume Share (%), by Country 2025 & 2033
- Figure 39: Rest of the World Vision Sensor Industry Revenue (billion), by Application 2025 & 2033
- Figure 40: Rest of the World Vision Sensor Industry Volume (K Unit), by Application 2025 & 2033
- Figure 41: Rest of the World Vision Sensor Industry Revenue Share (%), by Application 2025 & 2033
- Figure 42: Rest of the World Vision Sensor Industry Volume Share (%), by Application 2025 & 2033
- Figure 43: Rest of the World Vision Sensor Industry Revenue (billion), by End-user Industry 2025 & 2033
- Figure 44: Rest of the World Vision Sensor Industry Volume (K Unit), by End-user Industry 2025 & 2033
- Figure 45: Rest of the World Vision Sensor Industry Revenue Share (%), by End-user Industry 2025 & 2033
- Figure 46: Rest of the World Vision Sensor Industry Volume Share (%), by End-user Industry 2025 & 2033
- Figure 47: Rest of the World Vision Sensor Industry Revenue (billion), by Country 2025 & 2033
- Figure 48: Rest of the World Vision Sensor Industry Volume (K Unit), by Country 2025 & 2033
- Figure 49: Rest of the World Vision Sensor Industry Revenue Share (%), by Country 2025 & 2033
- Figure 50: Rest of the World Vision Sensor Industry Volume Share (%), by Country 2025 & 2033
List of Tables
- Table 1: Global Vision Sensor Industry Revenue billion Forecast, by Application 2020 & 2033
- Table 2: Global Vision Sensor Industry Volume K Unit Forecast, by Application 2020 & 2033
- Table 3: Global Vision Sensor Industry Revenue billion Forecast, by End-user Industry 2020 & 2033
- Table 4: Global Vision Sensor Industry Volume K Unit Forecast, by End-user Industry 2020 & 2033
- Table 5: Global Vision Sensor Industry Revenue billion Forecast, by Region 2020 & 2033
- Table 6: Global Vision Sensor Industry Volume K Unit Forecast, by Region 2020 & 2033
- Table 7: Global Vision Sensor Industry Revenue billion Forecast, by Application 2020 & 2033
- Table 8: Global Vision Sensor Industry Volume K Unit Forecast, by Application 2020 & 2033
- Table 9: Global Vision Sensor Industry Revenue billion Forecast, by End-user Industry 2020 & 2033
- Table 10: Global Vision Sensor Industry Volume K Unit Forecast, by End-user Industry 2020 & 2033
- Table 11: Global Vision Sensor Industry Revenue billion Forecast, by Country 2020 & 2033
- Table 12: Global Vision Sensor Industry Volume K Unit Forecast, by Country 2020 & 2033
- Table 13: United States Vision Sensor Industry Revenue (billion) Forecast, by Application 2020 & 2033
- Table 14: United States Vision Sensor Industry Volume (K Unit) Forecast, by Application 2020 & 2033
- Table 15: Canada Vision Sensor Industry Revenue (billion) Forecast, by Application 2020 & 2033
- Table 16: Canada Vision Sensor Industry Volume (K Unit) Forecast, by Application 2020 & 2033
- Table 17: Global Vision Sensor Industry Revenue billion Forecast, by Application 2020 & 2033
- Table 18: Global Vision Sensor Industry Volume K Unit Forecast, by Application 2020 & 2033
- Table 19: Global Vision Sensor Industry Revenue billion Forecast, by End-user Industry 2020 & 2033
- Table 20: Global Vision Sensor Industry Volume K Unit Forecast, by End-user Industry 2020 & 2033
- Table 21: Global Vision Sensor Industry Revenue billion Forecast, by Country 2020 & 2033
- Table 22: Global Vision Sensor Industry Volume K Unit Forecast, by Country 2020 & 2033
- Table 23: United Kingdom Vision Sensor Industry Revenue (billion) Forecast, by Application 2020 & 2033
- Table 24: United Kingdom Vision Sensor Industry Volume (K Unit) Forecast, by Application 2020 & 2033
- Table 25: Germany Vision Sensor Industry Revenue (billion) Forecast, by Application 2020 & 2033
- Table 26: Germany Vision Sensor Industry Volume (K Unit) Forecast, by Application 2020 & 2033
- Table 27: France Vision Sensor Industry Revenue (billion) Forecast, by Application 2020 & 2033
- Table 28: France Vision Sensor Industry Volume (K Unit) Forecast, by Application 2020 & 2033
- Table 29: Italy Vision Sensor Industry Revenue (billion) Forecast, by Application 2020 & 2033
- Table 30: Italy Vision Sensor Industry Volume (K Unit) Forecast, by Application 2020 & 2033
- Table 31: Rest of Europe Vision Sensor Industry Revenue (billion) Forecast, by Application 2020 & 2033
- Table 32: Rest of Europe Vision Sensor Industry Volume (K Unit) Forecast, by Application 2020 & 2033
- Table 33: Global Vision Sensor Industry Revenue billion Forecast, by Application 2020 & 2033
- Table 34: Global Vision Sensor Industry Volume K Unit Forecast, by Application 2020 & 2033
- Table 35: Global Vision Sensor Industry Revenue billion Forecast, by End-user Industry 2020 & 2033
- Table 36: Global Vision Sensor Industry Volume K Unit Forecast, by End-user Industry 2020 & 2033
- Table 37: Global Vision Sensor Industry Revenue billion Forecast, by Country 2020 & 2033
- Table 38: Global Vision Sensor Industry Volume K Unit Forecast, by Country 2020 & 2033
- Table 39: China Vision Sensor Industry Revenue (billion) Forecast, by Application 2020 & 2033
- Table 40: China Vision Sensor Industry Volume (K Unit) Forecast, by Application 2020 & 2033
- Table 41: Japan Vision Sensor Industry Revenue (billion) Forecast, by Application 2020 & 2033
- Table 42: Japan Vision Sensor Industry Volume (K Unit) Forecast, by Application 2020 & 2033
- Table 43: South Korea Vision Sensor Industry Revenue (billion) Forecast, by Application 2020 & 2033
- Table 44: South Korea Vision Sensor Industry Volume (K Unit) Forecast, by Application 2020 & 2033
- Table 45: India Vision Sensor Industry Revenue (billion) Forecast, by Application 2020 & 2033
- Table 46: India Vision Sensor Industry Volume (K Unit) Forecast, by Application 2020 & 2033
- Table 47: Rest of Asia Pacific Vision Sensor Industry Revenue (billion) Forecast, by Application 2020 & 2033
- Table 48: Rest of Asia Pacific Vision Sensor Industry Volume (K Unit) Forecast, by Application 2020 & 2033
- Table 49: Global Vision Sensor Industry Revenue billion Forecast, by Application 2020 & 2033
- Table 50: Global Vision Sensor Industry Volume K Unit Forecast, by Application 2020 & 2033
- Table 51: Global Vision Sensor Industry Revenue billion Forecast, by End-user Industry 2020 & 2033
- Table 52: Global Vision Sensor Industry Volume K Unit Forecast, by End-user Industry 2020 & 2033
- Table 53: Global Vision Sensor Industry Revenue billion Forecast, by Country 2020 & 2033
- Table 54: Global Vision Sensor Industry Volume K Unit Forecast, by Country 2020 & 2033
- Table 55: Latin America Vision Sensor Industry Revenue (billion) Forecast, by Application 2020 & 2033
- Table 56: Latin America Vision Sensor Industry Volume (K Unit) Forecast, by Application 2020 & 2033
- Table 57: Middle East Vision Sensor Industry Revenue (billion) Forecast, by Application 2020 & 2033
- Table 58: Middle East Vision Sensor Industry Volume (K Unit) Forecast, by Application 2020 & 2033
Frequently Asked Questions
1. What is the projected Compound Annual Growth Rate (CAGR) of the Vision Sensor Industry?
The projected CAGR is approximately 13.3%.
2. Which companies are prominent players in the Vision Sensor Industry?
Key companies in the market include Keyence Corporation, Leuze Electronic GmbH & Co Kg, Pepperl Fuchs GmbH, Cognex Corporation, Baumer Holding AG, Sick AG, Balluff GmbH, Hans Turck GmbH & Co Kg, Datalogic SPA, Ifm Electronic GmbH, Teledyne Technologies, Basler AG.
3. What are the main segments of the Vision Sensor Industry?
The market segments include Application, End-user Industry.
4. Can you provide details about the market size?
The market size is estimated to be USD 3.3 billion as of 2022.
5. What are some drivers contributing to market growth?
; Use of Machine Vision Technology in Automotive Industry; Focus of Manufacturing Companies on Cost and Time Saving; Growth of Electronics and Electrical Industry.
6. What are the notable trends driving market growth?
Automotive Expected to Hold Significant Growth.
7. Are there any restraints impacting market growth?
; High Installation and Labor Costs.
8. Can you provide examples of recent developments in the market?
N/A
9. What pricing options are available for accessing the report?
Pricing options include single-user, multi-user, and enterprise licenses priced at USD 4750, USD 5250, and USD 8750 respectively.
10. Is the market size provided in terms of value or volume?
The market size is provided in terms of value, measured in billion and volume, measured in K Unit.
11. Are there any specific market keywords associated with the report?
Yes, the market keyword associated with the report is "Vision Sensor Industry," which aids in identifying and referencing the specific market segment covered.
12. How do I determine which pricing option suits my needs best?
The pricing options vary based on user requirements and access needs. Individual users may opt for single-user licenses, while businesses requiring broader access may choose multi-user or enterprise licenses for cost-effective access to the report.
13. Are there any additional resources or data provided in the Vision Sensor Industry report?
While the report offers comprehensive insights, it's advisable to review the specific contents or supplementary materials provided to ascertain if additional resources or data are available.
14. How can I stay updated on further developments or reports in the Vision Sensor Industry?
To stay informed about further developments, trends, and reports in the Vision Sensor Industry, consider subscribing to industry newsletters, following relevant companies and organizations, or regularly checking reputable industry news sources and publications.
Methodology
Step 1 - Identification of Relevant Samples Size from Population Database


Step 2 - Approaches for Defining Global Market Size (Value, Volume* & Price*)

Note*: In applicable scenarios
Step 3 - Data Sources
Primary Research
- Web Analytics
- Survey Reports
- Research Institute
- Latest Research Reports
- Opinion Leaders
Secondary Research
- Annual Reports
- White Paper
- Latest Press Release
- Industry Association
- Paid Database
- Investor Presentations

Step 4 - Data Triangulation
Involves using different sources of information in order to increase the validity of a study
These sources are likely to be stakeholders in a program - participants, other researchers, program staff, other community members, and so on.
Then we put all data in single framework & apply various statistical tools to find out the dynamic on the market.
During the analysis stage, feedback from the stakeholder groups would be compared to determine areas of agreement as well as areas of divergence