Key Insights
The global Vehicle Urea Tank market is poised for substantial growth, projected to reach USD 11.57 billion in 2025 with a robust Compound Annual Growth Rate (CAGR) of 13.09% throughout the forecast period of 2025-2033. This significant expansion is primarily fueled by increasingly stringent emission regulations worldwide, compelling automotive manufacturers to equip vehicles with Selective Catalytic Reduction (SCR) systems, which rely on urea tanks to store Diesel Exhaust Fluid (DEF). The rising adoption of diesel vehicles, especially in the commercial and heavy-duty segments, further underpins this market's upward trajectory. Innovations in tank design, focusing on improved durability, lighter materials, and enhanced DEF heating/cooling capabilities to ensure optimal performance in diverse climatic conditions, are also driving market demand. Companies are investing in advanced manufacturing techniques and materials like high-density polyethylene (HDPE) and aluminum to meet these evolving requirements.
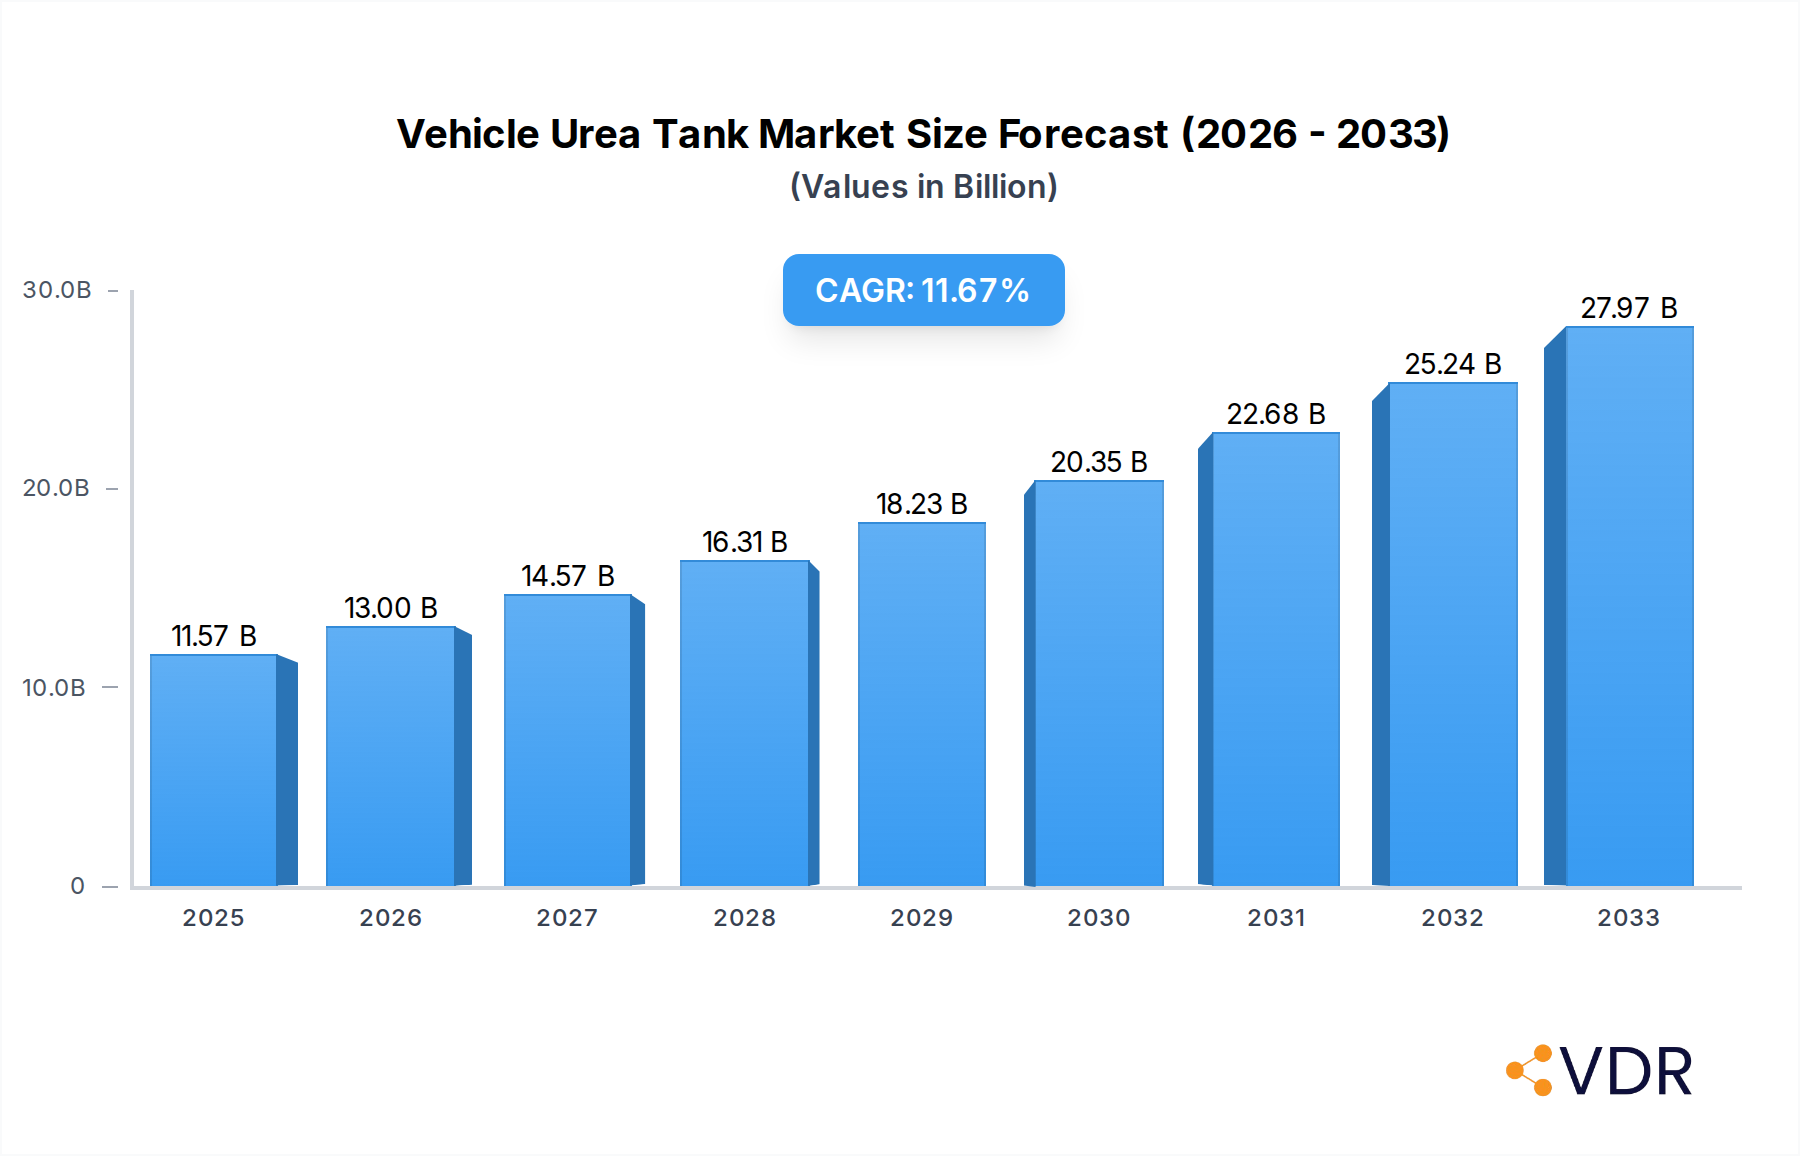
Vehicle Urea Tank Market Size (In Billion)
The market is segmented by application into Heavy Duty (HD) Off Road and HD On Road vehicles, with the latter segment likely dominating due to the larger volume of on-road commercial fleets. In terms of type, the 19-liter, 38-liter, and 57-liter tank capacities are expected to witness significant demand, catering to the varying DEF storage needs of different vehicle classes. The Asia Pacific region, led by China and India, is anticipated to emerge as a major growth engine, driven by rapid industrialization, increasing vehicle parc, and supportive government policies promoting cleaner transportation. North America and Europe, already mature markets with established emission standards, will continue to represent substantial shares, driven by fleet renewals and retrofitting initiatives. Key players like Cummins, Elkhart Plastics, and Rochling Group are actively engaged in expanding their production capacities and product portfolios to capture market opportunities and cater to the evolving needs of the automotive industry in this dynamic landscape.

Vehicle Urea Tank Company Market Share
Report Description: Global Vehicle Urea Tank Market Outlook 2024-2033: Navigating Emissions Regulations and Technological Advancements
This comprehensive report offers an in-depth analysis of the global Vehicle Urea Tank market, providing critical insights into its dynamics, growth trajectory, and future outlook. We delve into the intricate factors shaping the market, from stringent environmental regulations driving the adoption of Selective Catalytic Reduction (SCR) systems to the ongoing technological innovations in urea tank design and manufacturing. With a focus on both parent and child markets, this report is an indispensable resource for industry stakeholders seeking to understand market concentration, identify growth opportunities, and navigate the competitive landscape.
The study encompasses a detailed examination of the market from 2019 to 2033, with a base year of 2025 and a forecast period from 2025 to 2033. Historical data from 2019 to 2024 provides essential context for understanding current trends. All market size values are presented in billion units.
Vehicle Urea Tank Market Dynamics & Structure
The global Vehicle Urea Tank market is characterized by moderate to high concentration, with key players investing heavily in research and development to meet evolving emission standards. Technological innovation is primarily driven by the need for more efficient and durable urea storage and delivery systems, focusing on features like integrated heating elements, improved material durability, and advanced sensor technologies for precise urea level monitoring. Regulatory frameworks, particularly stringent emissions mandates like Euro 6 and EPA Tier 4, are the most significant demand drivers, compelling manufacturers to integrate SCR systems, and consequently, urea tanks. Competitive product substitutes are limited, as urea tanks are an integral component of SCR systems. End-user demographics are primarily commercial vehicle operators (heavy-duty trucks, buses) and off-road equipment operators, with increasing adoption in passenger vehicles in certain regions. Mergers and acquisitions (M&A) trends are observed as companies seek to expand their product portfolios, gain market share, and achieve economies of scale. For instance, in 2023, a significant M&A deal occurred, involving a market share shift of approximately 3-5% for the acquiring entity. Innovation barriers include the high cost of R&D for advanced materials and the long certification processes for new components.
- Market Concentration: Moderate to High, with strategic partnerships and acquisitions driving consolidation.
- Technological Innovation Drivers:
- Enhanced urea freezing prevention mechanisms.
- Lightweight and durable material development.
- Integration of smart sensors for real-time monitoring.
- Regulatory Frameworks: Stringent emission standards (Euro 6, EPA Tier 4) are paramount.
- Competitive Product Substitutes: Limited, primarily system-level integration rather than direct component substitution.
- End-User Demographics: Heavy-duty on-road, off-road, and increasingly, passenger vehicle segments.
- M&A Trends: Focused on vertical integration and expanding geographical reach.
- Innovation Barriers: High R&D investment, complex regulatory approvals.
Vehicle Urea Tank Growth Trends & Insights
The global Vehicle Urea Tank market is poised for robust growth, fueled by the accelerating implementation of stringent emission control regulations worldwide. The market size is projected to expand at a Compound Annual Growth Rate (CAGR) of XX% from 2025 to 2033, reaching an estimated value of USD XX billion by the end of the forecast period. This expansion is underpinned by the increasing adoption of SCR technology across all vehicle segments, necessitated by legislations aimed at reducing nitrogen oxide (NOx) emissions. The base year 2025 witnessed a market valuation of approximately USD XX billion. Adoption rates for urea tanks are directly correlated with new vehicle production and the retrofitting of older fleets to comply with environmental mandates. Technological disruptions are emerging in the form of improved urea tank materials offering greater chemical resistance and thermal insulation, as well as advancements in urea quality sensors that enhance the efficiency of SCR systems. Consumer behavior shifts are less direct but are influenced by the growing awareness of environmental sustainability and the increasing demand for cleaner transportation solutions. Market penetration of SCR systems, and consequently urea tanks, is expected to rise from approximately XX% in 2025 to over XX% by 2033 in key regulated markets. The operational efficiency and lifespan of urea tanks are also becoming key considerations for fleet operators, driving demand for premium, long-lasting solutions. Furthermore, the development of integrated urea tank systems that minimize component count and simplify installation is a notable trend.
Dominant Regions, Countries, or Segments in Vehicle Urea Tank
The HD On Road application segment is identified as the dominant force driving growth in the global Vehicle Urea Tank market. This dominance stems from the massive scale of the commercial trucking and bus industry, which is subject to the most stringent and consistently enforced emission regulations across major economies. Regions like North America and Europe are leading the charge due to their established and evolving environmental policies, mandating the widespread adoption of SCR technology in heavy-duty vehicles. For instance, the United States and Germany are key countries, representing a significant portion of the market share in the HD On Road segment. The market share for the HD On Road application is estimated to be XX% in 2025, projected to grow to XX% by 2033. Economic policies in these regions, such as incentives for cleaner fleets and penalties for non-compliance, further bolster the demand for urea tanks. Infrastructure development supporting the logistics and transportation sectors also plays a crucial role. In Europe, the Euro VI emission standards have been a primary catalyst, while in North America, EPA Tier 4 regulations have driven substantial market penetration. The 38 Liters and 57 Liters tank types are particularly prevalent within the HD On Road segment due to their capacity requirements for long-haul operations, contributing approximately XX% and XX% respectively to the segment's value in 2025. The growth potential in these regions is further amplified by the continuous replacement of older, less efficient vehicles with newer models equipped with SCR systems.
- Dominant Application: HD On Road
- Leading Regions: North America, Europe
- Key Countries: United States, Germany, France
- Dominant Tank Types: 38 Liters, 57 Liters
- Key Drivers:
- Strict emission regulations (Euro VI, EPA Tier 4).
- Large commercial vehicle fleet sizes.
- Government incentives for cleaner transportation.
- Robust logistics and transportation infrastructure.
- Market Share (HD On Road): ~XX% in 2025, projected ~XX% by 2033.
- Growth Potential: High due to ongoing fleet modernization and regulatory compliance.
Vehicle Urea Tank Product Landscape
The Vehicle Urea Tank product landscape is characterized by a strong emphasis on enhanced functionality and durability. Innovations are geared towards improving urea purity sensing, efficient heating to prevent freezing in cold climates, and the integration of self-cleaning mechanisms. Manufacturers are increasingly adopting advanced polymers and composite materials to offer lighter, more robust tanks with superior chemical resistance to urea. Product performance metrics are evaluated based on durability, thermal insulation capabilities, fluid resistance, and the precision of integrated sensor systems, which are critical for SCR system efficiency. Unique selling propositions often lie in integrated solutions that reduce the number of components and simplify installation, along with advanced urea quality monitoring systems that prevent engine damage.
Key Drivers, Barriers & Challenges in Vehicle Urea Tank
The primary forces propelling the Vehicle Urea Tank market include the relentless pursuit of stricter global emission standards, the increasing demand for fuel-efficient vehicles, and the growing awareness of environmental sustainability. Technological advancements in SCR systems and the ongoing development of lighter, more durable urea tank materials also act as significant drivers. The expansion of commercial vehicle fleets worldwide further fuels demand.
Key challenges include the volatile pricing of raw materials, particularly plastics and specialized polymers. Supply chain disruptions, as seen in recent years, can impact production timelines and costs. Regulatory hurdles, while driving demand, also necessitate significant investment in compliance testing and validation for new products. Competitive pressures among established manufacturers and new entrants can lead to price erosion.
- Key Drivers:
- Stringent emission regulations.
- Growth in commercial vehicle production.
- Technological advancements in SCR systems.
- Focus on environmental sustainability.
- Key Barriers & Challenges:
- Raw material price volatility.
- Supply chain complexities.
- High R&D and certification costs.
- Intense market competition.
Emerging Opportunities in Vehicle Urea Tank
Emerging opportunities in the Vehicle Urea Tank sector lie in the development of smart urea tanks with enhanced IoT capabilities for remote monitoring and predictive maintenance. The expansion of SCR technology into emerging markets with nascent emission regulations presents a significant untapped market. Innovations in bio-based or recycled urea storage solutions cater to the growing demand for sustainable automotive components. Furthermore, the development of compact, highly efficient urea tanks for lighter commercial vehicles and passenger cars offers a new avenue for market growth as emission norms tighten globally.
Growth Accelerators in the Vehicle Urea Tank Industry
Long-term growth in the Vehicle Urea Tank industry is being significantly accelerated by several key factors. Firstly, continuous technological breakthroughs in material science are enabling the production of more resilient, lighter, and cost-effective urea tanks. Secondly, strategic partnerships between urea tank manufacturers, SCR system providers, and vehicle OEMs are streamlining product development and market penetration. Finally, proactive market expansion strategies targeting regions with impending emission regulations are opening up new revenue streams and solidifying market positions for leading players.
Key Players Shaping the Vehicle Urea Tank Market
- Cummins
- Elkhart Plastics
- Centro Incorporated
- Shaw Development
- Dongguan Zhengyang Electronic Mechanical (KUS Auto)
- Rochling Group
- Salzburger Aluminium
- Hitachi Zosen
- Elkamet
- SSI Technologies
- Solar Plastics
- KaiLong
Notable Milestones in Vehicle Urea Tank Sector
- 2021: Launch of advanced urea tanks with integrated heating and advanced sensor technology by major manufacturers, improving cold-weather performance.
- 2022: Increased M&A activity as companies sought to consolidate their market positions and expand product offerings in response to growing demand.
- 2023: Introduction of lightweight composite urea tanks, reducing vehicle weight and improving fuel efficiency.
- Early 2024: Focus on developing smart urea tanks with enhanced connectivity for fleet management systems.
In-Depth Vehicle Urea Tank Market Outlook
The future of the Vehicle Urea Tank market is exceptionally promising, driven by the enduring global imperative for cleaner air and more sustainable transportation. Growth accelerators, including material science innovations, strategic collaborations between industry leaders, and aggressive market expansion into developing economies, will continue to propel the industry forward. The increasing integration of urea tanks into the broader connected vehicle ecosystem presents significant opportunities for smart functionality and data-driven insights, further cementing the market's robust growth trajectory.
Vehicle Urea Tank Segmentation
-
1. Application
- 1.1. HD Off Road
- 1.2. HD On Road
-
2. Type
- 2.1. 19 Liters
- 2.2. 38 Liters
- 2.3. 57 Liters
- 2.4. 114 Liters
- 2.5. Others
Vehicle Urea Tank Segmentation By Geography
-
1. North America
- 1.1. United States
- 1.2. Canada
- 1.3. Mexico
-
2. South America
- 2.1. Brazil
- 2.2. Argentina
- 2.3. Rest of South America
-
3. Europe
- 3.1. United Kingdom
- 3.2. Germany
- 3.3. France
- 3.4. Italy
- 3.5. Spain
- 3.6. Russia
- 3.7. Benelux
- 3.8. Nordics
- 3.9. Rest of Europe
-
4. Middle East & Africa
- 4.1. Turkey
- 4.2. Israel
- 4.3. GCC
- 4.4. North Africa
- 4.5. South Africa
- 4.6. Rest of Middle East & Africa
-
5. Asia Pacific
- 5.1. China
- 5.2. India
- 5.3. Japan
- 5.4. South Korea
- 5.5. ASEAN
- 5.6. Oceania
- 5.7. Rest of Asia Pacific
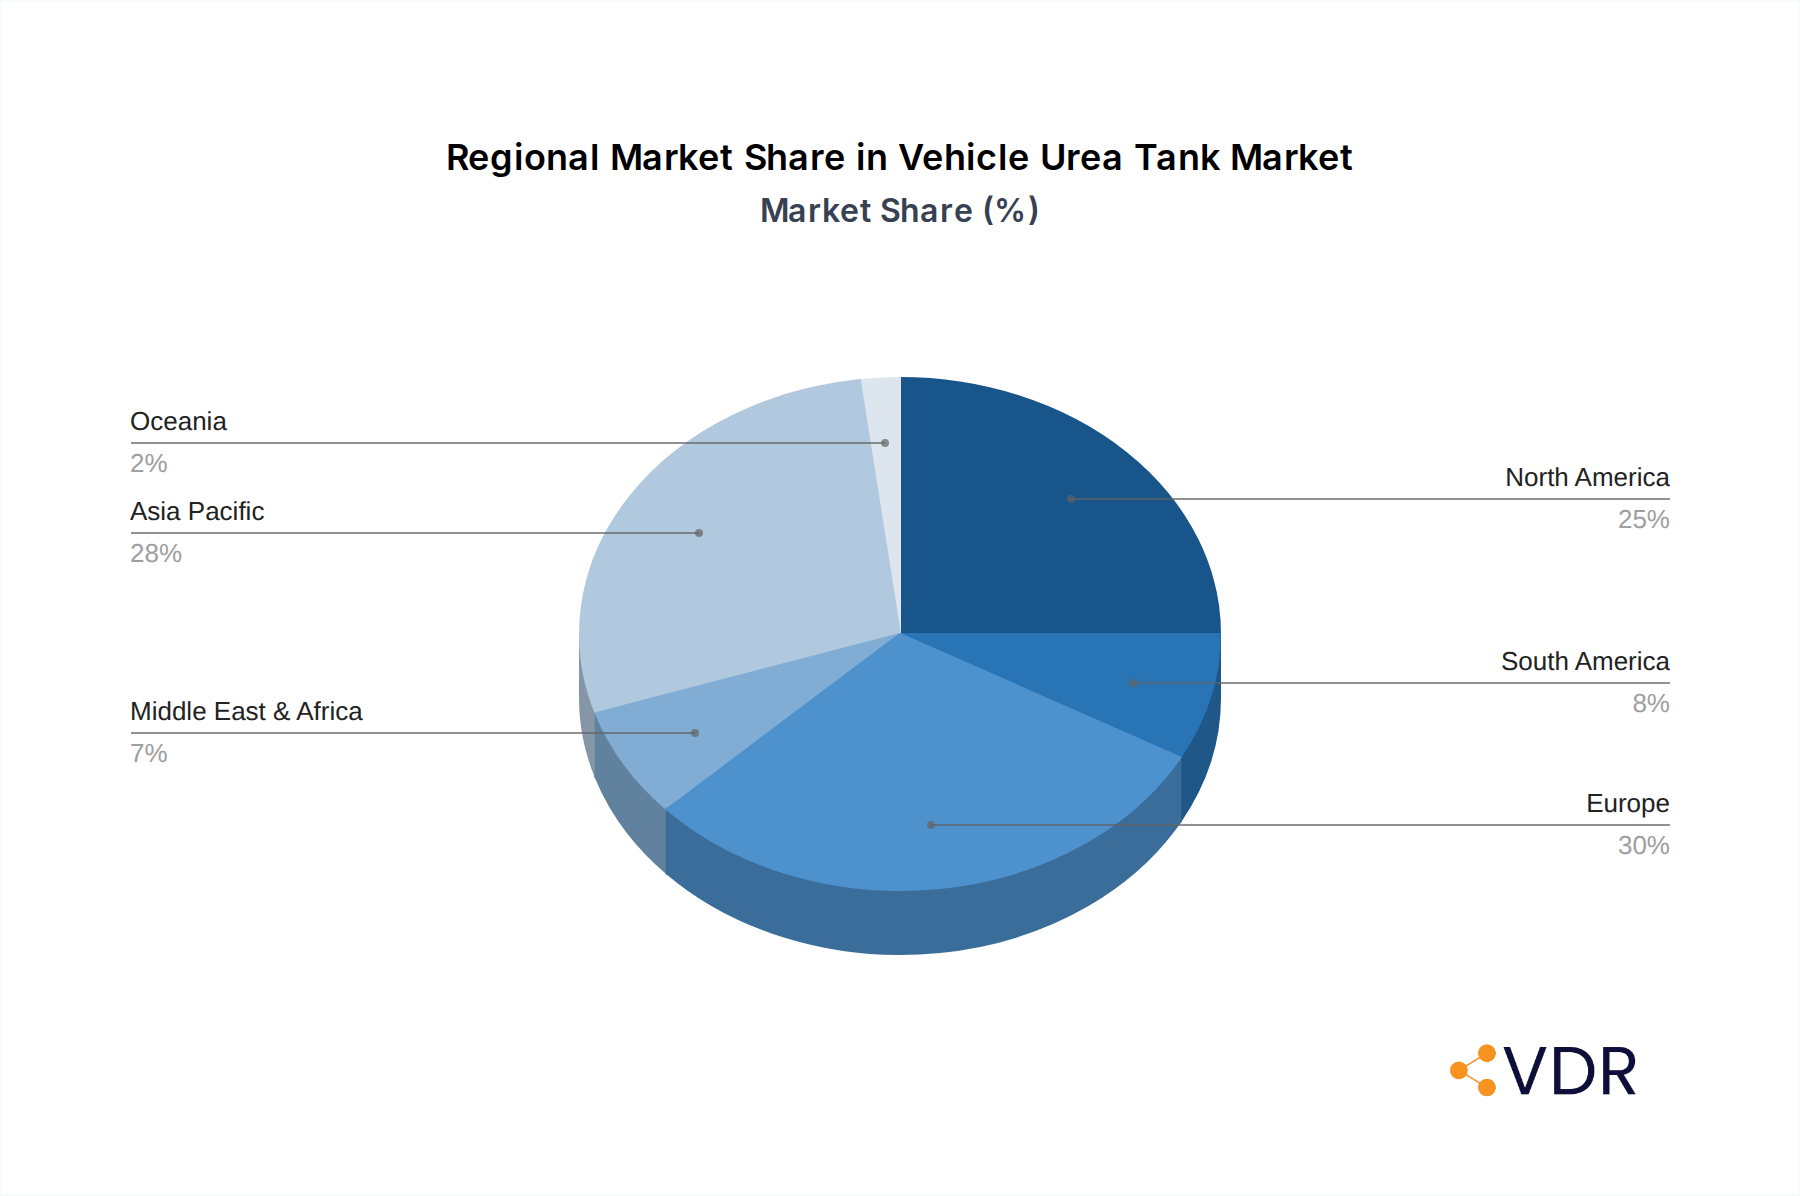
Vehicle Urea Tank Regional Market Share
Geographic Coverage of Vehicle Urea Tank
Vehicle Urea Tank REPORT HIGHLIGHTS
| Aspects | Details |
|---|---|
| Study Period | 2020-2034 |
| Base Year | 2025 |
| Estimated Year | 2026 |
| Forecast Period | 2026-2034 |
| Historical Period | 2020-2025 |
| Growth Rate | CAGR of 13.09% from 2020-2034 |
| Segmentation |
|
Table of Contents
- 1. Introduction
- 1.1. Research Scope
- 1.2. Market Segmentation
- 1.3. Research Methodology
- 1.4. Definitions and Assumptions
- 2. Executive Summary
- 2.1. Introduction
- 3. Market Dynamics
- 3.1. Introduction
- 3.2. Market Drivers
- 3.3. Market Restrains
- 3.4. Market Trends
- 4. Market Factor Analysis
- 4.1. Porters Five Forces
- 4.2. Supply/Value Chain
- 4.3. PESTEL analysis
- 4.4. Market Entropy
- 4.5. Patent/Trademark Analysis
- 5. Global Vehicle Urea Tank Analysis, Insights and Forecast, 2020-2032
- 5.1. Market Analysis, Insights and Forecast - by Application
- 5.1.1. HD Off Road
- 5.1.2. HD On Road
- 5.2. Market Analysis, Insights and Forecast - by Type
- 5.2.1. 19 Liters
- 5.2.2. 38 Liters
- 5.2.3. 57 Liters
- 5.2.4. 114 Liters
- 5.2.5. Others
- 5.3. Market Analysis, Insights and Forecast - by Region
- 5.3.1. North America
- 5.3.2. South America
- 5.3.3. Europe
- 5.3.4. Middle East & Africa
- 5.3.5. Asia Pacific
- 5.1. Market Analysis, Insights and Forecast - by Application
- 6. North America Vehicle Urea Tank Analysis, Insights and Forecast, 2020-2032
- 6.1. Market Analysis, Insights and Forecast - by Application
- 6.1.1. HD Off Road
- 6.1.2. HD On Road
- 6.2. Market Analysis, Insights and Forecast - by Type
- 6.2.1. 19 Liters
- 6.2.2. 38 Liters
- 6.2.3. 57 Liters
- 6.2.4. 114 Liters
- 6.2.5. Others
- 6.1. Market Analysis, Insights and Forecast - by Application
- 7. South America Vehicle Urea Tank Analysis, Insights and Forecast, 2020-2032
- 7.1. Market Analysis, Insights and Forecast - by Application
- 7.1.1. HD Off Road
- 7.1.2. HD On Road
- 7.2. Market Analysis, Insights and Forecast - by Type
- 7.2.1. 19 Liters
- 7.2.2. 38 Liters
- 7.2.3. 57 Liters
- 7.2.4. 114 Liters
- 7.2.5. Others
- 7.1. Market Analysis, Insights and Forecast - by Application
- 8. Europe Vehicle Urea Tank Analysis, Insights and Forecast, 2020-2032
- 8.1. Market Analysis, Insights and Forecast - by Application
- 8.1.1. HD Off Road
- 8.1.2. HD On Road
- 8.2. Market Analysis, Insights and Forecast - by Type
- 8.2.1. 19 Liters
- 8.2.2. 38 Liters
- 8.2.3. 57 Liters
- 8.2.4. 114 Liters
- 8.2.5. Others
- 8.1. Market Analysis, Insights and Forecast - by Application
- 9. Middle East & Africa Vehicle Urea Tank Analysis, Insights and Forecast, 2020-2032
- 9.1. Market Analysis, Insights and Forecast - by Application
- 9.1.1. HD Off Road
- 9.1.2. HD On Road
- 9.2. Market Analysis, Insights and Forecast - by Type
- 9.2.1. 19 Liters
- 9.2.2. 38 Liters
- 9.2.3. 57 Liters
- 9.2.4. 114 Liters
- 9.2.5. Others
- 9.1. Market Analysis, Insights and Forecast - by Application
- 10. Asia Pacific Vehicle Urea Tank Analysis, Insights and Forecast, 2020-2032
- 10.1. Market Analysis, Insights and Forecast - by Application
- 10.1.1. HD Off Road
- 10.1.2. HD On Road
- 10.2. Market Analysis, Insights and Forecast - by Type
- 10.2.1. 19 Liters
- 10.2.2. 38 Liters
- 10.2.3. 57 Liters
- 10.2.4. 114 Liters
- 10.2.5. Others
- 10.1. Market Analysis, Insights and Forecast - by Application
- 11. Competitive Analysis
- 11.1. Global Market Share Analysis 2025
- 11.2. Company Profiles
- 11.2.1 Cummins
- 11.2.1.1. Overview
- 11.2.1.2. Products
- 11.2.1.3. SWOT Analysis
- 11.2.1.4. Recent Developments
- 11.2.1.5. Financials (Based on Availability)
- 11.2.2 Elkhart Plastics
- 11.2.2.1. Overview
- 11.2.2.2. Products
- 11.2.2.3. SWOT Analysis
- 11.2.2.4. Recent Developments
- 11.2.2.5. Financials (Based on Availability)
- 11.2.3 Centro Incorporated
- 11.2.3.1. Overview
- 11.2.3.2. Products
- 11.2.3.3. SWOT Analysis
- 11.2.3.4. Recent Developments
- 11.2.3.5. Financials (Based on Availability)
- 11.2.4 Shaw Development
- 11.2.4.1. Overview
- 11.2.4.2. Products
- 11.2.4.3. SWOT Analysis
- 11.2.4.4. Recent Developments
- 11.2.4.5. Financials (Based on Availability)
- 11.2.5 Dongguan Zhengyang Electronic Mechanical (KUS Auto)
- 11.2.5.1. Overview
- 11.2.5.2. Products
- 11.2.5.3. SWOT Analysis
- 11.2.5.4. Recent Developments
- 11.2.5.5. Financials (Based on Availability)
- 11.2.6 Rochling Group
- 11.2.6.1. Overview
- 11.2.6.2. Products
- 11.2.6.3. SWOT Analysis
- 11.2.6.4. Recent Developments
- 11.2.6.5. Financials (Based on Availability)
- 11.2.7 Salzburger Aluminium
- 11.2.7.1. Overview
- 11.2.7.2. Products
- 11.2.7.3. SWOT Analysis
- 11.2.7.4. Recent Developments
- 11.2.7.5. Financials (Based on Availability)
- 11.2.8 Hitachi Zosen
- 11.2.8.1. Overview
- 11.2.8.2. Products
- 11.2.8.3. SWOT Analysis
- 11.2.8.4. Recent Developments
- 11.2.8.5. Financials (Based on Availability)
- 11.2.9 Elkamet
- 11.2.9.1. Overview
- 11.2.9.2. Products
- 11.2.9.3. SWOT Analysis
- 11.2.9.4. Recent Developments
- 11.2.9.5. Financials (Based on Availability)
- 11.2.10 SSI Technologies
- 11.2.10.1. Overview
- 11.2.10.2. Products
- 11.2.10.3. SWOT Analysis
- 11.2.10.4. Recent Developments
- 11.2.10.5. Financials (Based on Availability)
- 11.2.11 Solar Plastics
- 11.2.11.1. Overview
- 11.2.11.2. Products
- 11.2.11.3. SWOT Analysis
- 11.2.11.4. Recent Developments
- 11.2.11.5. Financials (Based on Availability)
- 11.2.12 KaiLong
- 11.2.12.1. Overview
- 11.2.12.2. Products
- 11.2.12.3. SWOT Analysis
- 11.2.12.4. Recent Developments
- 11.2.12.5. Financials (Based on Availability)
- 11.2.1 Cummins
List of Figures
- Figure 1: Global Vehicle Urea Tank Revenue Breakdown (billion, %) by Region 2025 & 2033
- Figure 2: North America Vehicle Urea Tank Revenue (billion), by Application 2025 & 2033
- Figure 3: North America Vehicle Urea Tank Revenue Share (%), by Application 2025 & 2033
- Figure 4: North America Vehicle Urea Tank Revenue (billion), by Type 2025 & 2033
- Figure 5: North America Vehicle Urea Tank Revenue Share (%), by Type 2025 & 2033
- Figure 6: North America Vehicle Urea Tank Revenue (billion), by Country 2025 & 2033
- Figure 7: North America Vehicle Urea Tank Revenue Share (%), by Country 2025 & 2033
- Figure 8: South America Vehicle Urea Tank Revenue (billion), by Application 2025 & 2033
- Figure 9: South America Vehicle Urea Tank Revenue Share (%), by Application 2025 & 2033
- Figure 10: South America Vehicle Urea Tank Revenue (billion), by Type 2025 & 2033
- Figure 11: South America Vehicle Urea Tank Revenue Share (%), by Type 2025 & 2033
- Figure 12: South America Vehicle Urea Tank Revenue (billion), by Country 2025 & 2033
- Figure 13: South America Vehicle Urea Tank Revenue Share (%), by Country 2025 & 2033
- Figure 14: Europe Vehicle Urea Tank Revenue (billion), by Application 2025 & 2033
- Figure 15: Europe Vehicle Urea Tank Revenue Share (%), by Application 2025 & 2033
- Figure 16: Europe Vehicle Urea Tank Revenue (billion), by Type 2025 & 2033
- Figure 17: Europe Vehicle Urea Tank Revenue Share (%), by Type 2025 & 2033
- Figure 18: Europe Vehicle Urea Tank Revenue (billion), by Country 2025 & 2033
- Figure 19: Europe Vehicle Urea Tank Revenue Share (%), by Country 2025 & 2033
- Figure 20: Middle East & Africa Vehicle Urea Tank Revenue (billion), by Application 2025 & 2033
- Figure 21: Middle East & Africa Vehicle Urea Tank Revenue Share (%), by Application 2025 & 2033
- Figure 22: Middle East & Africa Vehicle Urea Tank Revenue (billion), by Type 2025 & 2033
- Figure 23: Middle East & Africa Vehicle Urea Tank Revenue Share (%), by Type 2025 & 2033
- Figure 24: Middle East & Africa Vehicle Urea Tank Revenue (billion), by Country 2025 & 2033
- Figure 25: Middle East & Africa Vehicle Urea Tank Revenue Share (%), by Country 2025 & 2033
- Figure 26: Asia Pacific Vehicle Urea Tank Revenue (billion), by Application 2025 & 2033
- Figure 27: Asia Pacific Vehicle Urea Tank Revenue Share (%), by Application 2025 & 2033
- Figure 28: Asia Pacific Vehicle Urea Tank Revenue (billion), by Type 2025 & 2033
- Figure 29: Asia Pacific Vehicle Urea Tank Revenue Share (%), by Type 2025 & 2033
- Figure 30: Asia Pacific Vehicle Urea Tank Revenue (billion), by Country 2025 & 2033
- Figure 31: Asia Pacific Vehicle Urea Tank Revenue Share (%), by Country 2025 & 2033
List of Tables
- Table 1: Global Vehicle Urea Tank Revenue billion Forecast, by Application 2020 & 2033
- Table 2: Global Vehicle Urea Tank Revenue billion Forecast, by Type 2020 & 2033
- Table 3: Global Vehicle Urea Tank Revenue billion Forecast, by Region 2020 & 2033
- Table 4: Global Vehicle Urea Tank Revenue billion Forecast, by Application 2020 & 2033
- Table 5: Global Vehicle Urea Tank Revenue billion Forecast, by Type 2020 & 2033
- Table 6: Global Vehicle Urea Tank Revenue billion Forecast, by Country 2020 & 2033
- Table 7: United States Vehicle Urea Tank Revenue (billion) Forecast, by Application 2020 & 2033
- Table 8: Canada Vehicle Urea Tank Revenue (billion) Forecast, by Application 2020 & 2033
- Table 9: Mexico Vehicle Urea Tank Revenue (billion) Forecast, by Application 2020 & 2033
- Table 10: Global Vehicle Urea Tank Revenue billion Forecast, by Application 2020 & 2033
- Table 11: Global Vehicle Urea Tank Revenue billion Forecast, by Type 2020 & 2033
- Table 12: Global Vehicle Urea Tank Revenue billion Forecast, by Country 2020 & 2033
- Table 13: Brazil Vehicle Urea Tank Revenue (billion) Forecast, by Application 2020 & 2033
- Table 14: Argentina Vehicle Urea Tank Revenue (billion) Forecast, by Application 2020 & 2033
- Table 15: Rest of South America Vehicle Urea Tank Revenue (billion) Forecast, by Application 2020 & 2033
- Table 16: Global Vehicle Urea Tank Revenue billion Forecast, by Application 2020 & 2033
- Table 17: Global Vehicle Urea Tank Revenue billion Forecast, by Type 2020 & 2033
- Table 18: Global Vehicle Urea Tank Revenue billion Forecast, by Country 2020 & 2033
- Table 19: United Kingdom Vehicle Urea Tank Revenue (billion) Forecast, by Application 2020 & 2033
- Table 20: Germany Vehicle Urea Tank Revenue (billion) Forecast, by Application 2020 & 2033
- Table 21: France Vehicle Urea Tank Revenue (billion) Forecast, by Application 2020 & 2033
- Table 22: Italy Vehicle Urea Tank Revenue (billion) Forecast, by Application 2020 & 2033
- Table 23: Spain Vehicle Urea Tank Revenue (billion) Forecast, by Application 2020 & 2033
- Table 24: Russia Vehicle Urea Tank Revenue (billion) Forecast, by Application 2020 & 2033
- Table 25: Benelux Vehicle Urea Tank Revenue (billion) Forecast, by Application 2020 & 2033
- Table 26: Nordics Vehicle Urea Tank Revenue (billion) Forecast, by Application 2020 & 2033
- Table 27: Rest of Europe Vehicle Urea Tank Revenue (billion) Forecast, by Application 2020 & 2033
- Table 28: Global Vehicle Urea Tank Revenue billion Forecast, by Application 2020 & 2033
- Table 29: Global Vehicle Urea Tank Revenue billion Forecast, by Type 2020 & 2033
- Table 30: Global Vehicle Urea Tank Revenue billion Forecast, by Country 2020 & 2033
- Table 31: Turkey Vehicle Urea Tank Revenue (billion) Forecast, by Application 2020 & 2033
- Table 32: Israel Vehicle Urea Tank Revenue (billion) Forecast, by Application 2020 & 2033
- Table 33: GCC Vehicle Urea Tank Revenue (billion) Forecast, by Application 2020 & 2033
- Table 34: North Africa Vehicle Urea Tank Revenue (billion) Forecast, by Application 2020 & 2033
- Table 35: South Africa Vehicle Urea Tank Revenue (billion) Forecast, by Application 2020 & 2033
- Table 36: Rest of Middle East & Africa Vehicle Urea Tank Revenue (billion) Forecast, by Application 2020 & 2033
- Table 37: Global Vehicle Urea Tank Revenue billion Forecast, by Application 2020 & 2033
- Table 38: Global Vehicle Urea Tank Revenue billion Forecast, by Type 2020 & 2033
- Table 39: Global Vehicle Urea Tank Revenue billion Forecast, by Country 2020 & 2033
- Table 40: China Vehicle Urea Tank Revenue (billion) Forecast, by Application 2020 & 2033
- Table 41: India Vehicle Urea Tank Revenue (billion) Forecast, by Application 2020 & 2033
- Table 42: Japan Vehicle Urea Tank Revenue (billion) Forecast, by Application 2020 & 2033
- Table 43: South Korea Vehicle Urea Tank Revenue (billion) Forecast, by Application 2020 & 2033
- Table 44: ASEAN Vehicle Urea Tank Revenue (billion) Forecast, by Application 2020 & 2033
- Table 45: Oceania Vehicle Urea Tank Revenue (billion) Forecast, by Application 2020 & 2033
- Table 46: Rest of Asia Pacific Vehicle Urea Tank Revenue (billion) Forecast, by Application 2020 & 2033
Frequently Asked Questions
1. What is the projected Compound Annual Growth Rate (CAGR) of the Vehicle Urea Tank?
The projected CAGR is approximately 13.09%.
2. Which companies are prominent players in the Vehicle Urea Tank?
Key companies in the market include Cummins, Elkhart Plastics, Centro Incorporated, Shaw Development, Dongguan Zhengyang Electronic Mechanical (KUS Auto), Rochling Group, Salzburger Aluminium, Hitachi Zosen, Elkamet, SSI Technologies, Solar Plastics, KaiLong.
3. What are the main segments of the Vehicle Urea Tank?
The market segments include Application, Type.
4. Can you provide details about the market size?
The market size is estimated to be USD 11.57 billion as of 2022.
5. What are some drivers contributing to market growth?
N/A
6. What are the notable trends driving market growth?
N/A
7. Are there any restraints impacting market growth?
N/A
8. Can you provide examples of recent developments in the market?
N/A
9. What pricing options are available for accessing the report?
Pricing options include single-user, multi-user, and enterprise licenses priced at USD 2900.00, USD 4350.00, and USD 5800.00 respectively.
10. Is the market size provided in terms of value or volume?
The market size is provided in terms of value, measured in billion.
11. Are there any specific market keywords associated with the report?
Yes, the market keyword associated with the report is "Vehicle Urea Tank," which aids in identifying and referencing the specific market segment covered.
12. How do I determine which pricing option suits my needs best?
The pricing options vary based on user requirements and access needs. Individual users may opt for single-user licenses, while businesses requiring broader access may choose multi-user or enterprise licenses for cost-effective access to the report.
13. Are there any additional resources or data provided in the Vehicle Urea Tank report?
While the report offers comprehensive insights, it's advisable to review the specific contents or supplementary materials provided to ascertain if additional resources or data are available.
14. How can I stay updated on further developments or reports in the Vehicle Urea Tank?
To stay informed about further developments, trends, and reports in the Vehicle Urea Tank, consider subscribing to industry newsletters, following relevant companies and organizations, or regularly checking reputable industry news sources and publications.
Methodology
Step 1 - Identification of Relevant Samples Size from Population Database


Step 2 - Approaches for Defining Global Market Size (Value, Volume* & Price*)

Note*: In applicable scenarios
Step 3 - Data Sources
Primary Research
- Web Analytics
- Survey Reports
- Research Institute
- Latest Research Reports
- Opinion Leaders
Secondary Research
- Annual Reports
- White Paper
- Latest Press Release
- Industry Association
- Paid Database
- Investor Presentations

Step 4 - Data Triangulation
Involves using different sources of information in order to increase the validity of a study
These sources are likely to be stakeholders in a program - participants, other researchers, program staff, other community members, and so on.
Then we put all data in single framework & apply various statistical tools to find out the dynamic on the market.
During the analysis stage, feedback from the stakeholder groups would be compared to determine areas of agreement as well as areas of divergence

