

Key Insights
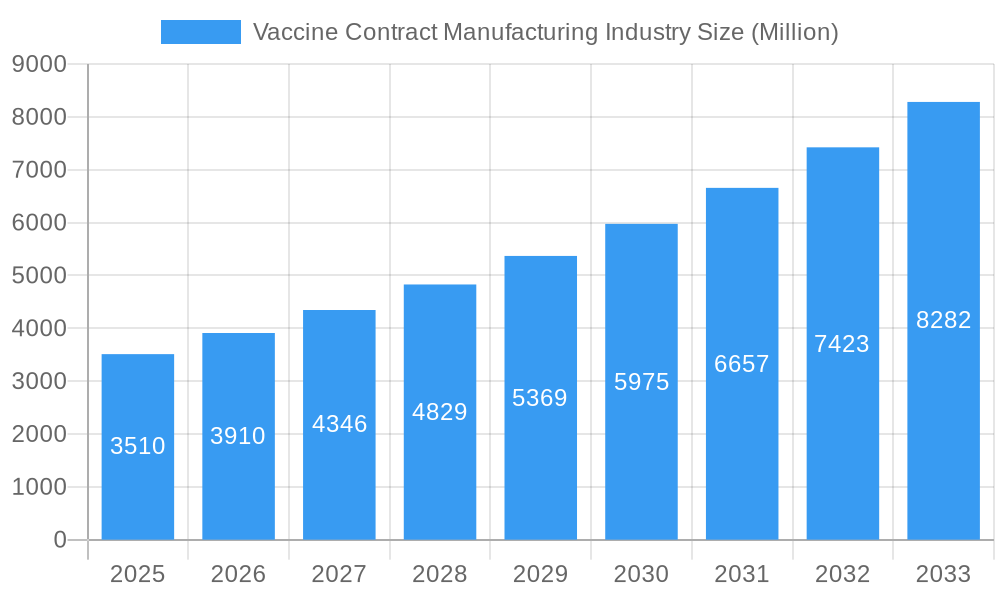
The global Vaccine Contract Manufacturing market is poised for substantial growth, projected to reach USD 3.51 Billion by 2025, with a robust Compound Annual Growth Rate (CAGR) of 11.18% expected throughout the forecast period of 2025-2033. This expansion is fueled by several key drivers including the increasing prevalence of infectious diseases, the growing demand for novel vaccine technologies, and a continuous need to enhance global vaccine production capacity. The dynamic landscape of vaccine development, encompassing advanced platforms like RNA vaccines alongside traditional inactivated and live-attenuated vaccines, necessitates specialized manufacturing expertise. Furthermore, the expanding scope of contract manufacturing to include all stages from upstream processes (like bacterial and mammalian expression systems) to downstream operations (including fill and finish, packaging, and rigorous analytical and QC studies) underscores the comprehensive support offered by Contract Development and Manufacturing Organizations (CDMOs). The market is also seeing a significant trend towards personalized medicine and the development of vaccines for rare diseases, further driving demand for flexible and specialized manufacturing solutions.
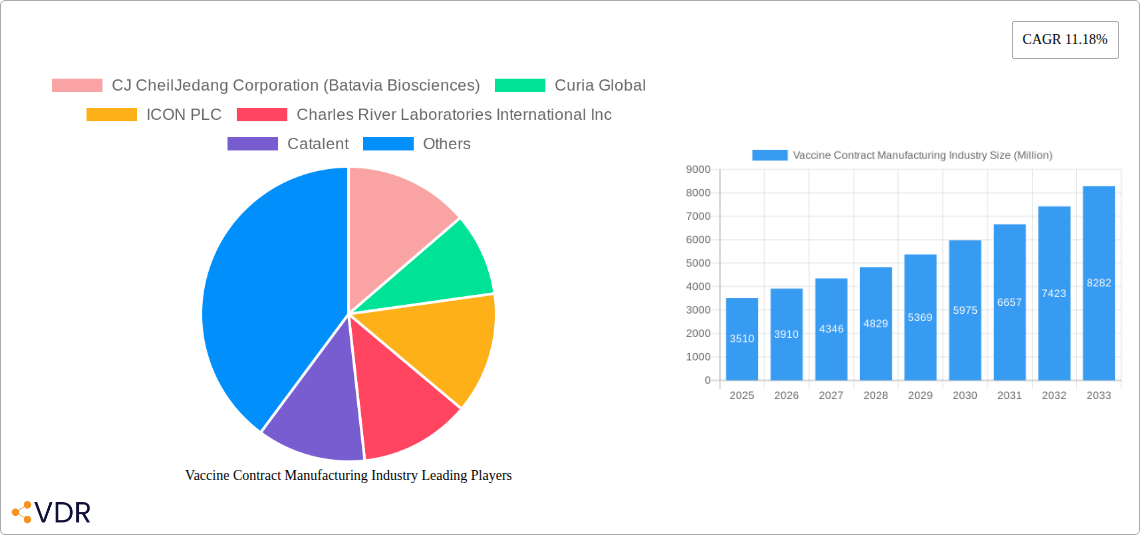
Vaccine Contract Manufacturing Industry Market Size (In Billion)
The market's impressive trajectory is further bolstered by the growing reliance of pharmaceutical and biotechnology companies on CDMOs to navigate complex regulatory pathways, scale production efficiently, and mitigate investment risks associated with in-house manufacturing. Key restraints, such as stringent regulatory hurdles and the high cost of specialized equipment and skilled labor, are being effectively addressed by the expertise and infrastructure of established CDMO players. The market's segmentation spans various vaccine types, upstream and downstream processes, diverse scales of operation from preclinical to commercial, and end-use applications in both human and veterinary health. Leading companies like Catalent, Lonza Group AG, and Charles River Laboratories International Inc. are actively investing in expanding their capacities and capabilities to cater to this burgeoning demand. Geographically, North America and Europe currently dominate the market, driven by strong research and development activities and established healthcare infrastructures, while the Asia Pacific region is emerging as a significant growth hub due to increasing investments and a growing pharmaceutical manufacturing base.
Vaccine Contract Manufacturing Industry Company Market Share
Vaccine Contract Manufacturing Industry Report: Strategic Growth, Market Dominance, and Future Outlook (2019-2033)
This comprehensive report offers an in-depth analysis of the global Vaccine Contract Manufacturing (CMO) industry, providing critical insights into market dynamics, growth trends, regional dominance, product landscape, key drivers, challenges, and emerging opportunities. With a study period spanning from 2019 to 2033, including a base year of 2025 and a forecast period from 2025 to 2033, this report is an indispensable resource for stakeholders seeking to understand and capitalize on the rapidly evolving vaccine manufacturing ecosystem. We leverage high-traffic keywords to ensure maximum search engine visibility and present all values in million units for clarity.
Vaccine Contract Manufacturing Industry Market Dynamics & Structure
The Vaccine Contract Manufacturing (CMO) industry is characterized by a dynamic interplay of market concentration, technological innovation, stringent regulatory frameworks, and evolving end-user demographics. While the market exhibits a degree of concentration among established players, the increasing demand for diverse vaccine types and specialized manufacturing capabilities fosters opportunities for niche CMOs. Technological innovation remains a primary driver, with significant advancements in upstream and downstream processing, particularly in areas like RNA vaccine development and continuous manufacturing. Regulatory bodies worldwide continuously update guidelines, influencing manufacturing standards, quality control, and market access, thereby shaping the competitive landscape. The market is also influenced by the presence of competitive product substitutes and the growing trend of outsourcing by pharmaceutical and biotechnology companies. Mergers and acquisitions (M&A) are a significant factor in market consolidation and expansion, enabling companies to broaden their service offerings and geographic reach.
- Market Concentration: Moderate to high concentration with key players dominating a significant share.
- Technological Innovation: Driven by advancements in bioprocessing, cell culture, and gene therapy manufacturing.
- Regulatory Frameworks: Stringent Good Manufacturing Practices (GMP) and evolving global health regulations.
- Competitive Product Substitutes: Emergence of novel therapeutic modalities influencing vaccine development pipelines.
- End-User Demographics: Growing demand from human and veterinary sectors, with an increasing focus on preventive healthcare.
- M&A Trends: Strategic acquisitions and collaborations to enhance capabilities and market presence.
Vaccine Contract Manufacturing Industry Growth Trends & Insights
The global Vaccine Contract Manufacturing (CMO) market is poised for substantial growth, projected to expand from an estimated USD xx million in 2025 to USD xx million by 2033, exhibiting a Compound Annual Growth Rate (CAGR) of xx% during the forecast period. This robust growth is fueled by a confluence of factors, including the escalating global burden of infectious diseases, increasing R&D investments in novel vaccine technologies, and the growing trend of outsourcing manufacturing operations by pharmaceutical and biotechnology firms. The COVID-19 pandemic significantly accelerated the adoption of CMOs, highlighting their critical role in rapid vaccine production and supply chain resilience.
Market penetration is expected to deepen across all scales of operation, from preclinical development to large-scale commercial manufacturing. The adoption rates for advanced manufacturing technologies, such as single-use systems and continuous bioprocessing, are on an upward trajectory, promising enhanced efficiency, scalability, and cost-effectiveness. Consumer behavior shifts, particularly a heightened public awareness and demand for accessible and effective vaccines, are also contributing to market expansion. Furthermore, the ongoing scientific breakthroughs in areas like mRNA, viral vector, and subunit vaccines are creating new avenues for CMOs to offer specialized development and manufacturing services. This evolving landscape necessitates continuous adaptation and investment in cutting-edge technologies to maintain a competitive edge.
Dominant Regions, Countries, or Segments in Vaccine Contract Manufacturing Industry
North America, particularly the United States, is anticipated to be a dominant region in the Vaccine Contract Manufacturing (CMO) industry. This dominance is underpinned by a robust pharmaceutical and biotechnology ecosystem, significant government funding for vaccine research and development, and a high concentration of leading vaccine developers and manufacturers. The region's well-established regulatory infrastructure, coupled with a proactive approach to public health initiatives, further bolsters its leadership.
Within the segments, Commercial Scale operations are expected to witness the highest market share and growth. This is attributed to the substantial demand for mass production of established vaccines and the ongoing development of new vaccines requiring large-scale manufacturing capabilities.
- Vaccine Type: RNA Vaccines are emerging as a high-growth segment due to their rapid development potential and efficacy demonstrated during the COVID-19 pandemic.
- Process: Downstream processing, particularly Fill and Finish, is critical and commands a significant market share due to its crucial role in drug product formulation and final packaging.
- Scale of Operations: Commercial Scale manufacturing is the largest and fastest-growing segment, driven by the need for mass production of approved vaccines.
- End Use: Human Use applications represent the predominant segment, reflecting the global focus on public health and disease prevention in human populations.
Key drivers contributing to this dominance include favorable economic policies, advanced healthcare infrastructure, and a strong pipeline of innovative vaccine candidates. The presence of major pharmaceutical companies and academic research institutions further fuels demand for contract manufacturing services in North America.
Vaccine Contract Manufacturing Industry Product Landscape
The Vaccine Contract Manufacturing (CMO) industry's product landscape is characterized by a broad spectrum of vaccine types, each with unique manufacturing requirements and applications. From traditional Inactivated Vaccines and Live-attenuated Vaccines to cutting-edge RNA Vaccines and Subunit Vaccines, CMOs offer specialized expertise across the entire development and production continuum. Innovations in upstream processes, such as Mammalian Expression Systems and Bacterial Expression Systems, coupled with advanced downstream capabilities like Analytical and QC Studies and Fill and Finish, enable the efficient and high-quality production of diverse vaccine formulations. The performance metrics are increasingly focused on yield optimization, purity, stability, and cost-effectiveness, directly impacting the accessibility and affordability of vaccines globally.
Key Drivers, Barriers & Challenges in Vaccine Contract Manufacturing Industry
The Vaccine Contract Manufacturing (CMO) industry is propelled by several key drivers including the escalating global demand for vaccines driven by emerging infectious diseases and routine immunization programs, significant investments in R&D for novel vaccine technologies, and the increasing trend of outsourcing by pharmaceutical companies seeking to leverage specialized expertise and manufacturing capacity. Government initiatives supporting vaccine development and manufacturing further accelerate market growth. Technological advancements in bioprocessing, including single-use technologies and continuous manufacturing, also act as significant growth accelerators.
Conversely, the industry faces considerable barriers and challenges. Stringent regulatory hurdles and complex approval processes can lead to extended development timelines and increased costs. Supply chain disruptions, particularly for critical raw materials and specialized equipment, pose a constant threat to manufacturing continuity. Intense competition among CMOs can lead to pricing pressures. Furthermore, the high capital investment required for advanced manufacturing facilities and the need for specialized skilled labor present significant challenges. Ensuring product quality and integrity throughout the complex manufacturing process remains a paramount concern, with any lapse potentially leading to severe consequences.
Emerging Opportunities in Vaccine Contract Manufacturing Industry
Emerging opportunities in the Vaccine Contract Manufacturing (CMO) industry are abundant, driven by advancements in biotechnology and evolving global health needs. The rapid development and manufacturing of vaccines for rare diseases and neglected tropical diseases present a significant untapped market. Furthermore, the growing interest in personalized vaccines and cancer immunotherapies opens new avenues for CMOs offering specialized gene and cell therapy manufacturing capabilities. The increasing focus on pandemic preparedness and the establishment of regional vaccine manufacturing hubs also create substantial growth prospects. Contract manufacturers that can offer end-to-end services, from early-stage process development to commercial fill and finish, are particularly well-positioned to capitalize on these evolving consumer preferences and technological shifts.
Growth Accelerators in the Vaccine Contract Manufacturing Industry Industry
Several critical growth accelerators are shaping the future of the Vaccine Contract Manufacturing (CMO) industry. Technological breakthroughs in areas such as continuous bioprocessing, advanced cell line development, and mRNA encapsulation technologies are enabling more efficient, scalable, and cost-effective vaccine production. Strategic partnerships and collaborations between CMOs, pharmaceutical companies, and academic institutions are fostering innovation and accelerating the translation of research into commercially viable products. Furthermore, market expansion into emerging economies with growing healthcare needs and increasing governmental support for local manufacturing presents significant long-term growth opportunities. Investments in capacity expansion and adoption of advanced automation and digital technologies are also crucial for maintaining a competitive edge.
Key Players Shaping the Vaccine Contract Manufacturing Industry Market
- CJ CheilJedang Corporation (Batavia Biosciences)
- Curia Global
- ICON PLC
- Charles River Laboratories International Inc
- Catalent
- IDT Biologika GmbH
- Lonza Group AG
- Gedeon Richter (Richter-Helm BioLogics)
- Ajinomoto Bio-Pharma Services
- Recipharm AB
- Emergent BioSolutions Inc
- Fujifilm Holdings Corporation
Notable Milestones in Vaccine Contract Manufacturing Industry Sector
- August 2022: Moderna inked an agreement with the Canadian government to construct a messenger RNA vaccine manufacturing factory in an undetermined location in Canada. This partnership aims to provide Canadians with domestically produced mRNA vaccines against respiratory viruses such as SARS-CoV-2, influenza, and respiratory syncytial virus, significantly enhancing national vaccine production capabilities.
- June 2022: Merck and Agilent Technologies collaborated to advance process analytical technologies for downstream processing, addressing critical gaps and improving the efficiency and reliability of vaccine manufacturing workflows. This collaboration is expected to drive innovation in process control and quality assurance.
In-Depth Vaccine Contract Manufacturing Industry Market Outlook
The Vaccine Contract Manufacturing (CMO) industry is on a robust growth trajectory, driven by sustained demand for vaccines, continuous technological advancements, and strategic global investments. The market outlook indicates a significant expansion, fueled by the increasing need for diverse vaccine types, from established inactivated and live-attenuated vaccines to rapidly developing RNA and subunit platforms. Opportunities lie in addressing unmet medical needs, expanding into emerging markets, and leveraging innovations in bioprocessing. Strategic partnerships and capacity expansions will be crucial for CMOs to maintain competitiveness and contribute to global health security. The industry is poised for continued innovation and substantial market growth in the coming years.
Vaccine Contract Manufacturing Industry Segmentation
-
1. Vaccine Type
- 1.1. Inactivated Vaccines
- 1.2. Live-attenuated Vaccines
- 1.3. RNA Vaccines
- 1.4. Subunit Vaccines
- 1.5. Toxoid-based Vaccines
-
2. Process
-
2.1. Downstream
- 2.1.1. Analytical and QC Studies
- 2.1.2. Fill and Finish
- 2.1.3. Packaging
- 2.1.4. Other Downstream Processes
-
2.2. Upstream
- 2.2.1. Bacterial Expression Systems
- 2.2.2. Baculovirus/Insect Expression Systems
- 2.2.3. Mammalian Expression Systems
- 2.2.4. Yeast Expression Systems
- 2.2.5. Other Upstream Processes
-
2.1. Downstream
-
3. Scale of Operations
- 3.1. Preclinical
- 3.2. Clinical
- 3.3. Commercial
-
4. End Use
- 4.1. Human Use
- 4.2. Veterinary
Vaccine Contract Manufacturing Industry Segmentation By Geography
-
1. North America
- 1.1. United States
- 1.2. Canada
- 1.3. Mexico
-
2. Europe
- 2.1. Germany
- 2.2. United Kingdom
- 2.3. France
- 2.4. Italy
- 2.5. Spain
- 2.6. Rest of Europe
-
3. Asia Pacific
- 3.1. China
- 3.2. Japan
- 3.3. India
- 3.4. Australia
- 3.5. South Korea
- 3.6. Rest of Asia Pacific
-
4. Middle East and Africa
- 4.1. GCC
- 4.2. South Africa
- 4.3. Rest of Middle East and Africa
-
5. South America
- 5.1. Brazil
- 5.2. Argentina
- 5.3. Rest of South America
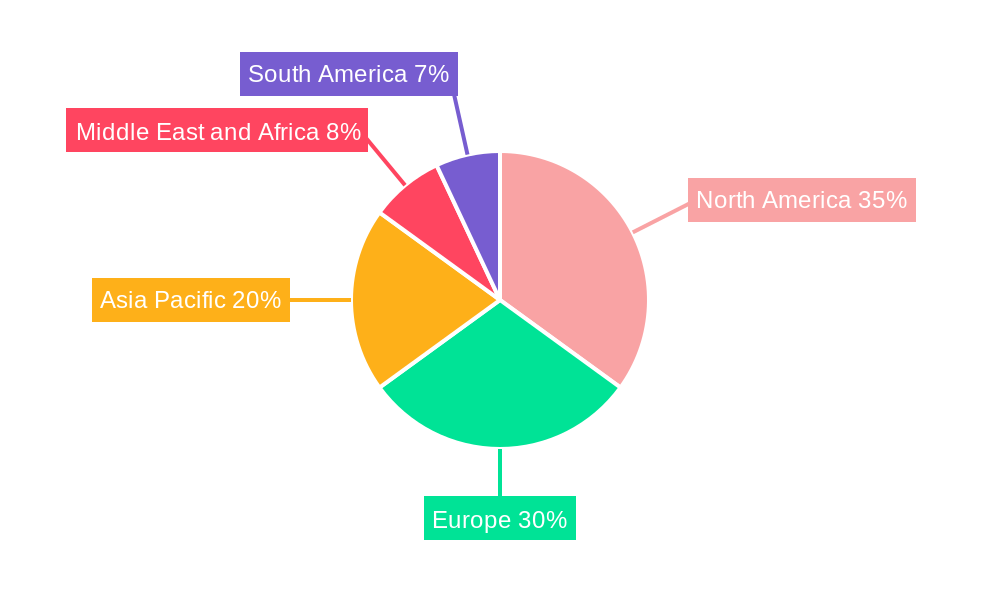
Vaccine Contract Manufacturing Industry Regional Market Share
Geographic Coverage of Vaccine Contract Manufacturing Industry
Vaccine Contract Manufacturing Industry REPORT HIGHLIGHTS
| Aspects | Details |
|---|---|
| Study Period | 2020-2034 |
| Base Year | 2025 |
| Estimated Year | 2026 |
| Forecast Period | 2026-2034 |
| Historical Period | 2020-2025 |
| Growth Rate | CAGR of 11.18% from 2020-2034 |
| Segmentation |
|
Table of Contents
- 1. Introduction
- 1.1. Research Scope
- 1.2. Market Segmentation
- 1.3. Research Objective
- 1.4. Definitions and Assumptions
- 2. Executive Summary
- 2.1. Market Snapshot
- 3. Market Dynamics
- 3.1. Market Drivers
- 3.2. Market Restrains
- 3.3. Market Trends
- 3.4. Market Opportunities
- 4. Market Factor Analysis
- 4.1. Porters Five Forces
- 4.1.1. Bargaining Power of Suppliers
- 4.1.2. Bargaining Power of Buyers
- 4.1.3. Threat of New Entrants
- 4.1.4. Threat of Substitutes
- 4.1.5. Competitive Rivalry
- 4.2. PESTEL analysis
- 4.3. BCG Analysis
- 4.3.1. Stars (High Growth, High Market Share)
- 4.3.2. Cash Cows (Low Growth, High Market Share)
- 4.3.3. Question Mark (High Growth, Low Market Share)
- 4.3.4. Dogs (Low Growth, Low Market Share)
- 4.4. Ansoff Matrix Analysis
- 4.5. Supply Chain Analysis
- 4.6. Regulatory Landscape
- 4.7. Current Market Potential and Opportunity Assessment (TAM–SAM–SOM Framework)
- 4.8. VDR Analyst Note
- 4.1. Porters Five Forces
- 5. Market Analysis, Insights and Forecast 2021-2033
- 5.1. Market Analysis, Insights and Forecast - by Vaccine Type
- 5.1.1. Inactivated Vaccines
- 5.1.2. Live-attenuated Vaccines
- 5.1.3. RNA Vaccines
- 5.1.4. Subunit Vaccines
- 5.1.5. Toxoid-based Vaccines
- 5.2. Market Analysis, Insights and Forecast - by Process
- 5.2.1. Downstream
- 5.2.1.1. Analytical and QC Studies
- 5.2.1.2. Fill and Finish
- 5.2.1.3. Packaging
- 5.2.1.4. Other Downstream Processes
- 5.2.2. Upstream
- 5.2.2.1. Bacterial Expression Systems
- 5.2.2.2. Baculovirus/Insect Expression Systems
- 5.2.2.3. Mammalian Expression Systems
- 5.2.2.4. Yeast Expression Systems
- 5.2.2.5. Other Upstream Processes
- 5.2.1. Downstream
- 5.3. Market Analysis, Insights and Forecast - by Scale of Operations
- 5.3.1. Preclinical
- 5.3.2. Clinical
- 5.3.3. Commercial
- 5.4. Market Analysis, Insights and Forecast - by End Use
- 5.4.1. Human Use
- 5.4.2. Veterinary
- 5.5. Market Analysis, Insights and Forecast - by Region
- 5.5.1. North America
- 5.5.2. Europe
- 5.5.3. Asia Pacific
- 5.5.4. Middle East and Africa
- 5.5.5. South America
- 5.1. Market Analysis, Insights and Forecast - by Vaccine Type
- 6. Global Vaccine Contract Manufacturing Industry Analysis, Insights and Forecast, 2021-2033
- 6.1. Market Analysis, Insights and Forecast - by Vaccine Type
- 6.1.1. Inactivated Vaccines
- 6.1.2. Live-attenuated Vaccines
- 6.1.3. RNA Vaccines
- 6.1.4. Subunit Vaccines
- 6.1.5. Toxoid-based Vaccines
- 6.2. Market Analysis, Insights and Forecast - by Process
- 6.2.1. Downstream
- 6.2.1.1. Analytical and QC Studies
- 6.2.1.2. Fill and Finish
- 6.2.1.3. Packaging
- 6.2.1.4. Other Downstream Processes
- 6.2.2. Upstream
- 6.2.2.1. Bacterial Expression Systems
- 6.2.2.2. Baculovirus/Insect Expression Systems
- 6.2.2.3. Mammalian Expression Systems
- 6.2.2.4. Yeast Expression Systems
- 6.2.2.5. Other Upstream Processes
- 6.2.1. Downstream
- 6.3. Market Analysis, Insights and Forecast - by Scale of Operations
- 6.3.1. Preclinical
- 6.3.2. Clinical
- 6.3.3. Commercial
- 6.4. Market Analysis, Insights and Forecast - by End Use
- 6.4.1. Human Use
- 6.4.2. Veterinary
- 6.1. Market Analysis, Insights and Forecast - by Vaccine Type
- 7. North America Vaccine Contract Manufacturing Industry Analysis, Insights and Forecast, 2021-2033
- 7.1. Market Analysis, Insights and Forecast - by Vaccine Type
- 7.1.1. Inactivated Vaccines
- 7.1.2. Live-attenuated Vaccines
- 7.1.3. RNA Vaccines
- 7.1.4. Subunit Vaccines
- 7.1.5. Toxoid-based Vaccines
- 7.2. Market Analysis, Insights and Forecast - by Process
- 7.2.1. Downstream
- 7.2.1.1. Analytical and QC Studies
- 7.2.1.2. Fill and Finish
- 7.2.1.3. Packaging
- 7.2.1.4. Other Downstream Processes
- 7.2.2. Upstream
- 7.2.2.1. Bacterial Expression Systems
- 7.2.2.2. Baculovirus/Insect Expression Systems
- 7.2.2.3. Mammalian Expression Systems
- 7.2.2.4. Yeast Expression Systems
- 7.2.2.5. Other Upstream Processes
- 7.2.1. Downstream
- 7.3. Market Analysis, Insights and Forecast - by Scale of Operations
- 7.3.1. Preclinical
- 7.3.2. Clinical
- 7.3.3. Commercial
- 7.4. Market Analysis, Insights and Forecast - by End Use
- 7.4.1. Human Use
- 7.4.2. Veterinary
- 7.1. Market Analysis, Insights and Forecast - by Vaccine Type
- 8. Europe Vaccine Contract Manufacturing Industry Analysis, Insights and Forecast, 2021-2033
- 8.1. Market Analysis, Insights and Forecast - by Vaccine Type
- 8.1.1. Inactivated Vaccines
- 8.1.2. Live-attenuated Vaccines
- 8.1.3. RNA Vaccines
- 8.1.4. Subunit Vaccines
- 8.1.5. Toxoid-based Vaccines
- 8.2. Market Analysis, Insights and Forecast - by Process
- 8.2.1. Downstream
- 8.2.1.1. Analytical and QC Studies
- 8.2.1.2. Fill and Finish
- 8.2.1.3. Packaging
- 8.2.1.4. Other Downstream Processes
- 8.2.2. Upstream
- 8.2.2.1. Bacterial Expression Systems
- 8.2.2.2. Baculovirus/Insect Expression Systems
- 8.2.2.3. Mammalian Expression Systems
- 8.2.2.4. Yeast Expression Systems
- 8.2.2.5. Other Upstream Processes
- 8.2.1. Downstream
- 8.3. Market Analysis, Insights and Forecast - by Scale of Operations
- 8.3.1. Preclinical
- 8.3.2. Clinical
- 8.3.3. Commercial
- 8.4. Market Analysis, Insights and Forecast - by End Use
- 8.4.1. Human Use
- 8.4.2. Veterinary
- 8.1. Market Analysis, Insights and Forecast - by Vaccine Type
- 9. Asia Pacific Vaccine Contract Manufacturing Industry Analysis, Insights and Forecast, 2021-2033
- 9.1. Market Analysis, Insights and Forecast - by Vaccine Type
- 9.1.1. Inactivated Vaccines
- 9.1.2. Live-attenuated Vaccines
- 9.1.3. RNA Vaccines
- 9.1.4. Subunit Vaccines
- 9.1.5. Toxoid-based Vaccines
- 9.2. Market Analysis, Insights and Forecast - by Process
- 9.2.1. Downstream
- 9.2.1.1. Analytical and QC Studies
- 9.2.1.2. Fill and Finish
- 9.2.1.3. Packaging
- 9.2.1.4. Other Downstream Processes
- 9.2.2. Upstream
- 9.2.2.1. Bacterial Expression Systems
- 9.2.2.2. Baculovirus/Insect Expression Systems
- 9.2.2.3. Mammalian Expression Systems
- 9.2.2.4. Yeast Expression Systems
- 9.2.2.5. Other Upstream Processes
- 9.2.1. Downstream
- 9.3. Market Analysis, Insights and Forecast - by Scale of Operations
- 9.3.1. Preclinical
- 9.3.2. Clinical
- 9.3.3. Commercial
- 9.4. Market Analysis, Insights and Forecast - by End Use
- 9.4.1. Human Use
- 9.4.2. Veterinary
- 9.1. Market Analysis, Insights and Forecast - by Vaccine Type
- 10. Middle East and Africa Vaccine Contract Manufacturing Industry Analysis, Insights and Forecast, 2021-2033
- 10.1. Market Analysis, Insights and Forecast - by Vaccine Type
- 10.1.1. Inactivated Vaccines
- 10.1.2. Live-attenuated Vaccines
- 10.1.3. RNA Vaccines
- 10.1.4. Subunit Vaccines
- 10.1.5. Toxoid-based Vaccines
- 10.2. Market Analysis, Insights and Forecast - by Process
- 10.2.1. Downstream
- 10.2.1.1. Analytical and QC Studies
- 10.2.1.2. Fill and Finish
- 10.2.1.3. Packaging
- 10.2.1.4. Other Downstream Processes
- 10.2.2. Upstream
- 10.2.2.1. Bacterial Expression Systems
- 10.2.2.2. Baculovirus/Insect Expression Systems
- 10.2.2.3. Mammalian Expression Systems
- 10.2.2.4. Yeast Expression Systems
- 10.2.2.5. Other Upstream Processes
- 10.2.1. Downstream
- 10.3. Market Analysis, Insights and Forecast - by Scale of Operations
- 10.3.1. Preclinical
- 10.3.2. Clinical
- 10.3.3. Commercial
- 10.4. Market Analysis, Insights and Forecast - by End Use
- 10.4.1. Human Use
- 10.4.2. Veterinary
- 10.1. Market Analysis, Insights and Forecast - by Vaccine Type
- 11. South America Vaccine Contract Manufacturing Industry Analysis, Insights and Forecast, 2021-2033
- 11.1. Market Analysis, Insights and Forecast - by Vaccine Type
- 11.1.1. Inactivated Vaccines
- 11.1.2. Live-attenuated Vaccines
- 11.1.3. RNA Vaccines
- 11.1.4. Subunit Vaccines
- 11.1.5. Toxoid-based Vaccines
- 11.2. Market Analysis, Insights and Forecast - by Process
- 11.2.1. Downstream
- 11.2.1.1. Analytical and QC Studies
- 11.2.1.2. Fill and Finish
- 11.2.1.3. Packaging
- 11.2.1.4. Other Downstream Processes
- 11.2.2. Upstream
- 11.2.2.1. Bacterial Expression Systems
- 11.2.2.2. Baculovirus/Insect Expression Systems
- 11.2.2.3. Mammalian Expression Systems
- 11.2.2.4. Yeast Expression Systems
- 11.2.2.5. Other Upstream Processes
- 11.2.1. Downstream
- 11.3. Market Analysis, Insights and Forecast - by Scale of Operations
- 11.3.1. Preclinical
- 11.3.2. Clinical
- 11.3.3. Commercial
- 11.4. Market Analysis, Insights and Forecast - by End Use
- 11.4.1. Human Use
- 11.4.2. Veterinary
- 11.1. Market Analysis, Insights and Forecast - by Vaccine Type
- 12. Competitive Analysis
- 12.1. Company Profiles
- 12.1.1 CJ CheilJedang Corporation (Batavia Biosciences)
- 12.1.1.1. Company Overview
- 12.1.1.2. Products
- 12.1.1.3. Company Financials
- 12.1.1.4. SWOT Analysis
- 12.1.2 Curia Global
- 12.1.2.1. Company Overview
- 12.1.2.2. Products
- 12.1.2.3. Company Financials
- 12.1.2.4. SWOT Analysis
- 12.1.3 ICON PLC
- 12.1.3.1. Company Overview
- 12.1.3.2. Products
- 12.1.3.3. Company Financials
- 12.1.3.4. SWOT Analysis
- 12.1.4 Charles River Laboratories International Inc
- 12.1.4.1. Company Overview
- 12.1.4.2. Products
- 12.1.4.3. Company Financials
- 12.1.4.4. SWOT Analysis
- 12.1.5 Catalent
- 12.1.5.1. Company Overview
- 12.1.5.2. Products
- 12.1.5.3. Company Financials
- 12.1.5.4. SWOT Analysis
- 12.1.6 IDT Biologika GmbH
- 12.1.6.1. Company Overview
- 12.1.6.2. Products
- 12.1.6.3. Company Financials
- 12.1.6.4. SWOT Analysis
- 12.1.7 Lonza Group AG
- 12.1.7.1. Company Overview
- 12.1.7.2. Products
- 12.1.7.3. Company Financials
- 12.1.7.4. SWOT Analysis
- 12.1.8 Gedeon Richter (Richter-Helm BioLogics)
- 12.1.8.1. Company Overview
- 12.1.8.2. Products
- 12.1.8.3. Company Financials
- 12.1.8.4. SWOT Analysis
- 12.1.9 Ajinomoto Bio-Pharma Services
- 12.1.9.1. Company Overview
- 12.1.9.2. Products
- 12.1.9.3. Company Financials
- 12.1.9.4. SWOT Analysis
- 12.1.10 Recipharm AB
- 12.1.10.1. Company Overview
- 12.1.10.2. Products
- 12.1.10.3. Company Financials
- 12.1.10.4. SWOT Analysis
- 12.1.11 Emergent BioSolutions Inc
- 12.1.11.1. Company Overview
- 12.1.11.2. Products
- 12.1.11.3. Company Financials
- 12.1.11.4. SWOT Analysis
- 12.1.12 Fujifilm Holdings Corporation
- 12.1.12.1. Company Overview
- 12.1.12.2. Products
- 12.1.12.3. Company Financials
- 12.1.12.4. SWOT Analysis
- 12.1.1 CJ CheilJedang Corporation (Batavia Biosciences)
- 12.2. Market Entropy
- 12.2.1 Company's Key Areas Served
- 12.2.2 Recent Developments
- 12.3. Company Market Share Analysis 2025
- 12.3.1 Top 5 Companies Market Share Analysis
- 12.3.2 Top 3 Companies Market Share Analysis
- 12.4. List of Potential Customers
- 13. Research Methodology
List of Figures
- Figure 1: Global Vaccine Contract Manufacturing Industry Revenue Breakdown (Million, %) by Region 2025 & 2033
- Figure 2: Global Vaccine Contract Manufacturing Industry Volume Breakdown (K Unit, %) by Region 2025 & 2033
- Figure 3: North America Vaccine Contract Manufacturing Industry Revenue (Million), by Vaccine Type 2025 & 2033
- Figure 4: North America Vaccine Contract Manufacturing Industry Volume (K Unit), by Vaccine Type 2025 & 2033
- Figure 5: North America Vaccine Contract Manufacturing Industry Revenue Share (%), by Vaccine Type 2025 & 2033
- Figure 6: North America Vaccine Contract Manufacturing Industry Volume Share (%), by Vaccine Type 2025 & 2033
- Figure 7: North America Vaccine Contract Manufacturing Industry Revenue (Million), by Process 2025 & 2033
- Figure 8: North America Vaccine Contract Manufacturing Industry Volume (K Unit), by Process 2025 & 2033
- Figure 9: North America Vaccine Contract Manufacturing Industry Revenue Share (%), by Process 2025 & 2033
- Figure 10: North America Vaccine Contract Manufacturing Industry Volume Share (%), by Process 2025 & 2033
- Figure 11: North America Vaccine Contract Manufacturing Industry Revenue (Million), by Scale of Operations 2025 & 2033
- Figure 12: North America Vaccine Contract Manufacturing Industry Volume (K Unit), by Scale of Operations 2025 & 2033
- Figure 13: North America Vaccine Contract Manufacturing Industry Revenue Share (%), by Scale of Operations 2025 & 2033
- Figure 14: North America Vaccine Contract Manufacturing Industry Volume Share (%), by Scale of Operations 2025 & 2033
- Figure 15: North America Vaccine Contract Manufacturing Industry Revenue (Million), by End Use 2025 & 2033
- Figure 16: North America Vaccine Contract Manufacturing Industry Volume (K Unit), by End Use 2025 & 2033
- Figure 17: North America Vaccine Contract Manufacturing Industry Revenue Share (%), by End Use 2025 & 2033
- Figure 18: North America Vaccine Contract Manufacturing Industry Volume Share (%), by End Use 2025 & 2033
- Figure 19: North America Vaccine Contract Manufacturing Industry Revenue (Million), by Country 2025 & 2033
- Figure 20: North America Vaccine Contract Manufacturing Industry Volume (K Unit), by Country 2025 & 2033
- Figure 21: North America Vaccine Contract Manufacturing Industry Revenue Share (%), by Country 2025 & 2033
- Figure 22: North America Vaccine Contract Manufacturing Industry Volume Share (%), by Country 2025 & 2033
- Figure 23: Europe Vaccine Contract Manufacturing Industry Revenue (Million), by Vaccine Type 2025 & 2033
- Figure 24: Europe Vaccine Contract Manufacturing Industry Volume (K Unit), by Vaccine Type 2025 & 2033
- Figure 25: Europe Vaccine Contract Manufacturing Industry Revenue Share (%), by Vaccine Type 2025 & 2033
- Figure 26: Europe Vaccine Contract Manufacturing Industry Volume Share (%), by Vaccine Type 2025 & 2033
- Figure 27: Europe Vaccine Contract Manufacturing Industry Revenue (Million), by Process 2025 & 2033
- Figure 28: Europe Vaccine Contract Manufacturing Industry Volume (K Unit), by Process 2025 & 2033
- Figure 29: Europe Vaccine Contract Manufacturing Industry Revenue Share (%), by Process 2025 & 2033
- Figure 30: Europe Vaccine Contract Manufacturing Industry Volume Share (%), by Process 2025 & 2033
- Figure 31: Europe Vaccine Contract Manufacturing Industry Revenue (Million), by Scale of Operations 2025 & 2033
- Figure 32: Europe Vaccine Contract Manufacturing Industry Volume (K Unit), by Scale of Operations 2025 & 2033
- Figure 33: Europe Vaccine Contract Manufacturing Industry Revenue Share (%), by Scale of Operations 2025 & 2033
- Figure 34: Europe Vaccine Contract Manufacturing Industry Volume Share (%), by Scale of Operations 2025 & 2033
- Figure 35: Europe Vaccine Contract Manufacturing Industry Revenue (Million), by End Use 2025 & 2033
- Figure 36: Europe Vaccine Contract Manufacturing Industry Volume (K Unit), by End Use 2025 & 2033
- Figure 37: Europe Vaccine Contract Manufacturing Industry Revenue Share (%), by End Use 2025 & 2033
- Figure 38: Europe Vaccine Contract Manufacturing Industry Volume Share (%), by End Use 2025 & 2033
- Figure 39: Europe Vaccine Contract Manufacturing Industry Revenue (Million), by Country 2025 & 2033
- Figure 40: Europe Vaccine Contract Manufacturing Industry Volume (K Unit), by Country 2025 & 2033
- Figure 41: Europe Vaccine Contract Manufacturing Industry Revenue Share (%), by Country 2025 & 2033
- Figure 42: Europe Vaccine Contract Manufacturing Industry Volume Share (%), by Country 2025 & 2033
- Figure 43: Asia Pacific Vaccine Contract Manufacturing Industry Revenue (Million), by Vaccine Type 2025 & 2033
- Figure 44: Asia Pacific Vaccine Contract Manufacturing Industry Volume (K Unit), by Vaccine Type 2025 & 2033
- Figure 45: Asia Pacific Vaccine Contract Manufacturing Industry Revenue Share (%), by Vaccine Type 2025 & 2033
- Figure 46: Asia Pacific Vaccine Contract Manufacturing Industry Volume Share (%), by Vaccine Type 2025 & 2033
- Figure 47: Asia Pacific Vaccine Contract Manufacturing Industry Revenue (Million), by Process 2025 & 2033
- Figure 48: Asia Pacific Vaccine Contract Manufacturing Industry Volume (K Unit), by Process 2025 & 2033
- Figure 49: Asia Pacific Vaccine Contract Manufacturing Industry Revenue Share (%), by Process 2025 & 2033
- Figure 50: Asia Pacific Vaccine Contract Manufacturing Industry Volume Share (%), by Process 2025 & 2033
- Figure 51: Asia Pacific Vaccine Contract Manufacturing Industry Revenue (Million), by Scale of Operations 2025 & 2033
- Figure 52: Asia Pacific Vaccine Contract Manufacturing Industry Volume (K Unit), by Scale of Operations 2025 & 2033
- Figure 53: Asia Pacific Vaccine Contract Manufacturing Industry Revenue Share (%), by Scale of Operations 2025 & 2033
- Figure 54: Asia Pacific Vaccine Contract Manufacturing Industry Volume Share (%), by Scale of Operations 2025 & 2033
- Figure 55: Asia Pacific Vaccine Contract Manufacturing Industry Revenue (Million), by End Use 2025 & 2033
- Figure 56: Asia Pacific Vaccine Contract Manufacturing Industry Volume (K Unit), by End Use 2025 & 2033
- Figure 57: Asia Pacific Vaccine Contract Manufacturing Industry Revenue Share (%), by End Use 2025 & 2033
- Figure 58: Asia Pacific Vaccine Contract Manufacturing Industry Volume Share (%), by End Use 2025 & 2033
- Figure 59: Asia Pacific Vaccine Contract Manufacturing Industry Revenue (Million), by Country 2025 & 2033
- Figure 60: Asia Pacific Vaccine Contract Manufacturing Industry Volume (K Unit), by Country 2025 & 2033
- Figure 61: Asia Pacific Vaccine Contract Manufacturing Industry Revenue Share (%), by Country 2025 & 2033
- Figure 62: Asia Pacific Vaccine Contract Manufacturing Industry Volume Share (%), by Country 2025 & 2033
- Figure 63: Middle East and Africa Vaccine Contract Manufacturing Industry Revenue (Million), by Vaccine Type 2025 & 2033
- Figure 64: Middle East and Africa Vaccine Contract Manufacturing Industry Volume (K Unit), by Vaccine Type 2025 & 2033
- Figure 65: Middle East and Africa Vaccine Contract Manufacturing Industry Revenue Share (%), by Vaccine Type 2025 & 2033
- Figure 66: Middle East and Africa Vaccine Contract Manufacturing Industry Volume Share (%), by Vaccine Type 2025 & 2033
- Figure 67: Middle East and Africa Vaccine Contract Manufacturing Industry Revenue (Million), by Process 2025 & 2033
- Figure 68: Middle East and Africa Vaccine Contract Manufacturing Industry Volume (K Unit), by Process 2025 & 2033
- Figure 69: Middle East and Africa Vaccine Contract Manufacturing Industry Revenue Share (%), by Process 2025 & 2033
- Figure 70: Middle East and Africa Vaccine Contract Manufacturing Industry Volume Share (%), by Process 2025 & 2033
- Figure 71: Middle East and Africa Vaccine Contract Manufacturing Industry Revenue (Million), by Scale of Operations 2025 & 2033
- Figure 72: Middle East and Africa Vaccine Contract Manufacturing Industry Volume (K Unit), by Scale of Operations 2025 & 2033
- Figure 73: Middle East and Africa Vaccine Contract Manufacturing Industry Revenue Share (%), by Scale of Operations 2025 & 2033
- Figure 74: Middle East and Africa Vaccine Contract Manufacturing Industry Volume Share (%), by Scale of Operations 2025 & 2033
- Figure 75: Middle East and Africa Vaccine Contract Manufacturing Industry Revenue (Million), by End Use 2025 & 2033
- Figure 76: Middle East and Africa Vaccine Contract Manufacturing Industry Volume (K Unit), by End Use 2025 & 2033
- Figure 77: Middle East and Africa Vaccine Contract Manufacturing Industry Revenue Share (%), by End Use 2025 & 2033
- Figure 78: Middle East and Africa Vaccine Contract Manufacturing Industry Volume Share (%), by End Use 2025 & 2033
- Figure 79: Middle East and Africa Vaccine Contract Manufacturing Industry Revenue (Million), by Country 2025 & 2033
- Figure 80: Middle East and Africa Vaccine Contract Manufacturing Industry Volume (K Unit), by Country 2025 & 2033
- Figure 81: Middle East and Africa Vaccine Contract Manufacturing Industry Revenue Share (%), by Country 2025 & 2033
- Figure 82: Middle East and Africa Vaccine Contract Manufacturing Industry Volume Share (%), by Country 2025 & 2033
- Figure 83: South America Vaccine Contract Manufacturing Industry Revenue (Million), by Vaccine Type 2025 & 2033
- Figure 84: South America Vaccine Contract Manufacturing Industry Volume (K Unit), by Vaccine Type 2025 & 2033
- Figure 85: South America Vaccine Contract Manufacturing Industry Revenue Share (%), by Vaccine Type 2025 & 2033
- Figure 86: South America Vaccine Contract Manufacturing Industry Volume Share (%), by Vaccine Type 2025 & 2033
- Figure 87: South America Vaccine Contract Manufacturing Industry Revenue (Million), by Process 2025 & 2033
- Figure 88: South America Vaccine Contract Manufacturing Industry Volume (K Unit), by Process 2025 & 2033
- Figure 89: South America Vaccine Contract Manufacturing Industry Revenue Share (%), by Process 2025 & 2033
- Figure 90: South America Vaccine Contract Manufacturing Industry Volume Share (%), by Process 2025 & 2033
- Figure 91: South America Vaccine Contract Manufacturing Industry Revenue (Million), by Scale of Operations 2025 & 2033
- Figure 92: South America Vaccine Contract Manufacturing Industry Volume (K Unit), by Scale of Operations 2025 & 2033
- Figure 93: South America Vaccine Contract Manufacturing Industry Revenue Share (%), by Scale of Operations 2025 & 2033
- Figure 94: South America Vaccine Contract Manufacturing Industry Volume Share (%), by Scale of Operations 2025 & 2033
- Figure 95: South America Vaccine Contract Manufacturing Industry Revenue (Million), by End Use 2025 & 2033
- Figure 96: South America Vaccine Contract Manufacturing Industry Volume (K Unit), by End Use 2025 & 2033
- Figure 97: South America Vaccine Contract Manufacturing Industry Revenue Share (%), by End Use 2025 & 2033
- Figure 98: South America Vaccine Contract Manufacturing Industry Volume Share (%), by End Use 2025 & 2033
- Figure 99: South America Vaccine Contract Manufacturing Industry Revenue (Million), by Country 2025 & 2033
- Figure 100: South America Vaccine Contract Manufacturing Industry Volume (K Unit), by Country 2025 & 2033
- Figure 101: South America Vaccine Contract Manufacturing Industry Revenue Share (%), by Country 2025 & 2033
- Figure 102: South America Vaccine Contract Manufacturing Industry Volume Share (%), by Country 2025 & 2033
List of Tables
- Table 1: Global Vaccine Contract Manufacturing Industry Revenue Million Forecast, by Vaccine Type 2020 & 2033
- Table 2: Global Vaccine Contract Manufacturing Industry Volume K Unit Forecast, by Vaccine Type 2020 & 2033
- Table 3: Global Vaccine Contract Manufacturing Industry Revenue Million Forecast, by Process 2020 & 2033
- Table 4: Global Vaccine Contract Manufacturing Industry Volume K Unit Forecast, by Process 2020 & 2033
- Table 5: Global Vaccine Contract Manufacturing Industry Revenue Million Forecast, by Scale of Operations 2020 & 2033
- Table 6: Global Vaccine Contract Manufacturing Industry Volume K Unit Forecast, by Scale of Operations 2020 & 2033
- Table 7: Global Vaccine Contract Manufacturing Industry Revenue Million Forecast, by End Use 2020 & 2033
- Table 8: Global Vaccine Contract Manufacturing Industry Volume K Unit Forecast, by End Use 2020 & 2033
- Table 9: Global Vaccine Contract Manufacturing Industry Revenue Million Forecast, by Region 2020 & 2033
- Table 10: Global Vaccine Contract Manufacturing Industry Volume K Unit Forecast, by Region 2020 & 2033
- Table 11: Global Vaccine Contract Manufacturing Industry Revenue Million Forecast, by Vaccine Type 2020 & 2033
- Table 12: Global Vaccine Contract Manufacturing Industry Volume K Unit Forecast, by Vaccine Type 2020 & 2033
- Table 13: Global Vaccine Contract Manufacturing Industry Revenue Million Forecast, by Process 2020 & 2033
- Table 14: Global Vaccine Contract Manufacturing Industry Volume K Unit Forecast, by Process 2020 & 2033
- Table 15: Global Vaccine Contract Manufacturing Industry Revenue Million Forecast, by Scale of Operations 2020 & 2033
- Table 16: Global Vaccine Contract Manufacturing Industry Volume K Unit Forecast, by Scale of Operations 2020 & 2033
- Table 17: Global Vaccine Contract Manufacturing Industry Revenue Million Forecast, by End Use 2020 & 2033
- Table 18: Global Vaccine Contract Manufacturing Industry Volume K Unit Forecast, by End Use 2020 & 2033
- Table 19: Global Vaccine Contract Manufacturing Industry Revenue Million Forecast, by Country 2020 & 2033
- Table 20: Global Vaccine Contract Manufacturing Industry Volume K Unit Forecast, by Country 2020 & 2033
- Table 21: United States Vaccine Contract Manufacturing Industry Revenue (Million) Forecast, by Application 2020 & 2033
- Table 22: United States Vaccine Contract Manufacturing Industry Volume (K Unit) Forecast, by Application 2020 & 2033
- Table 23: Canada Vaccine Contract Manufacturing Industry Revenue (Million) Forecast, by Application 2020 & 2033
- Table 24: Canada Vaccine Contract Manufacturing Industry Volume (K Unit) Forecast, by Application 2020 & 2033
- Table 25: Mexico Vaccine Contract Manufacturing Industry Revenue (Million) Forecast, by Application 2020 & 2033
- Table 26: Mexico Vaccine Contract Manufacturing Industry Volume (K Unit) Forecast, by Application 2020 & 2033
- Table 27: Global Vaccine Contract Manufacturing Industry Revenue Million Forecast, by Vaccine Type 2020 & 2033
- Table 28: Global Vaccine Contract Manufacturing Industry Volume K Unit Forecast, by Vaccine Type 2020 & 2033
- Table 29: Global Vaccine Contract Manufacturing Industry Revenue Million Forecast, by Process 2020 & 2033
- Table 30: Global Vaccine Contract Manufacturing Industry Volume K Unit Forecast, by Process 2020 & 2033
- Table 31: Global Vaccine Contract Manufacturing Industry Revenue Million Forecast, by Scale of Operations 2020 & 2033
- Table 32: Global Vaccine Contract Manufacturing Industry Volume K Unit Forecast, by Scale of Operations 2020 & 2033
- Table 33: Global Vaccine Contract Manufacturing Industry Revenue Million Forecast, by End Use 2020 & 2033
- Table 34: Global Vaccine Contract Manufacturing Industry Volume K Unit Forecast, by End Use 2020 & 2033
- Table 35: Global Vaccine Contract Manufacturing Industry Revenue Million Forecast, by Country 2020 & 2033
- Table 36: Global Vaccine Contract Manufacturing Industry Volume K Unit Forecast, by Country 2020 & 2033
- Table 37: Germany Vaccine Contract Manufacturing Industry Revenue (Million) Forecast, by Application 2020 & 2033
- Table 38: Germany Vaccine Contract Manufacturing Industry Volume (K Unit) Forecast, by Application 2020 & 2033
- Table 39: United Kingdom Vaccine Contract Manufacturing Industry Revenue (Million) Forecast, by Application 2020 & 2033
- Table 40: United Kingdom Vaccine Contract Manufacturing Industry Volume (K Unit) Forecast, by Application 2020 & 2033
- Table 41: France Vaccine Contract Manufacturing Industry Revenue (Million) Forecast, by Application 2020 & 2033
- Table 42: France Vaccine Contract Manufacturing Industry Volume (K Unit) Forecast, by Application 2020 & 2033
- Table 43: Italy Vaccine Contract Manufacturing Industry Revenue (Million) Forecast, by Application 2020 & 2033
- Table 44: Italy Vaccine Contract Manufacturing Industry Volume (K Unit) Forecast, by Application 2020 & 2033
- Table 45: Spain Vaccine Contract Manufacturing Industry Revenue (Million) Forecast, by Application 2020 & 2033
- Table 46: Spain Vaccine Contract Manufacturing Industry Volume (K Unit) Forecast, by Application 2020 & 2033
- Table 47: Rest of Europe Vaccine Contract Manufacturing Industry Revenue (Million) Forecast, by Application 2020 & 2033
- Table 48: Rest of Europe Vaccine Contract Manufacturing Industry Volume (K Unit) Forecast, by Application 2020 & 2033
- Table 49: Global Vaccine Contract Manufacturing Industry Revenue Million Forecast, by Vaccine Type 2020 & 2033
- Table 50: Global Vaccine Contract Manufacturing Industry Volume K Unit Forecast, by Vaccine Type 2020 & 2033
- Table 51: Global Vaccine Contract Manufacturing Industry Revenue Million Forecast, by Process 2020 & 2033
- Table 52: Global Vaccine Contract Manufacturing Industry Volume K Unit Forecast, by Process 2020 & 2033
- Table 53: Global Vaccine Contract Manufacturing Industry Revenue Million Forecast, by Scale of Operations 2020 & 2033
- Table 54: Global Vaccine Contract Manufacturing Industry Volume K Unit Forecast, by Scale of Operations 2020 & 2033
- Table 55: Global Vaccine Contract Manufacturing Industry Revenue Million Forecast, by End Use 2020 & 2033
- Table 56: Global Vaccine Contract Manufacturing Industry Volume K Unit Forecast, by End Use 2020 & 2033
- Table 57: Global Vaccine Contract Manufacturing Industry Revenue Million Forecast, by Country 2020 & 2033
- Table 58: Global Vaccine Contract Manufacturing Industry Volume K Unit Forecast, by Country 2020 & 2033
- Table 59: China Vaccine Contract Manufacturing Industry Revenue (Million) Forecast, by Application 2020 & 2033
- Table 60: China Vaccine Contract Manufacturing Industry Volume (K Unit) Forecast, by Application 2020 & 2033
- Table 61: Japan Vaccine Contract Manufacturing Industry Revenue (Million) Forecast, by Application 2020 & 2033
- Table 62: Japan Vaccine Contract Manufacturing Industry Volume (K Unit) Forecast, by Application 2020 & 2033
- Table 63: India Vaccine Contract Manufacturing Industry Revenue (Million) Forecast, by Application 2020 & 2033
- Table 64: India Vaccine Contract Manufacturing Industry Volume (K Unit) Forecast, by Application 2020 & 2033
- Table 65: Australia Vaccine Contract Manufacturing Industry Revenue (Million) Forecast, by Application 2020 & 2033
- Table 66: Australia Vaccine Contract Manufacturing Industry Volume (K Unit) Forecast, by Application 2020 & 2033
- Table 67: South Korea Vaccine Contract Manufacturing Industry Revenue (Million) Forecast, by Application 2020 & 2033
- Table 68: South Korea Vaccine Contract Manufacturing Industry Volume (K Unit) Forecast, by Application 2020 & 2033
- Table 69: Rest of Asia Pacific Vaccine Contract Manufacturing Industry Revenue (Million) Forecast, by Application 2020 & 2033
- Table 70: Rest of Asia Pacific Vaccine Contract Manufacturing Industry Volume (K Unit) Forecast, by Application 2020 & 2033
- Table 71: Global Vaccine Contract Manufacturing Industry Revenue Million Forecast, by Vaccine Type 2020 & 2033
- Table 72: Global Vaccine Contract Manufacturing Industry Volume K Unit Forecast, by Vaccine Type 2020 & 2033
- Table 73: Global Vaccine Contract Manufacturing Industry Revenue Million Forecast, by Process 2020 & 2033
- Table 74: Global Vaccine Contract Manufacturing Industry Volume K Unit Forecast, by Process 2020 & 2033
- Table 75: Global Vaccine Contract Manufacturing Industry Revenue Million Forecast, by Scale of Operations 2020 & 2033
- Table 76: Global Vaccine Contract Manufacturing Industry Volume K Unit Forecast, by Scale of Operations 2020 & 2033
- Table 77: Global Vaccine Contract Manufacturing Industry Revenue Million Forecast, by End Use 2020 & 2033
- Table 78: Global Vaccine Contract Manufacturing Industry Volume K Unit Forecast, by End Use 2020 & 2033
- Table 79: Global Vaccine Contract Manufacturing Industry Revenue Million Forecast, by Country 2020 & 2033
- Table 80: Global Vaccine Contract Manufacturing Industry Volume K Unit Forecast, by Country 2020 & 2033
- Table 81: GCC Vaccine Contract Manufacturing Industry Revenue (Million) Forecast, by Application 2020 & 2033
- Table 82: GCC Vaccine Contract Manufacturing Industry Volume (K Unit) Forecast, by Application 2020 & 2033
- Table 83: South Africa Vaccine Contract Manufacturing Industry Revenue (Million) Forecast, by Application 2020 & 2033
- Table 84: South Africa Vaccine Contract Manufacturing Industry Volume (K Unit) Forecast, by Application 2020 & 2033
- Table 85: Rest of Middle East and Africa Vaccine Contract Manufacturing Industry Revenue (Million) Forecast, by Application 2020 & 2033
- Table 86: Rest of Middle East and Africa Vaccine Contract Manufacturing Industry Volume (K Unit) Forecast, by Application 2020 & 2033
- Table 87: Global Vaccine Contract Manufacturing Industry Revenue Million Forecast, by Vaccine Type 2020 & 2033
- Table 88: Global Vaccine Contract Manufacturing Industry Volume K Unit Forecast, by Vaccine Type 2020 & 2033
- Table 89: Global Vaccine Contract Manufacturing Industry Revenue Million Forecast, by Process 2020 & 2033
- Table 90: Global Vaccine Contract Manufacturing Industry Volume K Unit Forecast, by Process 2020 & 2033
- Table 91: Global Vaccine Contract Manufacturing Industry Revenue Million Forecast, by Scale of Operations 2020 & 2033
- Table 92: Global Vaccine Contract Manufacturing Industry Volume K Unit Forecast, by Scale of Operations 2020 & 2033
- Table 93: Global Vaccine Contract Manufacturing Industry Revenue Million Forecast, by End Use 2020 & 2033
- Table 94: Global Vaccine Contract Manufacturing Industry Volume K Unit Forecast, by End Use 2020 & 2033
- Table 95: Global Vaccine Contract Manufacturing Industry Revenue Million Forecast, by Country 2020 & 2033
- Table 96: Global Vaccine Contract Manufacturing Industry Volume K Unit Forecast, by Country 2020 & 2033
- Table 97: Brazil Vaccine Contract Manufacturing Industry Revenue (Million) Forecast, by Application 2020 & 2033
- Table 98: Brazil Vaccine Contract Manufacturing Industry Volume (K Unit) Forecast, by Application 2020 & 2033
- Table 99: Argentina Vaccine Contract Manufacturing Industry Revenue (Million) Forecast, by Application 2020 & 2033
- Table 100: Argentina Vaccine Contract Manufacturing Industry Volume (K Unit) Forecast, by Application 2020 & 2033
- Table 101: Rest of South America Vaccine Contract Manufacturing Industry Revenue (Million) Forecast, by Application 2020 & 2033
- Table 102: Rest of South America Vaccine Contract Manufacturing Industry Volume (K Unit) Forecast, by Application 2020 & 2033
Frequently Asked Questions
1. What is the projected Compound Annual Growth Rate (CAGR) of the Vaccine Contract Manufacturing Industry?
The projected CAGR is approximately 11.18%.
2. Which companies are prominent players in the Vaccine Contract Manufacturing Industry?
Key companies in the market include CJ CheilJedang Corporation (Batavia Biosciences), Curia Global, ICON PLC, Charles River Laboratories International Inc, Catalent, IDT Biologika GmbH, Lonza Group AG, Gedeon Richter (Richter-Helm BioLogics), Ajinomoto Bio-Pharma Services, Recipharm AB, Emergent BioSolutions Inc, Fujifilm Holdings Corporation.
3. What are the main segments of the Vaccine Contract Manufacturing Industry?
The market segments include Vaccine Type, Process, Scale of Operations, End Use.
4. Can you provide details about the market size?
The market size is estimated to be USD 3.51 Million as of 2022.
5. What are some drivers contributing to market growth?
Advancements in Technology and Cost Benefits in Infrastructure and Operational Benefits; Increase in Initiatives Favoring Vaccinations; Favorable Patient Demographics and Growing Vaccinations of Newborns and Children.
6. What are the notable trends driving market growth?
The Inactivated Vaccines Segment is Expected to Hold a Significant Share in the Vaccine Contract Manufacturing Market over the Forecast Period.
7. Are there any restraints impacting market growth?
Rising High Costs of Vaccines; Lack of Storage Infrastructure and Limitations Associated with Supply Chain.
8. Can you provide examples of recent developments in the market?
August 2022: Moderna inked an agreement with the Canadian government to construct a messenger RNA vaccine manufacturing factory in an undetermined location in Canada. According to the biotech firm, the partnership will give Canadians access to mRNA vaccines made in Canada against respiratory viruses such as SARS-CoV-2, influenza, and respiratory syncytial virus.
9. What pricing options are available for accessing the report?
Pricing options include single-user, multi-user, and enterprise licenses priced at USD 4750, USD 5250, and USD 8750 respectively.
10. Is the market size provided in terms of value or volume?
The market size is provided in terms of value, measured in Million and volume, measured in K Unit.
11. Are there any specific market keywords associated with the report?
Yes, the market keyword associated with the report is "Vaccine Contract Manufacturing Industry," which aids in identifying and referencing the specific market segment covered.
12. How do I determine which pricing option suits my needs best?
The pricing options vary based on user requirements and access needs. Individual users may opt for single-user licenses, while businesses requiring broader access may choose multi-user or enterprise licenses for cost-effective access to the report.
13. Are there any additional resources or data provided in the Vaccine Contract Manufacturing Industry report?
While the report offers comprehensive insights, it's advisable to review the specific contents or supplementary materials provided to ascertain if additional resources or data are available.
14. How can I stay updated on further developments or reports in the Vaccine Contract Manufacturing Industry?
To stay informed about further developments, trends, and reports in the Vaccine Contract Manufacturing Industry, consider subscribing to industry newsletters, following relevant companies and organizations, or regularly checking reputable industry news sources and publications.
Methodology
Step 1 - Identification of Relevant Samples Size from Population Database


Step 2 - Approaches for Defining Global Market Size (Value, Volume* & Price*)

Note*: In applicable scenarios
Step 3 - Data Sources
Primary Research
- Web Analytics
- Survey Reports
- Research Institute
- Latest Research Reports
- Opinion Leaders
Secondary Research
- Annual Reports
- White Paper
- Latest Press Release
- Industry Association
- Paid Database
- Investor Presentations

Step 4 - Data Triangulation
Involves using different sources of information in order to increase the validity of a study
These sources are likely to be stakeholders in a program - participants, other researchers, program staff, other community members, and so on.
Then we put all data in single framework & apply various statistical tools to find out the dynamic on the market.
During the analysis stage, feedback from the stakeholder groups would be compared to determine areas of agreement as well as areas of divergence