
Key Insights
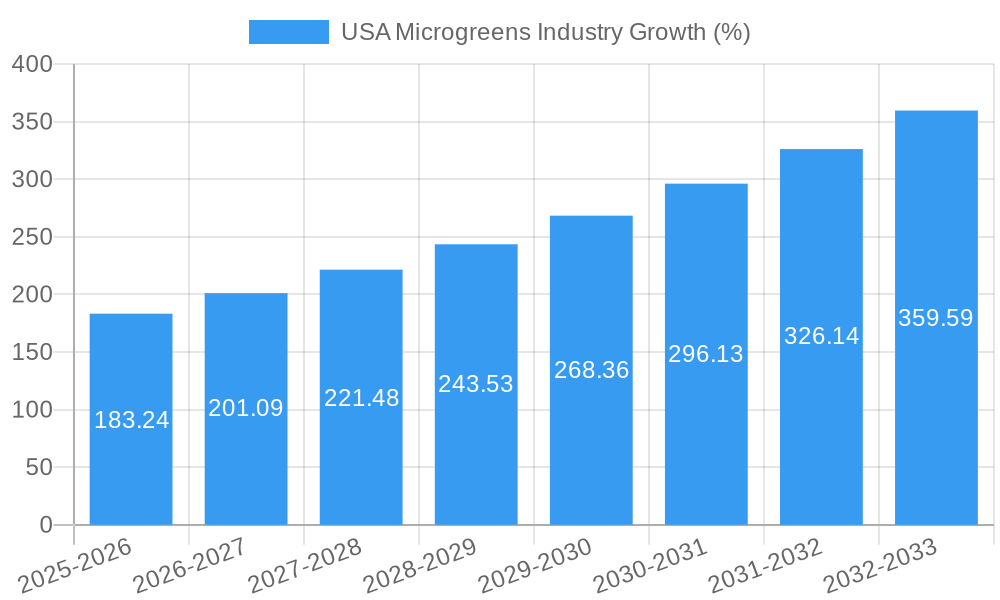
The US microgreens industry, valued at $1.74 billion in 2025, is experiencing robust growth, projected to expand at a compound annual growth rate (CAGR) of 10.60% from 2025 to 2033. This surge is driven by several key factors. Increasing consumer awareness of the nutritional benefits of microgreens, coupled with their versatility in culinary applications, is fueling demand across diverse sales channels. The rise of health-conscious consumers seeking nutrient-dense foods and the growing popularity of plant-based diets significantly contribute to market expansion. Furthermore, the adoption of innovative farming techniques like indoor and vertical farming allows for year-round production, regardless of weather conditions, increasing supply and reducing reliance on traditional agricultural practices. The industry is segmented by sales channel (hypermarkets/supermarkets, restaurants, other channels) and type (broccoli, lettuce & chicory, basil, fennel, and others), reflecting diverse consumer preferences and market penetration strategies. The competitive landscape comprises both established players like AeroFarms LLC and smaller, regional producers, indicating a dynamic and expanding market.
The regional distribution within the US shows significant potential for growth across all regions (Northeast, Southeast, Midwest, Southwest, and West). However, regions with higher population densities and established healthy food markets may exhibit faster growth rates. Continued innovation in farming technologies, coupled with targeted marketing campaigns highlighting the health benefits and culinary uses of microgreens, will further propel market expansion. Potential restraints include the relatively high production costs compared to traditional greens and the need to address consumer awareness in less health-conscious segments. Nevertheless, the overall outlook for the US microgreens industry remains extremely positive, indicating substantial growth opportunities for existing and new market entrants. This trend reflects a broader shift towards healthy and sustainable food choices among American consumers.

USA Microgreens Industry Market Report: 2019-2033
This comprehensive report provides a detailed analysis of the USA microgreens industry, covering market dynamics, growth trends, competitive landscape, and future outlook. With a focus on key segments like indoor farming, vertical farming, and specific microgreen types, this report is an essential resource for industry professionals, investors, and anyone seeking to understand this rapidly expanding market. The study period spans 2019-2033, with 2025 as the base and estimated year.
USA Microgreens Industry Market Dynamics & Structure
The US microgreens market, valued at xx million in 2024, exhibits a moderately fragmented structure. While several large players exist, numerous smaller, regional producers also contribute significantly. Market concentration is expected to evolve with further consolidation and expansion by major players.
- Technological Innovation: Advancements in vertical farming, aeroponics, and hydroponics are key drivers, improving yields, reducing costs, and ensuring year-round availability. Innovation barriers include high initial investment costs for advanced technologies and the need for skilled labor.
- Regulatory Framework: Food safety regulations and organic certification standards influence production practices and market access. These regulations vary by state and can present challenges for smaller producers.
- Competitive Product Substitutes: Traditional leafy greens pose a competitive threat, although microgreens offer a distinct value proposition: higher nutrient density and shorter growing cycles.
- End-User Demographics: Health-conscious consumers, millennials, and individuals seeking premium, locally sourced produce drive demand. Growing awareness of the nutritional benefits further fuels market expansion.
- M&A Trends: The past five years have witnessed xx M&A deals in the sector, primarily focused on expanding production capacity and market reach. Consolidation is expected to increase as larger companies seek to gain market share.
USA Microgreens Industry Growth Trends & Insights
The US microgreens market has witnessed robust growth over the past five years (2019-2024), with a CAGR of xx%. This growth reflects rising consumer demand for healthier, nutrient-rich foods and the increasing adoption of innovative farming techniques. Market penetration, currently at xx%, is expected to increase significantly driven by growing consumer awareness and expanding distribution channels. Technological disruptions, such as automation and AI-powered farming, are further accelerating market growth. Shifting consumer preferences towards convenient, readily available healthy foods also contribute to the market's expansion. The market is projected to reach xx million by 2033, indicating a strong growth trajectory.
Dominant Regions, Countries, or Segments in USA Microgreens Industry
California, followed by New York and Texas, represent the leading regions in the US microgreens industry. These states benefit from favorable climatic conditions, established agricultural infrastructure, and a high concentration of consumers with health-conscious lifestyles.
Sales Channels: Hypermarkets/supermarkets contribute the largest share (xx%) due to their widespread reach. Restaurants (xx%) represent a significant segment driven by the increasing use of microgreens as a premium ingredient. Other channels, including online retailers and farmers markets, are showing rapid growth.
Farming Techniques: Indoor farming (xx%) and vertical farming (xx%) are the dominant techniques, offering advantages in terms of climate control, yield optimization, and reduced land use.
Microgreen Types: Broccoli, lettuce and chicory, and basil are currently the highest-selling varieties, driven by consumer familiarity and versatility in culinary applications. However, demand for other varieties, such as radish, arugula, and kale, is also increasing.
- Key Drivers: Growing health consciousness, increasing disposable incomes, and government support for sustainable agriculture are major growth drivers. Urbanization and space limitations fuel the adoption of vertical farming.
- Dominance Factors: Established distribution networks, a high concentration of health-conscious consumers, and proximity to major population centers contribute to the dominance of specific regions and segments.
USA Microgreens Industry Product Landscape
Microgreens are offered in a variety of forms, including pre-packaged trays, bulk containers, and custom blends tailored to specific culinary applications. Innovations focus on enhancing flavor profiles, improving shelf life through advanced packaging, and developing new microgreen varieties with unique nutritional properties. Technological advancements, such as automated harvesting and precision climate control, aim to optimize quality and reduce production costs. Unique selling propositions include higher nutrient density compared to mature greens, unique flavor profiles, and suitability for a diverse range of culinary applications.
Key Drivers, Barriers & Challenges in USA Microgreens Industry
Key Drivers: The increasing popularity of healthy eating, the rising demand for locally sourced and organic produce, and technological advancements in controlled environment agriculture are key drivers of growth.
Key Challenges and Restraints: High initial investment costs for advanced farming technologies, challenges in scaling production to meet increasing demand, and the potential for crop losses due to pests and diseases can impede market growth. Supply chain complexities and seasonality (for some varieties grown outdoors) also represent challenges.
Emerging Opportunities in USA Microgreens Industry
Untapped markets in smaller cities and rural areas present significant expansion potential. Innovative applications in food processing, such as the use of microgreens in ready-to-eat meals and snacks, are emerging. Evolving consumer preferences towards convenience and unique flavor profiles drive opportunities for customized microgreen blends and novel product formats.
Growth Accelerators in the USA Microgreens Industry Industry
Technological breakthroughs in automation, AI-powered farming, and precision agriculture are accelerating industry growth by enhancing efficiency and reducing production costs. Strategic partnerships between producers, distributors, and retailers are strengthening supply chains and improving market access. Expansion into new geographical markets and product diversification are enhancing market reach and revenue streams.
Key Players Shaping the USA Microgreens Industry Market
- The Chef's Garden Inc
- Quantum Microgreens
- Metro Microgreens
- Long Island Microgreens LL
- Emerald Gardens
- Fresh Origins
- Florida Microgreens
- Farmbox Greens LLC
- Arizona Microgreens LLC
- AeroFarms LLC
Notable Milestones in USA Microgreens Industry Sector
- September 2022: AeroFarms establishes the world's largest aeroponic smart farm in Danville, VA, capable of producing over 3 million lbs of leafy greens annually.
- July 2022: AeroFarms expands its Pittsylvania County vertical farm, boosting production to meet rising consumer demand.
- February 2022: Infarm opens a new vertical farming center in Texas, significantly expanding microgreens production in the region.
In-Depth USA Microgreens Industry Market Outlook
The US microgreens market is poised for continued strong growth, driven by technological advancements, expanding consumer demand, and increased investment in the sector. Strategic partnerships, innovative product development, and expansion into new market segments will shape future market dynamics. The market's potential is significant, with opportunities for both large-scale producers and smaller, specialized operations.
USA Microgreens Industry Segmentation
- 1. Production Analysis
- 2. Consumption Analysis
- 3. Import Market Analysis (Value & Volume)
- 4. Export Market Analysis (Value & Volume)
- 5. Price Trend Analysis
USA Microgreens Industry Segmentation By Geography
-
1. North America
- 1.1. United States
- 1.2. Canada
- 1.3. Mexico
-
2. South America
- 2.1. Brazil
- 2.2. Argentina
- 2.3. Rest of South America
-
3. Europe
- 3.1. United Kingdom
- 3.2. Germany
- 3.3. France
- 3.4. Italy
- 3.5. Spain
- 3.6. Russia
- 3.7. Benelux
- 3.8. Nordics
- 3.9. Rest of Europe
-
4. Middle East & Africa
- 4.1. Turkey
- 4.2. Israel
- 4.3. GCC
- 4.4. North Africa
- 4.5. South Africa
- 4.6. Rest of Middle East & Africa
-
5. Asia Pacific
- 5.1. China
- 5.2. India
- 5.3. Japan
- 5.4. South Korea
- 5.5. ASEAN
- 5.6. Oceania
- 5.7. Rest of Asia Pacific

USA Microgreens Industry REPORT HIGHLIGHTS
| Aspects | Details |
|---|---|
| Study Period | 2019-2033 |
| Base Year | 2024 |
| Estimated Year | 2025 |
| Forecast Period | 2025-2033 |
| Historical Period | 2019-2024 |
| Growth Rate | CAGR of 10.60% from 2019-2033 |
| Segmentation |
|
Table of Contents
- 1. Introduction
- 1.1. Research Scope
- 1.2. Market Segmentation
- 1.3. Research Methodology
- 1.4. Definitions and Assumptions
- 2. Executive Summary
- 2.1. Introduction
- 3. Market Dynamics
- 3.1. Introduction
- 3.2. Market Drivers
- 3.2.1. Need for Custom Product Development; Use of CROs for Regulatory Services
- 3.3. Market Restrains
- 3.3.1. Data and Cyber Security Concerns; Lack of Experts and Professionals in this Industry
- 3.4. Market Trends
- 3.4.1. Increased Investments in Vertical Farming Domain
- 4. Market Factor Analysis
- 4.1. Porters Five Forces
- 4.2. Supply/Value Chain
- 4.3. PESTEL analysis
- 4.4. Market Entropy
- 4.5. Patent/Trademark Analysis
- 5. Global USA Microgreens Industry Analysis, Insights and Forecast, 2019-2031
- 5.1. Market Analysis, Insights and Forecast - by Production Analysis
- 5.2. Market Analysis, Insights and Forecast - by Consumption Analysis
- 5.3. Market Analysis, Insights and Forecast - by Import Market Analysis (Value & Volume)
- 5.4. Market Analysis, Insights and Forecast - by Export Market Analysis (Value & Volume)
- 5.5. Market Analysis, Insights and Forecast - by Price Trend Analysis
- 5.6. Market Analysis, Insights and Forecast - by Region
- 5.6.1. North America
- 5.6.2. South America
- 5.6.3. Europe
- 5.6.4. Middle East & Africa
- 5.6.5. Asia Pacific
- 5.1. Market Analysis, Insights and Forecast - by Production Analysis
- 6. North America USA Microgreens Industry Analysis, Insights and Forecast, 2019-2031
- 6.1. Market Analysis, Insights and Forecast - by Production Analysis
- 6.2. Market Analysis, Insights and Forecast - by Consumption Analysis
- 6.3. Market Analysis, Insights and Forecast - by Import Market Analysis (Value & Volume)
- 6.4. Market Analysis, Insights and Forecast - by Export Market Analysis (Value & Volume)
- 6.5. Market Analysis, Insights and Forecast - by Price Trend Analysis
- 6.1. Market Analysis, Insights and Forecast - by Production Analysis
- 7. South America USA Microgreens Industry Analysis, Insights and Forecast, 2019-2031
- 7.1. Market Analysis, Insights and Forecast - by Production Analysis
- 7.2. Market Analysis, Insights and Forecast - by Consumption Analysis
- 7.3. Market Analysis, Insights and Forecast - by Import Market Analysis (Value & Volume)
- 7.4. Market Analysis, Insights and Forecast - by Export Market Analysis (Value & Volume)
- 7.5. Market Analysis, Insights and Forecast - by Price Trend Analysis
- 7.1. Market Analysis, Insights and Forecast - by Production Analysis
- 8. Europe USA Microgreens Industry Analysis, Insights and Forecast, 2019-2031
- 8.1. Market Analysis, Insights and Forecast - by Production Analysis
- 8.2. Market Analysis, Insights and Forecast - by Consumption Analysis
- 8.3. Market Analysis, Insights and Forecast - by Import Market Analysis (Value & Volume)
- 8.4. Market Analysis, Insights and Forecast - by Export Market Analysis (Value & Volume)
- 8.5. Market Analysis, Insights and Forecast - by Price Trend Analysis
- 8.1. Market Analysis, Insights and Forecast - by Production Analysis
- 9. Middle East & Africa USA Microgreens Industry Analysis, Insights and Forecast, 2019-2031
- 9.1. Market Analysis, Insights and Forecast - by Production Analysis
- 9.2. Market Analysis, Insights and Forecast - by Consumption Analysis
- 9.3. Market Analysis, Insights and Forecast - by Import Market Analysis (Value & Volume)
- 9.4. Market Analysis, Insights and Forecast - by Export Market Analysis (Value & Volume)
- 9.5. Market Analysis, Insights and Forecast - by Price Trend Analysis
- 9.1. Market Analysis, Insights and Forecast - by Production Analysis
- 10. Asia Pacific USA Microgreens Industry Analysis, Insights and Forecast, 2019-2031
- 10.1. Market Analysis, Insights and Forecast - by Production Analysis
- 10.2. Market Analysis, Insights and Forecast - by Consumption Analysis
- 10.3. Market Analysis, Insights and Forecast - by Import Market Analysis (Value & Volume)
- 10.4. Market Analysis, Insights and Forecast - by Export Market Analysis (Value & Volume)
- 10.5. Market Analysis, Insights and Forecast - by Price Trend Analysis
- 10.1. Market Analysis, Insights and Forecast - by Production Analysis
- 11. Northeast USA Microgreens Industry Analysis, Insights and Forecast, 2019-2031
- 12. Southeast USA Microgreens Industry Analysis, Insights and Forecast, 2019-2031
- 13. Midwest USA Microgreens Industry Analysis, Insights and Forecast, 2019-2031
- 14. Southwest USA Microgreens Industry Analysis, Insights and Forecast, 2019-2031
- 15. West USA Microgreens Industry Analysis, Insights and Forecast, 2019-2031
- 16. Competitive Analysis
- 16.1. Global Market Share Analysis 2024
- 16.2. Company Profiles
- 16.2.1 The Chef's Garden Inc
- 16.2.1.1. Overview
- 16.2.1.2. Products
- 16.2.1.3. SWOT Analysis
- 16.2.1.4. Recent Developments
- 16.2.1.5. Financials (Based on Availability)
- 16.2.2 Quantum Microgreens
- 16.2.2.1. Overview
- 16.2.2.2. Products
- 16.2.2.3. SWOT Analysis
- 16.2.2.4. Recent Developments
- 16.2.2.5. Financials (Based on Availability)
- 16.2.3 Metro Microgreens
- 16.2.3.1. Overview
- 16.2.3.2. Products
- 16.2.3.3. SWOT Analysis
- 16.2.3.4. Recent Developments
- 16.2.3.5. Financials (Based on Availability)
- 16.2.4 Long Island Microgreens LL
- 16.2.4.1. Overview
- 16.2.4.2. Products
- 16.2.4.3. SWOT Analysis
- 16.2.4.4. Recent Developments
- 16.2.4.5. Financials (Based on Availability)
- 16.2.5 Emerald Gardens
- 16.2.5.1. Overview
- 16.2.5.2. Products
- 16.2.5.3. SWOT Analysis
- 16.2.5.4. Recent Developments
- 16.2.5.5. Financials (Based on Availability)
- 16.2.6 Fresh Origins
- 16.2.6.1. Overview
- 16.2.6.2. Products
- 16.2.6.3. SWOT Analysis
- 16.2.6.4. Recent Developments
- 16.2.6.5. Financials (Based on Availability)
- 16.2.7 Florida Microgreens
- 16.2.7.1. Overview
- 16.2.7.2. Products
- 16.2.7.3. SWOT Analysis
- 16.2.7.4. Recent Developments
- 16.2.7.5. Financials (Based on Availability)
- 16.2.8 Farmbox Greens LLC
- 16.2.8.1. Overview
- 16.2.8.2. Products
- 16.2.8.3. SWOT Analysis
- 16.2.8.4. Recent Developments
- 16.2.8.5. Financials (Based on Availability)
- 16.2.9 Arizona Microgreens LLC
- 16.2.9.1. Overview
- 16.2.9.2. Products
- 16.2.9.3. SWOT Analysis
- 16.2.9.4. Recent Developments
- 16.2.9.5. Financials (Based on Availability)
- 16.2.10 AeroFarms LLC
- 16.2.10.1. Overview
- 16.2.10.2. Products
- 16.2.10.3. SWOT Analysis
- 16.2.10.4. Recent Developments
- 16.2.10.5. Financials (Based on Availability)
- 16.2.1 The Chef's Garden Inc
List of Figures
- Figure 1: Global USA Microgreens Industry Revenue Breakdown (Million, %) by Region 2024 & 2032
- Figure 2: United states USA Microgreens Industry Revenue (Million), by Country 2024 & 2032
- Figure 3: United states USA Microgreens Industry Revenue Share (%), by Country 2024 & 2032
- Figure 4: North America USA Microgreens Industry Revenue (Million), by Production Analysis 2024 & 2032
- Figure 5: North America USA Microgreens Industry Revenue Share (%), by Production Analysis 2024 & 2032
- Figure 6: North America USA Microgreens Industry Revenue (Million), by Consumption Analysis 2024 & 2032
- Figure 7: North America USA Microgreens Industry Revenue Share (%), by Consumption Analysis 2024 & 2032
- Figure 8: North America USA Microgreens Industry Revenue (Million), by Import Market Analysis (Value & Volume) 2024 & 2032
- Figure 9: North America USA Microgreens Industry Revenue Share (%), by Import Market Analysis (Value & Volume) 2024 & 2032
- Figure 10: North America USA Microgreens Industry Revenue (Million), by Export Market Analysis (Value & Volume) 2024 & 2032
- Figure 11: North America USA Microgreens Industry Revenue Share (%), by Export Market Analysis (Value & Volume) 2024 & 2032
- Figure 12: North America USA Microgreens Industry Revenue (Million), by Price Trend Analysis 2024 & 2032
- Figure 13: North America USA Microgreens Industry Revenue Share (%), by Price Trend Analysis 2024 & 2032
- Figure 14: North America USA Microgreens Industry Revenue (Million), by Country 2024 & 2032
- Figure 15: North America USA Microgreens Industry Revenue Share (%), by Country 2024 & 2032
- Figure 16: South America USA Microgreens Industry Revenue (Million), by Production Analysis 2024 & 2032
- Figure 17: South America USA Microgreens Industry Revenue Share (%), by Production Analysis 2024 & 2032
- Figure 18: South America USA Microgreens Industry Revenue (Million), by Consumption Analysis 2024 & 2032
- Figure 19: South America USA Microgreens Industry Revenue Share (%), by Consumption Analysis 2024 & 2032
- Figure 20: South America USA Microgreens Industry Revenue (Million), by Import Market Analysis (Value & Volume) 2024 & 2032
- Figure 21: South America USA Microgreens Industry Revenue Share (%), by Import Market Analysis (Value & Volume) 2024 & 2032
- Figure 22: South America USA Microgreens Industry Revenue (Million), by Export Market Analysis (Value & Volume) 2024 & 2032
- Figure 23: South America USA Microgreens Industry Revenue Share (%), by Export Market Analysis (Value & Volume) 2024 & 2032
- Figure 24: South America USA Microgreens Industry Revenue (Million), by Price Trend Analysis 2024 & 2032
- Figure 25: South America USA Microgreens Industry Revenue Share (%), by Price Trend Analysis 2024 & 2032
- Figure 26: South America USA Microgreens Industry Revenue (Million), by Country 2024 & 2032
- Figure 27: South America USA Microgreens Industry Revenue Share (%), by Country 2024 & 2032
- Figure 28: Europe USA Microgreens Industry Revenue (Million), by Production Analysis 2024 & 2032
- Figure 29: Europe USA Microgreens Industry Revenue Share (%), by Production Analysis 2024 & 2032
- Figure 30: Europe USA Microgreens Industry Revenue (Million), by Consumption Analysis 2024 & 2032
- Figure 31: Europe USA Microgreens Industry Revenue Share (%), by Consumption Analysis 2024 & 2032
- Figure 32: Europe USA Microgreens Industry Revenue (Million), by Import Market Analysis (Value & Volume) 2024 & 2032
- Figure 33: Europe USA Microgreens Industry Revenue Share (%), by Import Market Analysis (Value & Volume) 2024 & 2032
- Figure 34: Europe USA Microgreens Industry Revenue (Million), by Export Market Analysis (Value & Volume) 2024 & 2032
- Figure 35: Europe USA Microgreens Industry Revenue Share (%), by Export Market Analysis (Value & Volume) 2024 & 2032
- Figure 36: Europe USA Microgreens Industry Revenue (Million), by Price Trend Analysis 2024 & 2032
- Figure 37: Europe USA Microgreens Industry Revenue Share (%), by Price Trend Analysis 2024 & 2032
- Figure 38: Europe USA Microgreens Industry Revenue (Million), by Country 2024 & 2032
- Figure 39: Europe USA Microgreens Industry Revenue Share (%), by Country 2024 & 2032
- Figure 40: Middle East & Africa USA Microgreens Industry Revenue (Million), by Production Analysis 2024 & 2032
- Figure 41: Middle East & Africa USA Microgreens Industry Revenue Share (%), by Production Analysis 2024 & 2032
- Figure 42: Middle East & Africa USA Microgreens Industry Revenue (Million), by Consumption Analysis 2024 & 2032
- Figure 43: Middle East & Africa USA Microgreens Industry Revenue Share (%), by Consumption Analysis 2024 & 2032
- Figure 44: Middle East & Africa USA Microgreens Industry Revenue (Million), by Import Market Analysis (Value & Volume) 2024 & 2032
- Figure 45: Middle East & Africa USA Microgreens Industry Revenue Share (%), by Import Market Analysis (Value & Volume) 2024 & 2032
- Figure 46: Middle East & Africa USA Microgreens Industry Revenue (Million), by Export Market Analysis (Value & Volume) 2024 & 2032
- Figure 47: Middle East & Africa USA Microgreens Industry Revenue Share (%), by Export Market Analysis (Value & Volume) 2024 & 2032
- Figure 48: Middle East & Africa USA Microgreens Industry Revenue (Million), by Price Trend Analysis 2024 & 2032
- Figure 49: Middle East & Africa USA Microgreens Industry Revenue Share (%), by Price Trend Analysis 2024 & 2032
- Figure 50: Middle East & Africa USA Microgreens Industry Revenue (Million), by Country 2024 & 2032
- Figure 51: Middle East & Africa USA Microgreens Industry Revenue Share (%), by Country 2024 & 2032
- Figure 52: Asia Pacific USA Microgreens Industry Revenue (Million), by Production Analysis 2024 & 2032
- Figure 53: Asia Pacific USA Microgreens Industry Revenue Share (%), by Production Analysis 2024 & 2032
- Figure 54: Asia Pacific USA Microgreens Industry Revenue (Million), by Consumption Analysis 2024 & 2032
- Figure 55: Asia Pacific USA Microgreens Industry Revenue Share (%), by Consumption Analysis 2024 & 2032
- Figure 56: Asia Pacific USA Microgreens Industry Revenue (Million), by Import Market Analysis (Value & Volume) 2024 & 2032
- Figure 57: Asia Pacific USA Microgreens Industry Revenue Share (%), by Import Market Analysis (Value & Volume) 2024 & 2032
- Figure 58: Asia Pacific USA Microgreens Industry Revenue (Million), by Export Market Analysis (Value & Volume) 2024 & 2032
- Figure 59: Asia Pacific USA Microgreens Industry Revenue Share (%), by Export Market Analysis (Value & Volume) 2024 & 2032
- Figure 60: Asia Pacific USA Microgreens Industry Revenue (Million), by Price Trend Analysis 2024 & 2032
- Figure 61: Asia Pacific USA Microgreens Industry Revenue Share (%), by Price Trend Analysis 2024 & 2032
- Figure 62: Asia Pacific USA Microgreens Industry Revenue (Million), by Country 2024 & 2032
- Figure 63: Asia Pacific USA Microgreens Industry Revenue Share (%), by Country 2024 & 2032
List of Tables
- Table 1: Global USA Microgreens Industry Revenue Million Forecast, by Region 2019 & 2032
- Table 2: Global USA Microgreens Industry Revenue Million Forecast, by Production Analysis 2019 & 2032
- Table 3: Global USA Microgreens Industry Revenue Million Forecast, by Consumption Analysis 2019 & 2032
- Table 4: Global USA Microgreens Industry Revenue Million Forecast, by Import Market Analysis (Value & Volume) 2019 & 2032
- Table 5: Global USA Microgreens Industry Revenue Million Forecast, by Export Market Analysis (Value & Volume) 2019 & 2032
- Table 6: Global USA Microgreens Industry Revenue Million Forecast, by Price Trend Analysis 2019 & 2032
- Table 7: Global USA Microgreens Industry Revenue Million Forecast, by Region 2019 & 2032
- Table 8: Global USA Microgreens Industry Revenue Million Forecast, by Country 2019 & 2032
- Table 9: Northeast USA Microgreens Industry Revenue (Million) Forecast, by Application 2019 & 2032
- Table 10: Southeast USA Microgreens Industry Revenue (Million) Forecast, by Application 2019 & 2032
- Table 11: Midwest USA Microgreens Industry Revenue (Million) Forecast, by Application 2019 & 2032
- Table 12: Southwest USA Microgreens Industry Revenue (Million) Forecast, by Application 2019 & 2032
- Table 13: West USA Microgreens Industry Revenue (Million) Forecast, by Application 2019 & 2032
- Table 14: Global USA Microgreens Industry Revenue Million Forecast, by Production Analysis 2019 & 2032
- Table 15: Global USA Microgreens Industry Revenue Million Forecast, by Consumption Analysis 2019 & 2032
- Table 16: Global USA Microgreens Industry Revenue Million Forecast, by Import Market Analysis (Value & Volume) 2019 & 2032
- Table 17: Global USA Microgreens Industry Revenue Million Forecast, by Export Market Analysis (Value & Volume) 2019 & 2032
- Table 18: Global USA Microgreens Industry Revenue Million Forecast, by Price Trend Analysis 2019 & 2032
- Table 19: Global USA Microgreens Industry Revenue Million Forecast, by Country 2019 & 2032
- Table 20: United States USA Microgreens Industry Revenue (Million) Forecast, by Application 2019 & 2032
- Table 21: Canada USA Microgreens Industry Revenue (Million) Forecast, by Application 2019 & 2032
- Table 22: Mexico USA Microgreens Industry Revenue (Million) Forecast, by Application 2019 & 2032
- Table 23: Global USA Microgreens Industry Revenue Million Forecast, by Production Analysis 2019 & 2032
- Table 24: Global USA Microgreens Industry Revenue Million Forecast, by Consumption Analysis 2019 & 2032
- Table 25: Global USA Microgreens Industry Revenue Million Forecast, by Import Market Analysis (Value & Volume) 2019 & 2032
- Table 26: Global USA Microgreens Industry Revenue Million Forecast, by Export Market Analysis (Value & Volume) 2019 & 2032
- Table 27: Global USA Microgreens Industry Revenue Million Forecast, by Price Trend Analysis 2019 & 2032
- Table 28: Global USA Microgreens Industry Revenue Million Forecast, by Country 2019 & 2032
- Table 29: Brazil USA Microgreens Industry Revenue (Million) Forecast, by Application 2019 & 2032
- Table 30: Argentina USA Microgreens Industry Revenue (Million) Forecast, by Application 2019 & 2032
- Table 31: Rest of South America USA Microgreens Industry Revenue (Million) Forecast, by Application 2019 & 2032
- Table 32: Global USA Microgreens Industry Revenue Million Forecast, by Production Analysis 2019 & 2032
- Table 33: Global USA Microgreens Industry Revenue Million Forecast, by Consumption Analysis 2019 & 2032
- Table 34: Global USA Microgreens Industry Revenue Million Forecast, by Import Market Analysis (Value & Volume) 2019 & 2032
- Table 35: Global USA Microgreens Industry Revenue Million Forecast, by Export Market Analysis (Value & Volume) 2019 & 2032
- Table 36: Global USA Microgreens Industry Revenue Million Forecast, by Price Trend Analysis 2019 & 2032
- Table 37: Global USA Microgreens Industry Revenue Million Forecast, by Country 2019 & 2032
- Table 38: United Kingdom USA Microgreens Industry Revenue (Million) Forecast, by Application 2019 & 2032
- Table 39: Germany USA Microgreens Industry Revenue (Million) Forecast, by Application 2019 & 2032
- Table 40: France USA Microgreens Industry Revenue (Million) Forecast, by Application 2019 & 2032
- Table 41: Italy USA Microgreens Industry Revenue (Million) Forecast, by Application 2019 & 2032
- Table 42: Spain USA Microgreens Industry Revenue (Million) Forecast, by Application 2019 & 2032
- Table 43: Russia USA Microgreens Industry Revenue (Million) Forecast, by Application 2019 & 2032
- Table 44: Benelux USA Microgreens Industry Revenue (Million) Forecast, by Application 2019 & 2032
- Table 45: Nordics USA Microgreens Industry Revenue (Million) Forecast, by Application 2019 & 2032
- Table 46: Rest of Europe USA Microgreens Industry Revenue (Million) Forecast, by Application 2019 & 2032
- Table 47: Global USA Microgreens Industry Revenue Million Forecast, by Production Analysis 2019 & 2032
- Table 48: Global USA Microgreens Industry Revenue Million Forecast, by Consumption Analysis 2019 & 2032
- Table 49: Global USA Microgreens Industry Revenue Million Forecast, by Import Market Analysis (Value & Volume) 2019 & 2032
- Table 50: Global USA Microgreens Industry Revenue Million Forecast, by Export Market Analysis (Value & Volume) 2019 & 2032
- Table 51: Global USA Microgreens Industry Revenue Million Forecast, by Price Trend Analysis 2019 & 2032
- Table 52: Global USA Microgreens Industry Revenue Million Forecast, by Country 2019 & 2032
- Table 53: Turkey USA Microgreens Industry Revenue (Million) Forecast, by Application 2019 & 2032
- Table 54: Israel USA Microgreens Industry Revenue (Million) Forecast, by Application 2019 & 2032
- Table 55: GCC USA Microgreens Industry Revenue (Million) Forecast, by Application 2019 & 2032
- Table 56: North Africa USA Microgreens Industry Revenue (Million) Forecast, by Application 2019 & 2032
- Table 57: South Africa USA Microgreens Industry Revenue (Million) Forecast, by Application 2019 & 2032
- Table 58: Rest of Middle East & Africa USA Microgreens Industry Revenue (Million) Forecast, by Application 2019 & 2032
- Table 59: Global USA Microgreens Industry Revenue Million Forecast, by Production Analysis 2019 & 2032
- Table 60: Global USA Microgreens Industry Revenue Million Forecast, by Consumption Analysis 2019 & 2032
- Table 61: Global USA Microgreens Industry Revenue Million Forecast, by Import Market Analysis (Value & Volume) 2019 & 2032
- Table 62: Global USA Microgreens Industry Revenue Million Forecast, by Export Market Analysis (Value & Volume) 2019 & 2032
- Table 63: Global USA Microgreens Industry Revenue Million Forecast, by Price Trend Analysis 2019 & 2032
- Table 64: Global USA Microgreens Industry Revenue Million Forecast, by Country 2019 & 2032
- Table 65: China USA Microgreens Industry Revenue (Million) Forecast, by Application 2019 & 2032
- Table 66: India USA Microgreens Industry Revenue (Million) Forecast, by Application 2019 & 2032
- Table 67: Japan USA Microgreens Industry Revenue (Million) Forecast, by Application 2019 & 2032
- Table 68: South Korea USA Microgreens Industry Revenue (Million) Forecast, by Application 2019 & 2032
- Table 69: ASEAN USA Microgreens Industry Revenue (Million) Forecast, by Application 2019 & 2032
- Table 70: Oceania USA Microgreens Industry Revenue (Million) Forecast, by Application 2019 & 2032
- Table 71: Rest of Asia Pacific USA Microgreens Industry Revenue (Million) Forecast, by Application 2019 & 2032
Frequently Asked Questions
1. What is the projected Compound Annual Growth Rate (CAGR) of the USA Microgreens Industry?
The projected CAGR is approximately 10.60%.
2. Which companies are prominent players in the USA Microgreens Industry?
Key companies in the market include The Chef's Garden Inc, Quantum Microgreens, Metro Microgreens, Long Island Microgreens LL, Emerald Gardens, Fresh Origins, Florida Microgreens, Farmbox Greens LLC, Arizona Microgreens LLC, AeroFarms LLC.
3. What are the main segments of the USA Microgreens Industry?
The market segments include Production Analysis, Consumption Analysis, Import Market Analysis (Value & Volume), Export Market Analysis (Value & Volume), Price Trend Analysis.
4. Can you provide details about the market size?
The market size is estimated to be USD 1.74 Million as of 2022.
5. What are some drivers contributing to market growth?
Need for Custom Product Development; Use of CROs for Regulatory Services.
6. What are the notable trends driving market growth?
Increased Investments in Vertical Farming Domain.
7. Are there any restraints impacting market growth?
Data and Cyber Security Concerns; Lack of Experts and Professionals in this Industry.
8. Can you provide examples of recent developments in the market?
September 2022: To meet increased customer demand, AeroFarmsDanville VA established the world's largest Aeroponic Smart Farm with the newest Indoor Vertical Farm capable of growing over 3 million lb of fresh leafy greens annually.
9. What pricing options are available for accessing the report?
Pricing options include single-user, multi-user, and enterprise licenses priced at USD 3800, USD 4500, and USD 5800 respectively.
10. Is the market size provided in terms of value or volume?
The market size is provided in terms of value, measured in Million.
11. Are there any specific market keywords associated with the report?
Yes, the market keyword associated with the report is "USA Microgreens Industry," which aids in identifying and referencing the specific market segment covered.
12. How do I determine which pricing option suits my needs best?
The pricing options vary based on user requirements and access needs. Individual users may opt for single-user licenses, while businesses requiring broader access may choose multi-user or enterprise licenses for cost-effective access to the report.
13. Are there any additional resources or data provided in the USA Microgreens Industry report?
While the report offers comprehensive insights, it's advisable to review the specific contents or supplementary materials provided to ascertain if additional resources or data are available.
14. How can I stay updated on further developments or reports in the USA Microgreens Industry?
To stay informed about further developments, trends, and reports in the USA Microgreens Industry, consider subscribing to industry newsletters, following relevant companies and organizations, or regularly checking reputable industry news sources and publications.
Methodology
Step 1 - Identification of Relevant Samples Size from Population Database


Step 2 - Approaches for Defining Global Market Size (Value, Volume* & Price*)

Note*: In applicable scenarios
Step 3 - Data Sources
Primary Research
- Web Analytics
- Survey Reports
- Research Institute
- Latest Research Reports
- Opinion Leaders
Secondary Research
- Annual Reports
- White Paper
- Latest Press Release
- Industry Association
- Paid Database
- Investor Presentations

Step 4 - Data Triangulation
Involves using different sources of information in order to increase the validity of a study
These sources are likely to be stakeholders in a program - participants, other researchers, program staff, other community members, and so on.
Then we put all data in single framework & apply various statistical tools to find out the dynamic on the market.
During the analysis stage, feedback from the stakeholder groups would be compared to determine areas of agreement as well as areas of divergence


