

Key Insights
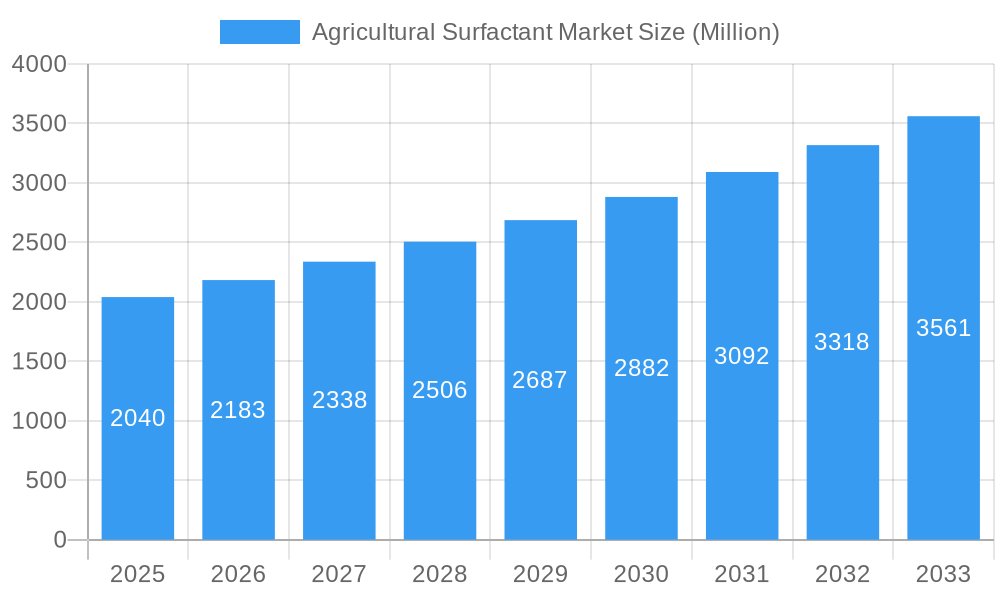
The global agricultural surfactant market, valued at $2.04 billion in 2025, is projected to experience robust growth, driven by a Compound Annual Growth Rate (CAGR) of 6.70% from 2025 to 2033. This expansion is fueled by several key factors. The increasing demand for high-yielding crops, coupled with the growing adoption of precision agriculture techniques, necessitates the use of efficient crop protection and nutrient delivery systems. Agricultural surfactants play a crucial role in enhancing the efficacy of pesticides, herbicides, and fertilizers, making them indispensable tools for modern farming practices. Furthermore, the rising awareness of sustainable agriculture and the increasing demand for bio-based surfactants are driving innovation and market expansion within the sector. The market is segmented by type (anionic, nonionic, cationic, amphoteric), application (insecticide, herbicide, fungicide, other applications), substrate (synthetic, bio-based), and crop application (crop-based, non-crop-based). The strong presence of major players like BASF, Clariant, and Solvay, along with numerous regional players, indicates a competitive yet dynamic market landscape. Regional variations exist, with North America and Europe currently holding significant market share, although the Asia-Pacific region is anticipated to witness substantial growth in the coming years, driven by expanding agricultural activities and increasing adoption of advanced agricultural technologies.
Agricultural Surfactant Market Market Size (In Billion)
The market's growth trajectory is influenced by several factors. Rising concerns about environmental sustainability are pushing the development and adoption of bio-based surfactants, presenting significant opportunities for market players. However, stringent regulations concerning the use of certain chemicals and fluctuating raw material prices pose potential challenges. The market's future trajectory is likely to be shaped by technological advancements, focusing on the development of more efficient and environmentally friendly surfactants, alongside the growing adoption of integrated pest management (IPM) strategies, which often incorporate surfactant-based formulations. The ongoing research and development efforts in this field, coupled with the increasing investments in precision agriculture, are poised to further propel the market's growth throughout the forecast period.
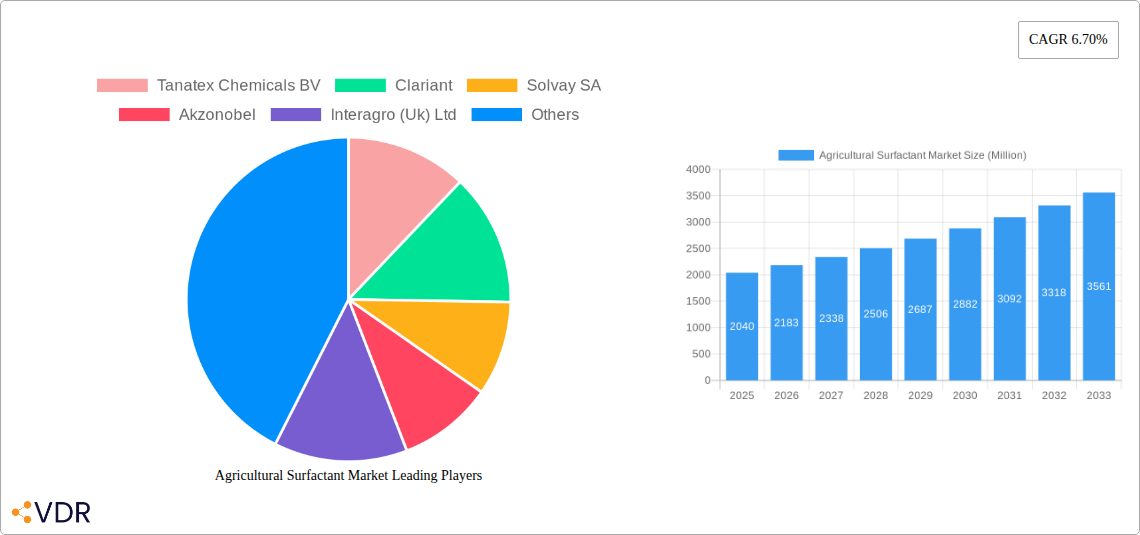
Agricultural Surfactant Market Company Market Share
Agricultural Surfactant Market: A Comprehensive Report (2019-2033)
This comprehensive report provides an in-depth analysis of the Agricultural Surfactant Market, encompassing market dynamics, growth trends, regional dominance, product landscape, key players, and future outlook. The study period spans from 2019 to 2033, with 2025 serving as the base and estimated year. The report segments the market by type (Anionic, Nonionic, Cationic, Amphoteric), application (Insecticide, Herbicide, Fungicide, Other Applications), substrate (Synthetic, Bio-based), crop application (Crop-based, Non-crop-based – Fruits and Vegetables), and key players including Tanatex Chemicals BV, Clariant, Solvay SA, and more. The market is projected to reach xx Million units by 2033, exhibiting a CAGR of xx% during the forecast period (2025-2033).
Agricultural Surfactant Market Dynamics & Structure
The Agricultural Surfactant Market is characterized by moderate concentration, with several multinational companies holding significant market share. Technological innovation, particularly in bio-based surfactants, is a key driver, while stringent regulatory frameworks concerning environmental impact and human health pose challenges. The market witnesses competitive pressure from alternative products focusing on efficacy and sustainability. End-user demographics, predominantly farmers and agricultural businesses, influence market demand. M&A activity in recent years has focused on expanding product portfolios and geographical reach. Market share for the top 5 players is estimated at xx%, indicating a somewhat fragmented but consolidated industry.
- Market Concentration: Moderate, with a few dominant players.
- Technological Innovation: Bio-based surfactants are gaining traction, driven by sustainability concerns.
- Regulatory Landscape: Stringent regulations impact product development and market entry.
- Competitive Substitutes: Alternative formulations are challenging traditional surfactants.
- M&A Activity: Consolidation through acquisitions to expand market reach and product offerings. An estimated xx M&A deals occurred between 2019 and 2024.
Agricultural Surfactant Market Growth Trends & Insights
The Agricultural Surfactant Market has exhibited steady growth over the historical period (2019-2024), driven by the increasing adoption of crop protection chemicals and rising global food demand. Technological advancements such as the development of more efficient and environmentally friendly surfactants have further propelled market expansion. Shifts in consumer preferences towards sustainable agricultural practices have stimulated demand for bio-based alternatives. The market is anticipated to maintain a robust growth trajectory during the forecast period (2025-2033), fueled by factors such as increasing agricultural activities and the growing adoption of precision farming techniques. The market size is projected to reach xx Million units by 2033. Market penetration for bio-based surfactants is expected to increase from xx% in 2025 to xx% by 2033.
Dominant Regions, Countries, or Segments in Agricultural Surfactant Market
North America and Europe currently dominate the Agricultural Surfactant Market, driven by high agricultural output and established agricultural practices. However, Asia-Pacific is projected to witness the fastest growth rate, propelled by the expansion of agricultural activities and increasing demand for food. Within the segments, the Nonionic type commands the largest market share, owing to its versatility and cost-effectiveness. Herbicide applications dominate in terms of volume, followed by Insecticide and Fungicide applications. Bio-based substrates are experiencing increasing adoption rates due to rising environmental concerns.
- Key Growth Drivers:
- Growing demand for food and feed.
- Expansion of agricultural land and production.
- Increasing adoption of modern agricultural practices.
- Growing demand for sustainable and environmentally friendly agricultural inputs.
- Regional Dominance: North America and Europe currently lead, followed by Asia-Pacific exhibiting high growth potential.
Agricultural Surfactant Market Product Landscape
The Agricultural Surfactant Market showcases a diverse range of products, categorized by their chemical composition and application. Innovations focus on improving efficacy, reducing environmental impact, and enhancing compatibility with various pesticides and herbicides. Recent advancements include the development of bio-based surfactants with enhanced performance characteristics. These products often feature unique selling propositions such as improved wetting and spreading properties, reduced toxicity, and enhanced biodegradability.
Key Drivers, Barriers & Challenges in Agricultural Surfactant Market
Key Drivers:
- Increasing demand for high-yield crops.
- Growing adoption of precision agriculture techniques.
- Stringent environmental regulations driving the demand for sustainable solutions.
- Technological advancements leading to the development of improved surfactant formulations.
Key Challenges & Restraints:
- Fluctuations in raw material prices.
- Stringent regulatory compliance requirements.
- Potential environmental concerns associated with certain surfactant types.
- Intense competition from established and emerging players.
Emerging Opportunities in Agricultural Surfactant Market
Emerging opportunities lie in the development of novel surfactant formulations tailored for specific crops and pest control strategies. Untapped markets in developing economies offer significant growth potential. The increasing demand for sustainable and environmentally friendly agricultural practices opens avenues for bio-based surfactant development and marketing. Furthermore, incorporating advanced technologies, such as nanotechnology, into surfactant formulations presents promising opportunities for improving efficacy and reducing environmental impact.
Growth Accelerators in the Agricultural Surfactant Market Industry
Technological breakthroughs in surfactant chemistry, coupled with strategic partnerships and collaborations between leading companies, are driving market growth. Market expansion strategies, including geographical diversification and product portfolio expansion, are playing a crucial role in capturing market share. The increasing adoption of precision agriculture techniques, focusing on optimizing the use of agricultural inputs, is boosting demand for high-performance surfactants.
Key Players Shaping the Agricultural Surfactant Market Market
- Tanatex Chemicals BV
- Clariant
- Solvay SA
- Akzonobel
- Interagro (Uk) Ltd
- Brandt Consolidated Inc
- Garrco Products Inc
- Lamberti SPA
- Kao Corporation
- Helena Chemical Company
- Air Products and Chemicals
- Nufarm Limited
- Wilbur-Ellis Company
- Huntsman
- Corteva Agriscience
- Croda International PLC
- Evonik Industries
- BASF SE
Notable Milestones in Agricultural Surfactant Market Sector
- March 2022: Dow announced a new product extension of VORASURF™ Silicone Surfactants, focusing on sustainable solutions.
- September 2021: BASF increased prices for non-ionic surfactants due to high demand.
- March 2021: BASF signed partnership agreements to expand its bio-based surfactants market position.
In-Depth Agricultural Surfactant Market Market Outlook
The Agricultural Surfactant Market is poised for significant growth in the coming years, driven by ongoing technological advancements, increasing demand for sustainable solutions, and the expansion of agricultural activities globally. Strategic partnerships, focused on research and development, will play a key role in shaping the future of the market. Opportunities exist in developing specialized surfactant formulations for emerging crops and addressing the unique needs of different agricultural regions. The market's future trajectory hinges on the successful integration of sustainable practices and technological innovations.
Agricultural Surfactant Market Segmentation
- 1. Production Analysis
- 2. Consumption Analysis
- 3. Import Market Analysis (Value & Volume)
- 4. Export Market Analysis (Value & Volume)
- 5. Price Trend Analysis
Agricultural Surfactant Market Segmentation By Geography
-
1. North America
- 1.1. United States
- 1.2. Canada
- 1.3. Mexico
-
2. South America
- 2.1. Brazil
- 2.2. Argentina
- 2.3. Rest of South America
-
3. Europe
- 3.1. United Kingdom
- 3.2. Germany
- 3.3. France
- 3.4. Italy
- 3.5. Spain
- 3.6. Russia
- 3.7. Benelux
- 3.8. Nordics
- 3.9. Rest of Europe
-
4. Middle East & Africa
- 4.1. Turkey
- 4.2. Israel
- 4.3. GCC
- 4.4. North Africa
- 4.5. South Africa
- 4.6. Rest of Middle East & Africa
-
5. Asia Pacific
- 5.1. China
- 5.2. India
- 5.3. Japan
- 5.4. South Korea
- 5.5. ASEAN
- 5.6. Oceania
- 5.7. Rest of Asia Pacific
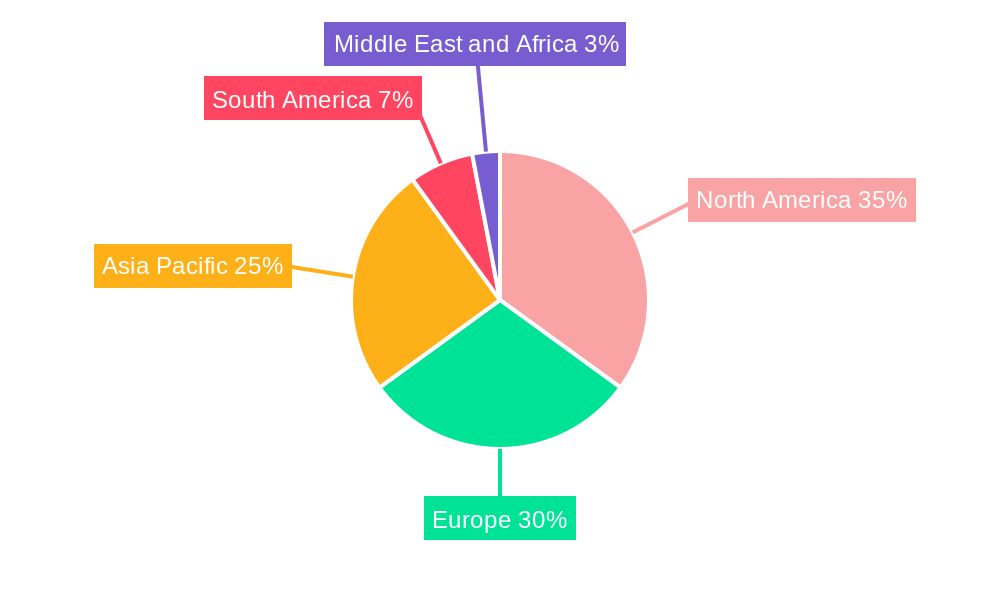
Agricultural Surfactant Market Regional Market Share
Geographic Coverage of Agricultural Surfactant Market
Agricultural Surfactant Market REPORT HIGHLIGHTS
| Aspects | Details |
|---|---|
| Study Period | 2020-2034 |
| Base Year | 2025 |
| Estimated Year | 2026 |
| Forecast Period | 2026-2034 |
| Historical Period | 2020-2025 |
| Growth Rate | CAGR of 6.70% from 2020-2034 |
| Segmentation |
|
Table of Contents
- 1. Introduction
- 1.1. Research Scope
- 1.2. Market Segmentation
- 1.3. Research Objective
- 1.4. Definitions and Assumptions
- 2. Executive Summary
- 2.1. Market Snapshot
- 3. Market Dynamics
- 3.1. Market Drivers
- 3.2. Market Restrains
- 3.3. Market Trends
- 3.4. Market Opportunities
- 4. Market Factor Analysis
- 4.1. Porters Five Forces
- 4.1.1. Bargaining Power of Suppliers
- 4.1.2. Bargaining Power of Buyers
- 4.1.3. Threat of New Entrants
- 4.1.4. Threat of Substitutes
- 4.1.5. Competitive Rivalry
- 4.2. PESTEL analysis
- 4.3. BCG Analysis
- 4.3.1. Stars (High Growth, High Market Share)
- 4.3.2. Cash Cows (Low Growth, High Market Share)
- 4.3.3. Question Mark (High Growth, Low Market Share)
- 4.3.4. Dogs (Low Growth, Low Market Share)
- 4.4. Ansoff Matrix Analysis
- 4.5. Supply Chain Analysis
- 4.6. Regulatory Landscape
- 4.7. Current Market Potential and Opportunity Assessment (TAM–SAM–SOM Framework)
- 4.8. VDR Analyst Note
- 4.1. Porters Five Forces
- 5. Market Analysis, Insights and Forecast 2021-2033
- 5.1. Market Analysis, Insights and Forecast - by Production Analysis
- 5.2. Market Analysis, Insights and Forecast - by Consumption Analysis
- 5.3. Market Analysis, Insights and Forecast - by Import Market Analysis (Value & Volume)
- 5.4. Market Analysis, Insights and Forecast - by Export Market Analysis (Value & Volume)
- 5.5. Market Analysis, Insights and Forecast - by Price Trend Analysis
- 5.6. Market Analysis, Insights and Forecast - by Region
- 5.6.1. North America
- 5.6.2. South America
- 5.6.3. Europe
- 5.6.4. Middle East & Africa
- 5.6.5. Asia Pacific
- 6. Global Agricultural Surfactant Market Analysis, Insights and Forecast, 2021-2033
- 6.1. Market Analysis, Insights and Forecast - by Production Analysis
- 6.2. Market Analysis, Insights and Forecast - by Consumption Analysis
- 6.3. Market Analysis, Insights and Forecast - by Import Market Analysis (Value & Volume)
- 6.4. Market Analysis, Insights and Forecast - by Export Market Analysis (Value & Volume)
- 6.5. Market Analysis, Insights and Forecast - by Price Trend Analysis
- 7. North America Agricultural Surfactant Market Analysis, Insights and Forecast, 2021-2033
- 7.1. Market Analysis, Insights and Forecast - by Production Analysis
- 7.2. Market Analysis, Insights and Forecast - by Consumption Analysis
- 7.3. Market Analysis, Insights and Forecast - by Import Market Analysis (Value & Volume)
- 7.4. Market Analysis, Insights and Forecast - by Export Market Analysis (Value & Volume)
- 7.5. Market Analysis, Insights and Forecast - by Price Trend Analysis
- 8. South America Agricultural Surfactant Market Analysis, Insights and Forecast, 2021-2033
- 8.1. Market Analysis, Insights and Forecast - by Production Analysis
- 8.2. Market Analysis, Insights and Forecast - by Consumption Analysis
- 8.3. Market Analysis, Insights and Forecast - by Import Market Analysis (Value & Volume)
- 8.4. Market Analysis, Insights and Forecast - by Export Market Analysis (Value & Volume)
- 8.5. Market Analysis, Insights and Forecast - by Price Trend Analysis
- 9. Europe Agricultural Surfactant Market Analysis, Insights and Forecast, 2021-2033
- 9.1. Market Analysis, Insights and Forecast - by Production Analysis
- 9.2. Market Analysis, Insights and Forecast - by Consumption Analysis
- 9.3. Market Analysis, Insights and Forecast - by Import Market Analysis (Value & Volume)
- 9.4. Market Analysis, Insights and Forecast - by Export Market Analysis (Value & Volume)
- 9.5. Market Analysis, Insights and Forecast - by Price Trend Analysis
- 10. Middle East & Africa Agricultural Surfactant Market Analysis, Insights and Forecast, 2021-2033
- 10.1. Market Analysis, Insights and Forecast - by Production Analysis
- 10.2. Market Analysis, Insights and Forecast - by Consumption Analysis
- 10.3. Market Analysis, Insights and Forecast - by Import Market Analysis (Value & Volume)
- 10.4. Market Analysis, Insights and Forecast - by Export Market Analysis (Value & Volume)
- 10.5. Market Analysis, Insights and Forecast - by Price Trend Analysis
- 11. Asia Pacific Agricultural Surfactant Market Analysis, Insights and Forecast, 2021-2033
- 11.1. Market Analysis, Insights and Forecast - by Production Analysis
- 11.2. Market Analysis, Insights and Forecast - by Consumption Analysis
- 11.3. Market Analysis, Insights and Forecast - by Import Market Analysis (Value & Volume)
- 11.4. Market Analysis, Insights and Forecast - by Export Market Analysis (Value & Volume)
- 11.5. Market Analysis, Insights and Forecast - by Price Trend Analysis
- 12. Competitive Analysis
- 12.1. Company Profiles
- 12.1.1 Tanatex Chemicals BV
- 12.1.1.1. Company Overview
- 12.1.1.2. Products
- 12.1.1.3. Company Financials
- 12.1.1.4. SWOT Analysis
- 12.1.2 Clariant
- 12.1.2.1. Company Overview
- 12.1.2.2. Products
- 12.1.2.3. Company Financials
- 12.1.2.4. SWOT Analysis
- 12.1.3 Solvay SA
- 12.1.3.1. Company Overview
- 12.1.3.2. Products
- 12.1.3.3. Company Financials
- 12.1.3.4. SWOT Analysis
- 12.1.4 Akzonobel
- 12.1.4.1. Company Overview
- 12.1.4.2. Products
- 12.1.4.3. Company Financials
- 12.1.4.4. SWOT Analysis
- 12.1.5 Interagro (Uk) Ltd
- 12.1.5.1. Company Overview
- 12.1.5.2. Products
- 12.1.5.3. Company Financials
- 12.1.5.4. SWOT Analysis
- 12.1.6 Brandt Consolidated Inc
- 12.1.6.1. Company Overview
- 12.1.6.2. Products
- 12.1.6.3. Company Financials
- 12.1.6.4. SWOT Analysis
- 12.1.7 Garrco Products Inc
- 12.1.7.1. Company Overview
- 12.1.7.2. Products
- 12.1.7.3. Company Financials
- 12.1.7.4. SWOT Analysis
- 12.1.8 Lamberti SPA
- 12.1.8.1. Company Overview
- 12.1.8.2. Products
- 12.1.8.3. Company Financials
- 12.1.8.4. SWOT Analysis
- 12.1.9 Kao Corporation
- 12.1.9.1. Company Overview
- 12.1.9.2. Products
- 12.1.9.3. Company Financials
- 12.1.9.4. SWOT Analysis
- 12.1.10 Helena Chemical Company
- 12.1.10.1. Company Overview
- 12.1.10.2. Products
- 12.1.10.3. Company Financials
- 12.1.10.4. SWOT Analysis
- 12.1.11 Air Products and Chemicals
- 12.1.11.1. Company Overview
- 12.1.11.2. Products
- 12.1.11.3. Company Financials
- 12.1.11.4. SWOT Analysis
- 12.1.12 Nufarm Limited
- 12.1.12.1. Company Overview
- 12.1.12.2. Products
- 12.1.12.3. Company Financials
- 12.1.12.4. SWOT Analysis
- 12.1.13 Wilbur-Ellis Company
- 12.1.13.1. Company Overview
- 12.1.13.2. Products
- 12.1.13.3. Company Financials
- 12.1.13.4. SWOT Analysis
- 12.1.14 Huntsman
- 12.1.14.1. Company Overview
- 12.1.14.2. Products
- 12.1.14.3. Company Financials
- 12.1.14.4. SWOT Analysis
- 12.1.15 Corteva Agriscience
- 12.1.15.1. Company Overview
- 12.1.15.2. Products
- 12.1.15.3. Company Financials
- 12.1.15.4. SWOT Analysis
- 12.1.16 Croda International PLC
- 12.1.16.1. Company Overview
- 12.1.16.2. Products
- 12.1.16.3. Company Financials
- 12.1.16.4. SWOT Analysis
- 12.1.17 Evonik Industries
- 12.1.17.1. Company Overview
- 12.1.17.2. Products
- 12.1.17.3. Company Financials
- 12.1.17.4. SWOT Analysis
- 12.1.18 BASF SE
- 12.1.18.1. Company Overview
- 12.1.18.2. Products
- 12.1.18.3. Company Financials
- 12.1.18.4. SWOT Analysis
- 12.1.1 Tanatex Chemicals BV
- 12.2. Market Entropy
- 12.2.1 Company's Key Areas Served
- 12.2.2 Recent Developments
- 12.3. Company Market Share Analysis 2025
- 12.3.1 Top 5 Companies Market Share Analysis
- 12.3.2 Top 3 Companies Market Share Analysis
- 12.4. List of Potential Customers
- 13. Research Methodology
List of Figures
- Figure 1: Global Agricultural Surfactant Market Revenue Breakdown (Million, %) by Region 2025 & 2033
- Figure 2: North America Agricultural Surfactant Market Revenue (Million), by Production Analysis 2025 & 2033
- Figure 3: North America Agricultural Surfactant Market Revenue Share (%), by Production Analysis 2025 & 2033
- Figure 4: North America Agricultural Surfactant Market Revenue (Million), by Consumption Analysis 2025 & 2033
- Figure 5: North America Agricultural Surfactant Market Revenue Share (%), by Consumption Analysis 2025 & 2033
- Figure 6: North America Agricultural Surfactant Market Revenue (Million), by Import Market Analysis (Value & Volume) 2025 & 2033
- Figure 7: North America Agricultural Surfactant Market Revenue Share (%), by Import Market Analysis (Value & Volume) 2025 & 2033
- Figure 8: North America Agricultural Surfactant Market Revenue (Million), by Export Market Analysis (Value & Volume) 2025 & 2033
- Figure 9: North America Agricultural Surfactant Market Revenue Share (%), by Export Market Analysis (Value & Volume) 2025 & 2033
- Figure 10: North America Agricultural Surfactant Market Revenue (Million), by Price Trend Analysis 2025 & 2033
- Figure 11: North America Agricultural Surfactant Market Revenue Share (%), by Price Trend Analysis 2025 & 2033
- Figure 12: North America Agricultural Surfactant Market Revenue (Million), by Country 2025 & 2033
- Figure 13: North America Agricultural Surfactant Market Revenue Share (%), by Country 2025 & 2033
- Figure 14: South America Agricultural Surfactant Market Revenue (Million), by Production Analysis 2025 & 2033
- Figure 15: South America Agricultural Surfactant Market Revenue Share (%), by Production Analysis 2025 & 2033
- Figure 16: South America Agricultural Surfactant Market Revenue (Million), by Consumption Analysis 2025 & 2033
- Figure 17: South America Agricultural Surfactant Market Revenue Share (%), by Consumption Analysis 2025 & 2033
- Figure 18: South America Agricultural Surfactant Market Revenue (Million), by Import Market Analysis (Value & Volume) 2025 & 2033
- Figure 19: South America Agricultural Surfactant Market Revenue Share (%), by Import Market Analysis (Value & Volume) 2025 & 2033
- Figure 20: South America Agricultural Surfactant Market Revenue (Million), by Export Market Analysis (Value & Volume) 2025 & 2033
- Figure 21: South America Agricultural Surfactant Market Revenue Share (%), by Export Market Analysis (Value & Volume) 2025 & 2033
- Figure 22: South America Agricultural Surfactant Market Revenue (Million), by Price Trend Analysis 2025 & 2033
- Figure 23: South America Agricultural Surfactant Market Revenue Share (%), by Price Trend Analysis 2025 & 2033
- Figure 24: South America Agricultural Surfactant Market Revenue (Million), by Country 2025 & 2033
- Figure 25: South America Agricultural Surfactant Market Revenue Share (%), by Country 2025 & 2033
- Figure 26: Europe Agricultural Surfactant Market Revenue (Million), by Production Analysis 2025 & 2033
- Figure 27: Europe Agricultural Surfactant Market Revenue Share (%), by Production Analysis 2025 & 2033
- Figure 28: Europe Agricultural Surfactant Market Revenue (Million), by Consumption Analysis 2025 & 2033
- Figure 29: Europe Agricultural Surfactant Market Revenue Share (%), by Consumption Analysis 2025 & 2033
- Figure 30: Europe Agricultural Surfactant Market Revenue (Million), by Import Market Analysis (Value & Volume) 2025 & 2033
- Figure 31: Europe Agricultural Surfactant Market Revenue Share (%), by Import Market Analysis (Value & Volume) 2025 & 2033
- Figure 32: Europe Agricultural Surfactant Market Revenue (Million), by Export Market Analysis (Value & Volume) 2025 & 2033
- Figure 33: Europe Agricultural Surfactant Market Revenue Share (%), by Export Market Analysis (Value & Volume) 2025 & 2033
- Figure 34: Europe Agricultural Surfactant Market Revenue (Million), by Price Trend Analysis 2025 & 2033
- Figure 35: Europe Agricultural Surfactant Market Revenue Share (%), by Price Trend Analysis 2025 & 2033
- Figure 36: Europe Agricultural Surfactant Market Revenue (Million), by Country 2025 & 2033
- Figure 37: Europe Agricultural Surfactant Market Revenue Share (%), by Country 2025 & 2033
- Figure 38: Middle East & Africa Agricultural Surfactant Market Revenue (Million), by Production Analysis 2025 & 2033
- Figure 39: Middle East & Africa Agricultural Surfactant Market Revenue Share (%), by Production Analysis 2025 & 2033
- Figure 40: Middle East & Africa Agricultural Surfactant Market Revenue (Million), by Consumption Analysis 2025 & 2033
- Figure 41: Middle East & Africa Agricultural Surfactant Market Revenue Share (%), by Consumption Analysis 2025 & 2033
- Figure 42: Middle East & Africa Agricultural Surfactant Market Revenue (Million), by Import Market Analysis (Value & Volume) 2025 & 2033
- Figure 43: Middle East & Africa Agricultural Surfactant Market Revenue Share (%), by Import Market Analysis (Value & Volume) 2025 & 2033
- Figure 44: Middle East & Africa Agricultural Surfactant Market Revenue (Million), by Export Market Analysis (Value & Volume) 2025 & 2033
- Figure 45: Middle East & Africa Agricultural Surfactant Market Revenue Share (%), by Export Market Analysis (Value & Volume) 2025 & 2033
- Figure 46: Middle East & Africa Agricultural Surfactant Market Revenue (Million), by Price Trend Analysis 2025 & 2033
- Figure 47: Middle East & Africa Agricultural Surfactant Market Revenue Share (%), by Price Trend Analysis 2025 & 2033
- Figure 48: Middle East & Africa Agricultural Surfactant Market Revenue (Million), by Country 2025 & 2033
- Figure 49: Middle East & Africa Agricultural Surfactant Market Revenue Share (%), by Country 2025 & 2033
- Figure 50: Asia Pacific Agricultural Surfactant Market Revenue (Million), by Production Analysis 2025 & 2033
- Figure 51: Asia Pacific Agricultural Surfactant Market Revenue Share (%), by Production Analysis 2025 & 2033
- Figure 52: Asia Pacific Agricultural Surfactant Market Revenue (Million), by Consumption Analysis 2025 & 2033
- Figure 53: Asia Pacific Agricultural Surfactant Market Revenue Share (%), by Consumption Analysis 2025 & 2033
- Figure 54: Asia Pacific Agricultural Surfactant Market Revenue (Million), by Import Market Analysis (Value & Volume) 2025 & 2033
- Figure 55: Asia Pacific Agricultural Surfactant Market Revenue Share (%), by Import Market Analysis (Value & Volume) 2025 & 2033
- Figure 56: Asia Pacific Agricultural Surfactant Market Revenue (Million), by Export Market Analysis (Value & Volume) 2025 & 2033
- Figure 57: Asia Pacific Agricultural Surfactant Market Revenue Share (%), by Export Market Analysis (Value & Volume) 2025 & 2033
- Figure 58: Asia Pacific Agricultural Surfactant Market Revenue (Million), by Price Trend Analysis 2025 & 2033
- Figure 59: Asia Pacific Agricultural Surfactant Market Revenue Share (%), by Price Trend Analysis 2025 & 2033
- Figure 60: Asia Pacific Agricultural Surfactant Market Revenue (Million), by Country 2025 & 2033
- Figure 61: Asia Pacific Agricultural Surfactant Market Revenue Share (%), by Country 2025 & 2033
List of Tables
- Table 1: Global Agricultural Surfactant Market Revenue Million Forecast, by Production Analysis 2020 & 2033
- Table 2: Global Agricultural Surfactant Market Revenue Million Forecast, by Consumption Analysis 2020 & 2033
- Table 3: Global Agricultural Surfactant Market Revenue Million Forecast, by Import Market Analysis (Value & Volume) 2020 & 2033
- Table 4: Global Agricultural Surfactant Market Revenue Million Forecast, by Export Market Analysis (Value & Volume) 2020 & 2033
- Table 5: Global Agricultural Surfactant Market Revenue Million Forecast, by Price Trend Analysis 2020 & 2033
- Table 6: Global Agricultural Surfactant Market Revenue Million Forecast, by Region 2020 & 2033
- Table 7: Global Agricultural Surfactant Market Revenue Million Forecast, by Production Analysis 2020 & 2033
- Table 8: Global Agricultural Surfactant Market Revenue Million Forecast, by Consumption Analysis 2020 & 2033
- Table 9: Global Agricultural Surfactant Market Revenue Million Forecast, by Import Market Analysis (Value & Volume) 2020 & 2033
- Table 10: Global Agricultural Surfactant Market Revenue Million Forecast, by Export Market Analysis (Value & Volume) 2020 & 2033
- Table 11: Global Agricultural Surfactant Market Revenue Million Forecast, by Price Trend Analysis 2020 & 2033
- Table 12: Global Agricultural Surfactant Market Revenue Million Forecast, by Country 2020 & 2033
- Table 13: United States Agricultural Surfactant Market Revenue (Million) Forecast, by Application 2020 & 2033
- Table 14: Canada Agricultural Surfactant Market Revenue (Million) Forecast, by Application 2020 & 2033
- Table 15: Mexico Agricultural Surfactant Market Revenue (Million) Forecast, by Application 2020 & 2033
- Table 16: Global Agricultural Surfactant Market Revenue Million Forecast, by Production Analysis 2020 & 2033
- Table 17: Global Agricultural Surfactant Market Revenue Million Forecast, by Consumption Analysis 2020 & 2033
- Table 18: Global Agricultural Surfactant Market Revenue Million Forecast, by Import Market Analysis (Value & Volume) 2020 & 2033
- Table 19: Global Agricultural Surfactant Market Revenue Million Forecast, by Export Market Analysis (Value & Volume) 2020 & 2033
- Table 20: Global Agricultural Surfactant Market Revenue Million Forecast, by Price Trend Analysis 2020 & 2033
- Table 21: Global Agricultural Surfactant Market Revenue Million Forecast, by Country 2020 & 2033
- Table 22: Brazil Agricultural Surfactant Market Revenue (Million) Forecast, by Application 2020 & 2033
- Table 23: Argentina Agricultural Surfactant Market Revenue (Million) Forecast, by Application 2020 & 2033
- Table 24: Rest of South America Agricultural Surfactant Market Revenue (Million) Forecast, by Application 2020 & 2033
- Table 25: Global Agricultural Surfactant Market Revenue Million Forecast, by Production Analysis 2020 & 2033
- Table 26: Global Agricultural Surfactant Market Revenue Million Forecast, by Consumption Analysis 2020 & 2033
- Table 27: Global Agricultural Surfactant Market Revenue Million Forecast, by Import Market Analysis (Value & Volume) 2020 & 2033
- Table 28: Global Agricultural Surfactant Market Revenue Million Forecast, by Export Market Analysis (Value & Volume) 2020 & 2033
- Table 29: Global Agricultural Surfactant Market Revenue Million Forecast, by Price Trend Analysis 2020 & 2033
- Table 30: Global Agricultural Surfactant Market Revenue Million Forecast, by Country 2020 & 2033
- Table 31: United Kingdom Agricultural Surfactant Market Revenue (Million) Forecast, by Application 2020 & 2033
- Table 32: Germany Agricultural Surfactant Market Revenue (Million) Forecast, by Application 2020 & 2033
- Table 33: France Agricultural Surfactant Market Revenue (Million) Forecast, by Application 2020 & 2033
- Table 34: Italy Agricultural Surfactant Market Revenue (Million) Forecast, by Application 2020 & 2033
- Table 35: Spain Agricultural Surfactant Market Revenue (Million) Forecast, by Application 2020 & 2033
- Table 36: Russia Agricultural Surfactant Market Revenue (Million) Forecast, by Application 2020 & 2033
- Table 37: Benelux Agricultural Surfactant Market Revenue (Million) Forecast, by Application 2020 & 2033
- Table 38: Nordics Agricultural Surfactant Market Revenue (Million) Forecast, by Application 2020 & 2033
- Table 39: Rest of Europe Agricultural Surfactant Market Revenue (Million) Forecast, by Application 2020 & 2033
- Table 40: Global Agricultural Surfactant Market Revenue Million Forecast, by Production Analysis 2020 & 2033
- Table 41: Global Agricultural Surfactant Market Revenue Million Forecast, by Consumption Analysis 2020 & 2033
- Table 42: Global Agricultural Surfactant Market Revenue Million Forecast, by Import Market Analysis (Value & Volume) 2020 & 2033
- Table 43: Global Agricultural Surfactant Market Revenue Million Forecast, by Export Market Analysis (Value & Volume) 2020 & 2033
- Table 44: Global Agricultural Surfactant Market Revenue Million Forecast, by Price Trend Analysis 2020 & 2033
- Table 45: Global Agricultural Surfactant Market Revenue Million Forecast, by Country 2020 & 2033
- Table 46: Turkey Agricultural Surfactant Market Revenue (Million) Forecast, by Application 2020 & 2033
- Table 47: Israel Agricultural Surfactant Market Revenue (Million) Forecast, by Application 2020 & 2033
- Table 48: GCC Agricultural Surfactant Market Revenue (Million) Forecast, by Application 2020 & 2033
- Table 49: North Africa Agricultural Surfactant Market Revenue (Million) Forecast, by Application 2020 & 2033
- Table 50: South Africa Agricultural Surfactant Market Revenue (Million) Forecast, by Application 2020 & 2033
- Table 51: Rest of Middle East & Africa Agricultural Surfactant Market Revenue (Million) Forecast, by Application 2020 & 2033
- Table 52: Global Agricultural Surfactant Market Revenue Million Forecast, by Production Analysis 2020 & 2033
- Table 53: Global Agricultural Surfactant Market Revenue Million Forecast, by Consumption Analysis 2020 & 2033
- Table 54: Global Agricultural Surfactant Market Revenue Million Forecast, by Import Market Analysis (Value & Volume) 2020 & 2033
- Table 55: Global Agricultural Surfactant Market Revenue Million Forecast, by Export Market Analysis (Value & Volume) 2020 & 2033
- Table 56: Global Agricultural Surfactant Market Revenue Million Forecast, by Price Trend Analysis 2020 & 2033
- Table 57: Global Agricultural Surfactant Market Revenue Million Forecast, by Country 2020 & 2033
- Table 58: China Agricultural Surfactant Market Revenue (Million) Forecast, by Application 2020 & 2033
- Table 59: India Agricultural Surfactant Market Revenue (Million) Forecast, by Application 2020 & 2033
- Table 60: Japan Agricultural Surfactant Market Revenue (Million) Forecast, by Application 2020 & 2033
- Table 61: South Korea Agricultural Surfactant Market Revenue (Million) Forecast, by Application 2020 & 2033
- Table 62: ASEAN Agricultural Surfactant Market Revenue (Million) Forecast, by Application 2020 & 2033
- Table 63: Oceania Agricultural Surfactant Market Revenue (Million) Forecast, by Application 2020 & 2033
- Table 64: Rest of Asia Pacific Agricultural Surfactant Market Revenue (Million) Forecast, by Application 2020 & 2033
Frequently Asked Questions
1. What is the projected Compound Annual Growth Rate (CAGR) of the Agricultural Surfactant Market?
The projected CAGR is approximately 6.70%.
2. Which companies are prominent players in the Agricultural Surfactant Market?
Key companies in the market include Tanatex Chemicals BV, Clariant, Solvay SA, Akzonobel, Interagro (Uk) Ltd, Brandt Consolidated Inc, Garrco Products Inc, Lamberti SPA, Kao Corporation, Helena Chemical Company, Air Products and Chemicals, Nufarm Limited, Wilbur-Ellis Company, Huntsman, Corteva Agriscience, Croda International PLC, Evonik Industries, BASF SE.
3. What are the main segments of the Agricultural Surfactant Market?
The market segments include Production Analysis, Consumption Analysis, Import Market Analysis (Value & Volume), Export Market Analysis (Value & Volume), Price Trend Analysis.
4. Can you provide details about the market size?
The market size is estimated to be USD 2.04 Million as of 2022.
5. What are some drivers contributing to market growth?
Shortage of Skilled Labor; Government Support to Enhance Farm Mechanization.
6. What are the notable trends driving market growth?
Rising Demand for Food and Shrinking Land Driving the Market.
7. Are there any restraints impacting market growth?
Heavy Initial Procurement Cost and High Expenditure on Maintenance.
8. Can you provide examples of recent developments in the market?
March 2022 - Dow announced a new product extension of VORASURF™ Silicone Surfactants to support the growing demand for enhanced energy efficiency and sustainable solutions in the rigid polyurethane foam market, with a specific focus on spray and construction applications.
9. What pricing options are available for accessing the report?
Pricing options include single-user, multi-user, and enterprise licenses priced at USD 4750, USD 5250, and USD 8750 respectively.
10. Is the market size provided in terms of value or volume?
The market size is provided in terms of value, measured in Million.
11. Are there any specific market keywords associated with the report?
Yes, the market keyword associated with the report is "Agricultural Surfactant Market," which aids in identifying and referencing the specific market segment covered.
12. How do I determine which pricing option suits my needs best?
The pricing options vary based on user requirements and access needs. Individual users may opt for single-user licenses, while businesses requiring broader access may choose multi-user or enterprise licenses for cost-effective access to the report.
13. Are there any additional resources or data provided in the Agricultural Surfactant Market report?
While the report offers comprehensive insights, it's advisable to review the specific contents or supplementary materials provided to ascertain if additional resources or data are available.
14. How can I stay updated on further developments or reports in the Agricultural Surfactant Market?
To stay informed about further developments, trends, and reports in the Agricultural Surfactant Market, consider subscribing to industry newsletters, following relevant companies and organizations, or regularly checking reputable industry news sources and publications.
Methodology
Step 1 - Identification of Relevant Samples Size from Population Database


Step 2 - Approaches for Defining Global Market Size (Value, Volume* & Price*)

Note*: In applicable scenarios
Step 3 - Data Sources
Primary Research
- Web Analytics
- Survey Reports
- Research Institute
- Latest Research Reports
- Opinion Leaders
Secondary Research
- Annual Reports
- White Paper
- Latest Press Release
- Industry Association
- Paid Database
- Investor Presentations

Step 4 - Data Triangulation
Involves using different sources of information in order to increase the validity of a study
These sources are likely to be stakeholders in a program - participants, other researchers, program staff, other community members, and so on.
Then we put all data in single framework & apply various statistical tools to find out the dynamic on the market.
During the analysis stage, feedback from the stakeholder groups would be compared to determine areas of agreement as well as areas of divergence