
Key Insights
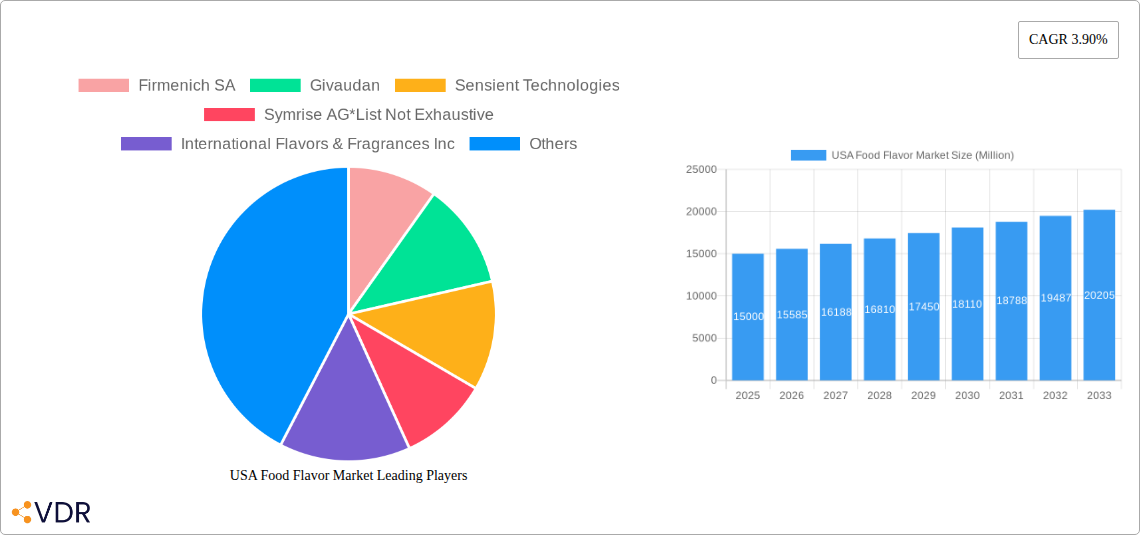
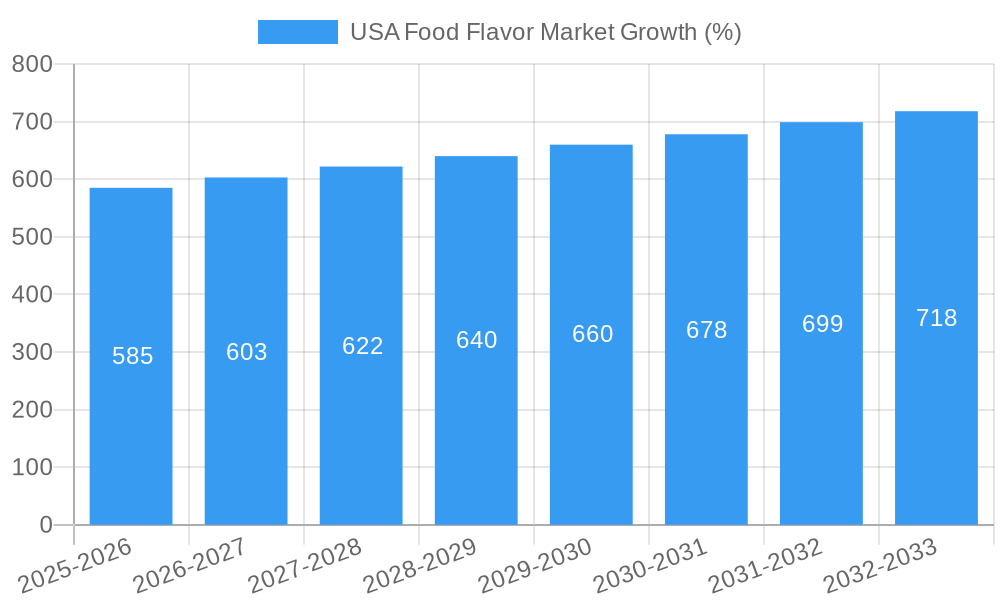
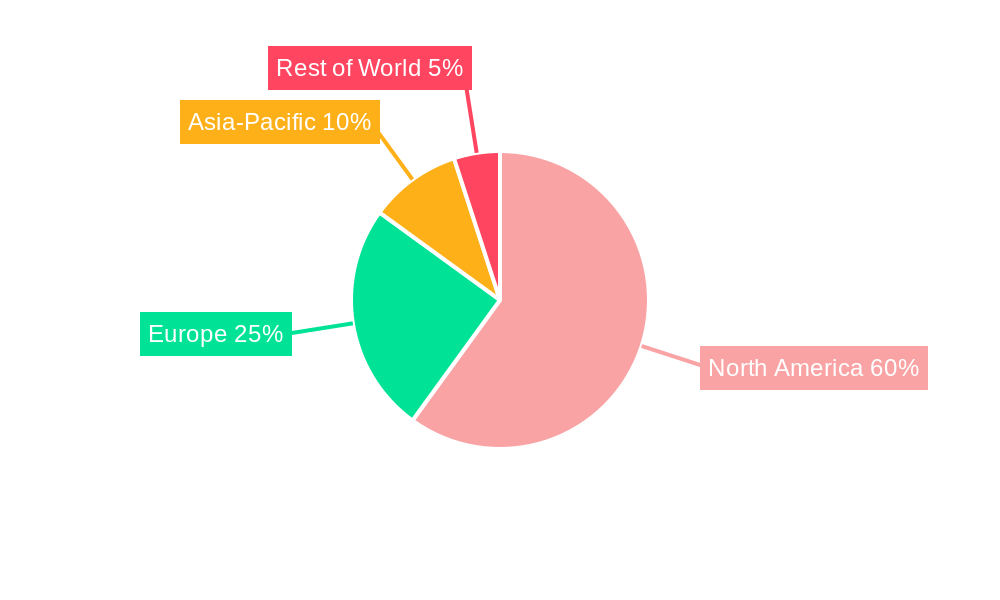
The US food flavor market, a significant segment of the global food and beverage industry, is experiencing steady growth, projected to maintain a Compound Annual Growth Rate (CAGR) of approximately 3.90% from 2025 to 2033. This growth is fueled by several key drivers. The increasing demand for convenient and ready-to-eat meals is driving the adoption of flavors to enhance taste and appeal. Health-conscious consumers are also influencing market trends, with a rising demand for natural and clean-label flavors. Innovation in flavor profiles, catering to diverse palates and global culinary influences, is another significant factor. The market segmentation reveals the dominance of natural flavors, reflecting the overall shift towards healthier food choices. Applications across various food categories, including dairy, bakery, confectionery, and beverages, contribute to the market's robust size. Major players like Firmenich SA, Givaudan, and International Flavors & Fragrances Inc. are actively shaping the market through product development and strategic partnerships. Competition is fierce, with companies constantly innovating to meet evolving consumer preferences and regulatory requirements. The North American region, particularly the United States, holds a substantial market share due to its large and diverse food and beverage industry.
While the market enjoys positive growth, certain restraints exist. Fluctuations in raw material prices can impact profitability. Stringent regulatory frameworks concerning food additives and labeling requirements necessitate continuous adaptation and compliance. However, the ongoing trend toward premiumization and the increasing demand for customized flavor solutions are expected to offset these challenges. The market's future growth is likely to be shaped by further innovation in flavor technology, a greater focus on sustainability, and the increasing adoption of flavor solutions in emerging food categories, such as plant-based and functional foods. Overall, the US food flavor market presents attractive opportunities for established players and new entrants alike, given the consistent growth potential and the ever-evolving dynamics of consumer preferences.
USA Food Flavor Market: A Comprehensive Report (2019-2033)
This comprehensive report provides an in-depth analysis of the USA food flavor market, covering market dynamics, growth trends, dominant segments, key players, and future outlook. The study period spans from 2019 to 2033, with 2025 as the base and estimated year. This report is essential for industry professionals, investors, and anyone seeking a detailed understanding of this dynamic market projected to reach xx Million units by 2033.
Keywords: USA Food Flavor Market, Natural Flavor, Synthetic Flavor, Nature Identical Flavoring, Dairy Flavor, Bakery Flavor, Confectionery Flavor, Beverage Flavor, Meat Flavor, Firmenich, Givaudan, Sensient Technologies, Symrise, IFF, ADM, Flavorchem, Market Size, Market Share, Market Growth, CAGR, Market Analysis, Market Trends, Market Forecast.
USA Food Flavor Market Market Dynamics & Structure
The USA food flavor market is characterized by a moderately concentrated structure, with key players like Firmenich SA, Givaudan, Sensient Technologies, Symrise AG, International Flavors & Fragrances Inc, Archer Daniels Midland Company, and Flavorchem Corporation holding significant market share. Technological innovation, particularly in natural and clean-label flavor development, is a key driver. Stringent regulatory frameworks concerning food safety and labeling influence product formulations and market access. The market also witnesses competitive pressures from product substitutes, such as natural sweeteners and extracts. End-user demographics, with a growing preference for healthier and convenient food options, significantly impact flavor demand. The market experiences moderate M&A activity, with xx deals recorded between 2019 and 2024, representing a xx% increase compared to the previous period.
- Market Concentration: Moderately concentrated, with top 5 players holding approximately xx% market share in 2024.
- Technological Innovation: Focus on natural, organic, and clean-label flavors; increasing adoption of biotechnology and precision fermentation.
- Regulatory Framework: Stringent FDA regulations on food additives and labeling influence product development and market entry.
- Competitive Substitutes: Increased competition from natural sweeteners and other flavoring agents.
- End-user Demographics: Shifting consumer preferences toward healthier, natural, and functional foods drive demand for specific flavors.
- M&A Trends: xx M&A deals between 2019-2024, indicating consolidation and expansion strategies within the market.
USA Food Flavor Market Growth Trends & Insights
The USA food flavor market experienced significant growth between 2019 and 2024, with a CAGR of xx%. This growth is attributed to several factors, including the increasing demand for processed foods, the rising popularity of convenient and ready-to-eat meals, and the growing consumer preference for diverse and flavorful food experiences. Technological advancements, such as the development of more sophisticated flavor compounds and improved extraction techniques, have further fueled market expansion. The market witnessed a shift towards natural and clean-label flavors, driven by increasing consumer awareness of health and sustainability. Market penetration of natural flavors reached xx% in 2024, while synthetic flavors maintain xx% market share. This trend is expected to continue, resulting in a projected CAGR of xx% during the forecast period (2025-2033), reaching an estimated market value of xx Million units by 2033. Consumer behavior shifts, including increased consumption of snacks and beverages, contribute to this growth.
Dominant Regions, Countries, or Segments in USA Food Flavor Market
The Beverage segment dominates the USA food flavor market, holding the largest market share in 2024 at approximately xx%, followed by the Confectionery and Dairy segments. The growth in this segment is fueled by rising beverage consumption and the constant innovation in flavor profiles to cater to changing consumer preferences. Within product types, Natural Flavors are exhibiting the fastest growth, driven by the rising demand for clean-label products and increased health consciousness among consumers. Geographically, the Western region of the USA displays robust growth due to its higher concentration of food processing industries and a larger population base.
- Key Drivers (Beverage Segment): Increasing demand for ready-to-drink beverages, expanding beverage options, and the development of novel flavor profiles.
- Key Drivers (Natural Flavors): Growing consumer preference for natural and clean-label products; increased health and wellness awareness.
- Geographic Dominance: The Western region of the US leads in market share due to a high concentration of food processing and manufacturing facilities.
USA Food Flavor Market Product Landscape
The market showcases significant innovation in flavor profiles and delivery systems. Companies are developing customized flavor solutions tailored to specific food applications, catering to diverse consumer preferences, including regional and ethnic cuisines. Advances in flavor encapsulation technologies are improving flavor stability and delivery in various food matrices. Natural and sustainable flavor extraction methods are gaining traction, contributing to the growing demand for clean-label products. Unique selling propositions include customized blends, improved flavor stability, and cost-effective production techniques.
Key Drivers, Barriers & Challenges in USA Food Flavor Market
Key Drivers: The increasing demand for processed foods, the rising popularity of convenient and ready-to-eat meals, and the growing consumer preference for diverse and flavorful food experiences. Technological advancements in flavor creation and improved extraction methods are also significant drivers. Government initiatives to promote food innovation and safety standards contribute positively to market growth.
Challenges and Restraints: Fluctuations in raw material prices, strict regulatory compliance requirements, and intense competition among established players pose significant challenges. Supply chain disruptions and the need to adhere to stringent food safety regulations could negatively affect market growth. The increasing cost of natural ingredients can put pressure on profitability.
Emerging Opportunities in USA Food Flavor Market
Emerging opportunities include the growing demand for functional foods and beverages with added health benefits, the rise of plant-based food products requiring specialized flavoring, and the increasing interest in personalized nutrition. The development of sustainable and eco-friendly flavoring solutions will also open new market avenues. Expansion into niche markets, such as ethnic foods and artisanal products, offers significant potential for growth.
Growth Accelerators in the USA Food Flavor Market Industry
Technological advancements in flavor extraction, encapsulation, and characterization will continue to accelerate market growth. Strategic partnerships and collaborations between flavor manufacturers and food companies will facilitate innovation and market expansion. The development of novel flavor profiles that cater to specific dietary needs and consumer preferences (e.g., reduced sugar, clean label) will drive demand. Expanding into international markets and entering into strategic alliances with global players will further propel growth.
Key Players Shaping the USA Food Flavor Market Market
- Firmenich SA
- Givaudan
- Sensient Technologies
- Symrise AG
- International Flavors & Fragrances Inc
- Archer Daniels Midland Company
- Flavorchem Corporation
Notable Milestones in USA Food Flavor Market Sector
- 2020: Increased focus on clean-label initiatives across various product categories.
- 2021: Several key players invested significantly in R&D for natural flavor extraction technologies.
- 2022: A major merger between two flavor companies reshaped market dynamics.
- 2023: Launch of several novel flavor compounds targeting health-conscious consumers.
- 2024: Increased regulatory scrutiny on synthetic flavor ingredients.
In-Depth USA Food Flavor Market Market Outlook
The USA food flavor market is poised for sustained growth, driven by technological innovation, changing consumer preferences, and the expansion of food processing industries. Opportunities lie in developing customized flavor solutions, exploring emerging technologies, and focusing on sustainable and ethical sourcing practices. Strategic partnerships and acquisitions will play a crucial role in shaping the market landscape in the coming years. The market is expected to witness further consolidation and a greater focus on natural and clean-label products, presenting significant opportunities for both established players and new entrants.
USA Food Flavor Market Segmentation
-
1. Product Type
- 1.1. Natural Flavor
- 1.2. Synthetic Flavor
- 1.3. Nature Identical Flavoring
-
2. Application
- 2.1. Dairy
- 2.2. Bakery
- 2.3. Confectionery
- 2.4. Meat, Poultry, and Seafood
- 2.5. Beverage
- 2.6. Others
USA Food Flavor Market Segmentation By Geography
-
1. North America
- 1.1. United States
- 1.2. Canada
- 1.3. Mexico
-
2. South America
- 2.1. Brazil
- 2.2. Argentina
- 2.3. Rest of South America
-
3. Europe
- 3.1. United Kingdom
- 3.2. Germany
- 3.3. France
- 3.4. Italy
- 3.5. Spain
- 3.6. Russia
- 3.7. Benelux
- 3.8. Nordics
- 3.9. Rest of Europe
-
4. Middle East & Africa
- 4.1. Turkey
- 4.2. Israel
- 4.3. GCC
- 4.4. North Africa
- 4.5. South Africa
- 4.6. Rest of Middle East & Africa
-
5. Asia Pacific
- 5.1. China
- 5.2. India
- 5.3. Japan
- 5.4. South Korea
- 5.5. ASEAN
- 5.6. Oceania
- 5.7. Rest of Asia Pacific
USA Food Flavor Market REPORT HIGHLIGHTS
| Aspects | Details |
|---|---|
| Study Period | 2019-2033 |
| Base Year | 2024 |
| Estimated Year | 2025 |
| Forecast Period | 2025-2033 |
| Historical Period | 2019-2024 |
| Growth Rate | CAGR of 3.90% from 2019-2033 |
| Segmentation |
|
Table of Contents
- 1. Introduction
- 1.1. Research Scope
- 1.2. Market Segmentation
- 1.3. Research Methodology
- 1.4. Definitions and Assumptions
- 2. Executive Summary
- 2.1. Introduction
- 3. Market Dynamics
- 3.1. Introduction
- 3.2. Market Drivers
- 3.2.1. Surge in Demand for 'Free-from' Food Products; Demand For Convenient And Healthy On-the-go Snacking Options
- 3.3. Market Restrains
- 3.3.1. Health Risk Associated with Certain Ingredients
- 3.4. Market Trends
- 3.4.1. Elevating Demand for Natural Food Flavors
- 4. Market Factor Analysis
- 4.1. Porters Five Forces
- 4.2. Supply/Value Chain
- 4.3. PESTEL analysis
- 4.4. Market Entropy
- 4.5. Patent/Trademark Analysis
- 5. Global USA Food Flavor Market Analysis, Insights and Forecast, 2019-2031
- 5.1. Market Analysis, Insights and Forecast - by Product Type
- 5.1.1. Natural Flavor
- 5.1.2. Synthetic Flavor
- 5.1.3. Nature Identical Flavoring
- 5.2. Market Analysis, Insights and Forecast - by Application
- 5.2.1. Dairy
- 5.2.2. Bakery
- 5.2.3. Confectionery
- 5.2.4. Meat, Poultry, and Seafood
- 5.2.5. Beverage
- 5.2.6. Others
- 5.3. Market Analysis, Insights and Forecast - by Region
- 5.3.1. North America
- 5.3.2. South America
- 5.3.3. Europe
- 5.3.4. Middle East & Africa
- 5.3.5. Asia Pacific
- 5.1. Market Analysis, Insights and Forecast - by Product Type
- 6. North America USA Food Flavor Market Analysis, Insights and Forecast, 2019-2031
- 6.1. Market Analysis, Insights and Forecast - by Product Type
- 6.1.1. Natural Flavor
- 6.1.2. Synthetic Flavor
- 6.1.3. Nature Identical Flavoring
- 6.2. Market Analysis, Insights and Forecast - by Application
- 6.2.1. Dairy
- 6.2.2. Bakery
- 6.2.3. Confectionery
- 6.2.4. Meat, Poultry, and Seafood
- 6.2.5. Beverage
- 6.2.6. Others
- 6.1. Market Analysis, Insights and Forecast - by Product Type
- 7. South America USA Food Flavor Market Analysis, Insights and Forecast, 2019-2031
- 7.1. Market Analysis, Insights and Forecast - by Product Type
- 7.1.1. Natural Flavor
- 7.1.2. Synthetic Flavor
- 7.1.3. Nature Identical Flavoring
- 7.2. Market Analysis, Insights and Forecast - by Application
- 7.2.1. Dairy
- 7.2.2. Bakery
- 7.2.3. Confectionery
- 7.2.4. Meat, Poultry, and Seafood
- 7.2.5. Beverage
- 7.2.6. Others
- 7.1. Market Analysis, Insights and Forecast - by Product Type
- 8. Europe USA Food Flavor Market Analysis, Insights and Forecast, 2019-2031
- 8.1. Market Analysis, Insights and Forecast - by Product Type
- 8.1.1. Natural Flavor
- 8.1.2. Synthetic Flavor
- 8.1.3. Nature Identical Flavoring
- 8.2. Market Analysis, Insights and Forecast - by Application
- 8.2.1. Dairy
- 8.2.2. Bakery
- 8.2.3. Confectionery
- 8.2.4. Meat, Poultry, and Seafood
- 8.2.5. Beverage
- 8.2.6. Others
- 8.1. Market Analysis, Insights and Forecast - by Product Type
- 9. Middle East & Africa USA Food Flavor Market Analysis, Insights and Forecast, 2019-2031
- 9.1. Market Analysis, Insights and Forecast - by Product Type
- 9.1.1. Natural Flavor
- 9.1.2. Synthetic Flavor
- 9.1.3. Nature Identical Flavoring
- 9.2. Market Analysis, Insights and Forecast - by Application
- 9.2.1. Dairy
- 9.2.2. Bakery
- 9.2.3. Confectionery
- 9.2.4. Meat, Poultry, and Seafood
- 9.2.5. Beverage
- 9.2.6. Others
- 9.1. Market Analysis, Insights and Forecast - by Product Type
- 10. Asia Pacific USA Food Flavor Market Analysis, Insights and Forecast, 2019-2031
- 10.1. Market Analysis, Insights and Forecast - by Product Type
- 10.1.1. Natural Flavor
- 10.1.2. Synthetic Flavor
- 10.1.3. Nature Identical Flavoring
- 10.2. Market Analysis, Insights and Forecast - by Application
- 10.2.1. Dairy
- 10.2.2. Bakery
- 10.2.3. Confectionery
- 10.2.4. Meat, Poultry, and Seafood
- 10.2.5. Beverage
- 10.2.6. Others
- 10.1. Market Analysis, Insights and Forecast - by Product Type
- 11. United States USA Food Flavor Market Analysis, Insights and Forecast, 2019-2031
- 12. Canada USA Food Flavor Market Analysis, Insights and Forecast, 2019-2031
- 13. Mexico USA Food Flavor Market Analysis, Insights and Forecast, 2019-2031
- 14. Competitive Analysis
- 14.1. Global Market Share Analysis 2024
- 14.2. Company Profiles
- 14.2.1 Firmenich SA
- 14.2.1.1. Overview
- 14.2.1.2. Products
- 14.2.1.3. SWOT Analysis
- 14.2.1.4. Recent Developments
- 14.2.1.5. Financials (Based on Availability)
- 14.2.2 Givaudan
- 14.2.2.1. Overview
- 14.2.2.2. Products
- 14.2.2.3. SWOT Analysis
- 14.2.2.4. Recent Developments
- 14.2.2.5. Financials (Based on Availability)
- 14.2.3 Sensient Technologies
- 14.2.3.1. Overview
- 14.2.3.2. Products
- 14.2.3.3. SWOT Analysis
- 14.2.3.4. Recent Developments
- 14.2.3.5. Financials (Based on Availability)
- 14.2.4 Symrise AG*List Not Exhaustive
- 14.2.4.1. Overview
- 14.2.4.2. Products
- 14.2.4.3. SWOT Analysis
- 14.2.4.4. Recent Developments
- 14.2.4.5. Financials (Based on Availability)
- 14.2.5 International Flavors & Fragrances Inc
- 14.2.5.1. Overview
- 14.2.5.2. Products
- 14.2.5.3. SWOT Analysis
- 14.2.5.4. Recent Developments
- 14.2.5.5. Financials (Based on Availability)
- 14.2.6 Archer Daniels Midland Company
- 14.2.6.1. Overview
- 14.2.6.2. Products
- 14.2.6.3. SWOT Analysis
- 14.2.6.4. Recent Developments
- 14.2.6.5. Financials (Based on Availability)
- 14.2.7 Flavorchem Corporation
- 14.2.7.1. Overview
- 14.2.7.2. Products
- 14.2.7.3. SWOT Analysis
- 14.2.7.4. Recent Developments
- 14.2.7.5. Financials (Based on Availability)
- 14.2.1 Firmenich SA
List of Figures
- Figure 1: Global USA Food Flavor Market Revenue Breakdown (Million, %) by Region 2024 & 2032
- Figure 2: Global USA Food Flavor Market Volume Breakdown (K Units, %) by Region 2024 & 2032
- Figure 3: North America USA Food Flavor Market Revenue (Million), by Country 2024 & 2032
- Figure 4: North America USA Food Flavor Market Volume (K Units), by Country 2024 & 2032
- Figure 5: North America USA Food Flavor Market Revenue Share (%), by Country 2024 & 2032
- Figure 6: North America USA Food Flavor Market Volume Share (%), by Country 2024 & 2032
- Figure 7: North America USA Food Flavor Market Revenue (Million), by Product Type 2024 & 2032
- Figure 8: North America USA Food Flavor Market Volume (K Units), by Product Type 2024 & 2032
- Figure 9: North America USA Food Flavor Market Revenue Share (%), by Product Type 2024 & 2032
- Figure 10: North America USA Food Flavor Market Volume Share (%), by Product Type 2024 & 2032
- Figure 11: North America USA Food Flavor Market Revenue (Million), by Application 2024 & 2032
- Figure 12: North America USA Food Flavor Market Volume (K Units), by Application 2024 & 2032
- Figure 13: North America USA Food Flavor Market Revenue Share (%), by Application 2024 & 2032
- Figure 14: North America USA Food Flavor Market Volume Share (%), by Application 2024 & 2032
- Figure 15: North America USA Food Flavor Market Revenue (Million), by Country 2024 & 2032
- Figure 16: North America USA Food Flavor Market Volume (K Units), by Country 2024 & 2032
- Figure 17: North America USA Food Flavor Market Revenue Share (%), by Country 2024 & 2032
- Figure 18: North America USA Food Flavor Market Volume Share (%), by Country 2024 & 2032
- Figure 19: South America USA Food Flavor Market Revenue (Million), by Product Type 2024 & 2032
- Figure 20: South America USA Food Flavor Market Volume (K Units), by Product Type 2024 & 2032
- Figure 21: South America USA Food Flavor Market Revenue Share (%), by Product Type 2024 & 2032
- Figure 22: South America USA Food Flavor Market Volume Share (%), by Product Type 2024 & 2032
- Figure 23: South America USA Food Flavor Market Revenue (Million), by Application 2024 & 2032
- Figure 24: South America USA Food Flavor Market Volume (K Units), by Application 2024 & 2032
- Figure 25: South America USA Food Flavor Market Revenue Share (%), by Application 2024 & 2032
- Figure 26: South America USA Food Flavor Market Volume Share (%), by Application 2024 & 2032
- Figure 27: South America USA Food Flavor Market Revenue (Million), by Country 2024 & 2032
- Figure 28: South America USA Food Flavor Market Volume (K Units), by Country 2024 & 2032
- Figure 29: South America USA Food Flavor Market Revenue Share (%), by Country 2024 & 2032
- Figure 30: South America USA Food Flavor Market Volume Share (%), by Country 2024 & 2032
- Figure 31: Europe USA Food Flavor Market Revenue (Million), by Product Type 2024 & 2032
- Figure 32: Europe USA Food Flavor Market Volume (K Units), by Product Type 2024 & 2032
- Figure 33: Europe USA Food Flavor Market Revenue Share (%), by Product Type 2024 & 2032
- Figure 34: Europe USA Food Flavor Market Volume Share (%), by Product Type 2024 & 2032
- Figure 35: Europe USA Food Flavor Market Revenue (Million), by Application 2024 & 2032
- Figure 36: Europe USA Food Flavor Market Volume (K Units), by Application 2024 & 2032
- Figure 37: Europe USA Food Flavor Market Revenue Share (%), by Application 2024 & 2032
- Figure 38: Europe USA Food Flavor Market Volume Share (%), by Application 2024 & 2032
- Figure 39: Europe USA Food Flavor Market Revenue (Million), by Country 2024 & 2032
- Figure 40: Europe USA Food Flavor Market Volume (K Units), by Country 2024 & 2032
- Figure 41: Europe USA Food Flavor Market Revenue Share (%), by Country 2024 & 2032
- Figure 42: Europe USA Food Flavor Market Volume Share (%), by Country 2024 & 2032
- Figure 43: Middle East & Africa USA Food Flavor Market Revenue (Million), by Product Type 2024 & 2032
- Figure 44: Middle East & Africa USA Food Flavor Market Volume (K Units), by Product Type 2024 & 2032
- Figure 45: Middle East & Africa USA Food Flavor Market Revenue Share (%), by Product Type 2024 & 2032
- Figure 46: Middle East & Africa USA Food Flavor Market Volume Share (%), by Product Type 2024 & 2032
- Figure 47: Middle East & Africa USA Food Flavor Market Revenue (Million), by Application 2024 & 2032
- Figure 48: Middle East & Africa USA Food Flavor Market Volume (K Units), by Application 2024 & 2032
- Figure 49: Middle East & Africa USA Food Flavor Market Revenue Share (%), by Application 2024 & 2032
- Figure 50: Middle East & Africa USA Food Flavor Market Volume Share (%), by Application 2024 & 2032
- Figure 51: Middle East & Africa USA Food Flavor Market Revenue (Million), by Country 2024 & 2032
- Figure 52: Middle East & Africa USA Food Flavor Market Volume (K Units), by Country 2024 & 2032
- Figure 53: Middle East & Africa USA Food Flavor Market Revenue Share (%), by Country 2024 & 2032
- Figure 54: Middle East & Africa USA Food Flavor Market Volume Share (%), by Country 2024 & 2032
- Figure 55: Asia Pacific USA Food Flavor Market Revenue (Million), by Product Type 2024 & 2032
- Figure 56: Asia Pacific USA Food Flavor Market Volume (K Units), by Product Type 2024 & 2032
- Figure 57: Asia Pacific USA Food Flavor Market Revenue Share (%), by Product Type 2024 & 2032
- Figure 58: Asia Pacific USA Food Flavor Market Volume Share (%), by Product Type 2024 & 2032
- Figure 59: Asia Pacific USA Food Flavor Market Revenue (Million), by Application 2024 & 2032
- Figure 60: Asia Pacific USA Food Flavor Market Volume (K Units), by Application 2024 & 2032
- Figure 61: Asia Pacific USA Food Flavor Market Revenue Share (%), by Application 2024 & 2032
- Figure 62: Asia Pacific USA Food Flavor Market Volume Share (%), by Application 2024 & 2032
- Figure 63: Asia Pacific USA Food Flavor Market Revenue (Million), by Country 2024 & 2032
- Figure 64: Asia Pacific USA Food Flavor Market Volume (K Units), by Country 2024 & 2032
- Figure 65: Asia Pacific USA Food Flavor Market Revenue Share (%), by Country 2024 & 2032
- Figure 66: Asia Pacific USA Food Flavor Market Volume Share (%), by Country 2024 & 2032
List of Tables
- Table 1: Global USA Food Flavor Market Revenue Million Forecast, by Region 2019 & 2032
- Table 2: Global USA Food Flavor Market Volume K Units Forecast, by Region 2019 & 2032
- Table 3: Global USA Food Flavor Market Revenue Million Forecast, by Product Type 2019 & 2032
- Table 4: Global USA Food Flavor Market Volume K Units Forecast, by Product Type 2019 & 2032
- Table 5: Global USA Food Flavor Market Revenue Million Forecast, by Application 2019 & 2032
- Table 6: Global USA Food Flavor Market Volume K Units Forecast, by Application 2019 & 2032
- Table 7: Global USA Food Flavor Market Revenue Million Forecast, by Region 2019 & 2032
- Table 8: Global USA Food Flavor Market Volume K Units Forecast, by Region 2019 & 2032
- Table 9: Global USA Food Flavor Market Revenue Million Forecast, by Country 2019 & 2032
- Table 10: Global USA Food Flavor Market Volume K Units Forecast, by Country 2019 & 2032
- Table 11: United States USA Food Flavor Market Revenue (Million) Forecast, by Application 2019 & 2032
- Table 12: United States USA Food Flavor Market Volume (K Units) Forecast, by Application 2019 & 2032
- Table 13: Canada USA Food Flavor Market Revenue (Million) Forecast, by Application 2019 & 2032
- Table 14: Canada USA Food Flavor Market Volume (K Units) Forecast, by Application 2019 & 2032
- Table 15: Mexico USA Food Flavor Market Revenue (Million) Forecast, by Application 2019 & 2032
- Table 16: Mexico USA Food Flavor Market Volume (K Units) Forecast, by Application 2019 & 2032
- Table 17: Global USA Food Flavor Market Revenue Million Forecast, by Product Type 2019 & 2032
- Table 18: Global USA Food Flavor Market Volume K Units Forecast, by Product Type 2019 & 2032
- Table 19: Global USA Food Flavor Market Revenue Million Forecast, by Application 2019 & 2032
- Table 20: Global USA Food Flavor Market Volume K Units Forecast, by Application 2019 & 2032
- Table 21: Global USA Food Flavor Market Revenue Million Forecast, by Country 2019 & 2032
- Table 22: Global USA Food Flavor Market Volume K Units Forecast, by Country 2019 & 2032
- Table 23: United States USA Food Flavor Market Revenue (Million) Forecast, by Application 2019 & 2032
- Table 24: United States USA Food Flavor Market Volume (K Units) Forecast, by Application 2019 & 2032
- Table 25: Canada USA Food Flavor Market Revenue (Million) Forecast, by Application 2019 & 2032
- Table 26: Canada USA Food Flavor Market Volume (K Units) Forecast, by Application 2019 & 2032
- Table 27: Mexico USA Food Flavor Market Revenue (Million) Forecast, by Application 2019 & 2032
- Table 28: Mexico USA Food Flavor Market Volume (K Units) Forecast, by Application 2019 & 2032
- Table 29: Global USA Food Flavor Market Revenue Million Forecast, by Product Type 2019 & 2032
- Table 30: Global USA Food Flavor Market Volume K Units Forecast, by Product Type 2019 & 2032
- Table 31: Global USA Food Flavor Market Revenue Million Forecast, by Application 2019 & 2032
- Table 32: Global USA Food Flavor Market Volume K Units Forecast, by Application 2019 & 2032
- Table 33: Global USA Food Flavor Market Revenue Million Forecast, by Country 2019 & 2032
- Table 34: Global USA Food Flavor Market Volume K Units Forecast, by Country 2019 & 2032
- Table 35: Brazil USA Food Flavor Market Revenue (Million) Forecast, by Application 2019 & 2032
- Table 36: Brazil USA Food Flavor Market Volume (K Units) Forecast, by Application 2019 & 2032
- Table 37: Argentina USA Food Flavor Market Revenue (Million) Forecast, by Application 2019 & 2032
- Table 38: Argentina USA Food Flavor Market Volume (K Units) Forecast, by Application 2019 & 2032
- Table 39: Rest of South America USA Food Flavor Market Revenue (Million) Forecast, by Application 2019 & 2032
- Table 40: Rest of South America USA Food Flavor Market Volume (K Units) Forecast, by Application 2019 & 2032
- Table 41: Global USA Food Flavor Market Revenue Million Forecast, by Product Type 2019 & 2032
- Table 42: Global USA Food Flavor Market Volume K Units Forecast, by Product Type 2019 & 2032
- Table 43: Global USA Food Flavor Market Revenue Million Forecast, by Application 2019 & 2032
- Table 44: Global USA Food Flavor Market Volume K Units Forecast, by Application 2019 & 2032
- Table 45: Global USA Food Flavor Market Revenue Million Forecast, by Country 2019 & 2032
- Table 46: Global USA Food Flavor Market Volume K Units Forecast, by Country 2019 & 2032
- Table 47: United Kingdom USA Food Flavor Market Revenue (Million) Forecast, by Application 2019 & 2032
- Table 48: United Kingdom USA Food Flavor Market Volume (K Units) Forecast, by Application 2019 & 2032
- Table 49: Germany USA Food Flavor Market Revenue (Million) Forecast, by Application 2019 & 2032
- Table 50: Germany USA Food Flavor Market Volume (K Units) Forecast, by Application 2019 & 2032
- Table 51: France USA Food Flavor Market Revenue (Million) Forecast, by Application 2019 & 2032
- Table 52: France USA Food Flavor Market Volume (K Units) Forecast, by Application 2019 & 2032
- Table 53: Italy USA Food Flavor Market Revenue (Million) Forecast, by Application 2019 & 2032
- Table 54: Italy USA Food Flavor Market Volume (K Units) Forecast, by Application 2019 & 2032
- Table 55: Spain USA Food Flavor Market Revenue (Million) Forecast, by Application 2019 & 2032
- Table 56: Spain USA Food Flavor Market Volume (K Units) Forecast, by Application 2019 & 2032
- Table 57: Russia USA Food Flavor Market Revenue (Million) Forecast, by Application 2019 & 2032
- Table 58: Russia USA Food Flavor Market Volume (K Units) Forecast, by Application 2019 & 2032
- Table 59: Benelux USA Food Flavor Market Revenue (Million) Forecast, by Application 2019 & 2032
- Table 60: Benelux USA Food Flavor Market Volume (K Units) Forecast, by Application 2019 & 2032
- Table 61: Nordics USA Food Flavor Market Revenue (Million) Forecast, by Application 2019 & 2032
- Table 62: Nordics USA Food Flavor Market Volume (K Units) Forecast, by Application 2019 & 2032
- Table 63: Rest of Europe USA Food Flavor Market Revenue (Million) Forecast, by Application 2019 & 2032
- Table 64: Rest of Europe USA Food Flavor Market Volume (K Units) Forecast, by Application 2019 & 2032
- Table 65: Global USA Food Flavor Market Revenue Million Forecast, by Product Type 2019 & 2032
- Table 66: Global USA Food Flavor Market Volume K Units Forecast, by Product Type 2019 & 2032
- Table 67: Global USA Food Flavor Market Revenue Million Forecast, by Application 2019 & 2032
- Table 68: Global USA Food Flavor Market Volume K Units Forecast, by Application 2019 & 2032
- Table 69: Global USA Food Flavor Market Revenue Million Forecast, by Country 2019 & 2032
- Table 70: Global USA Food Flavor Market Volume K Units Forecast, by Country 2019 & 2032
- Table 71: Turkey USA Food Flavor Market Revenue (Million) Forecast, by Application 2019 & 2032
- Table 72: Turkey USA Food Flavor Market Volume (K Units) Forecast, by Application 2019 & 2032
- Table 73: Israel USA Food Flavor Market Revenue (Million) Forecast, by Application 2019 & 2032
- Table 74: Israel USA Food Flavor Market Volume (K Units) Forecast, by Application 2019 & 2032
- Table 75: GCC USA Food Flavor Market Revenue (Million) Forecast, by Application 2019 & 2032
- Table 76: GCC USA Food Flavor Market Volume (K Units) Forecast, by Application 2019 & 2032
- Table 77: North Africa USA Food Flavor Market Revenue (Million) Forecast, by Application 2019 & 2032
- Table 78: North Africa USA Food Flavor Market Volume (K Units) Forecast, by Application 2019 & 2032
- Table 79: South Africa USA Food Flavor Market Revenue (Million) Forecast, by Application 2019 & 2032
- Table 80: South Africa USA Food Flavor Market Volume (K Units) Forecast, by Application 2019 & 2032
- Table 81: Rest of Middle East & Africa USA Food Flavor Market Revenue (Million) Forecast, by Application 2019 & 2032
- Table 82: Rest of Middle East & Africa USA Food Flavor Market Volume (K Units) Forecast, by Application 2019 & 2032
- Table 83: Global USA Food Flavor Market Revenue Million Forecast, by Product Type 2019 & 2032
- Table 84: Global USA Food Flavor Market Volume K Units Forecast, by Product Type 2019 & 2032
- Table 85: Global USA Food Flavor Market Revenue Million Forecast, by Application 2019 & 2032
- Table 86: Global USA Food Flavor Market Volume K Units Forecast, by Application 2019 & 2032
- Table 87: Global USA Food Flavor Market Revenue Million Forecast, by Country 2019 & 2032
- Table 88: Global USA Food Flavor Market Volume K Units Forecast, by Country 2019 & 2032
- Table 89: China USA Food Flavor Market Revenue (Million) Forecast, by Application 2019 & 2032
- Table 90: China USA Food Flavor Market Volume (K Units) Forecast, by Application 2019 & 2032
- Table 91: India USA Food Flavor Market Revenue (Million) Forecast, by Application 2019 & 2032
- Table 92: India USA Food Flavor Market Volume (K Units) Forecast, by Application 2019 & 2032
- Table 93: Japan USA Food Flavor Market Revenue (Million) Forecast, by Application 2019 & 2032
- Table 94: Japan USA Food Flavor Market Volume (K Units) Forecast, by Application 2019 & 2032
- Table 95: South Korea USA Food Flavor Market Revenue (Million) Forecast, by Application 2019 & 2032
- Table 96: South Korea USA Food Flavor Market Volume (K Units) Forecast, by Application 2019 & 2032
- Table 97: ASEAN USA Food Flavor Market Revenue (Million) Forecast, by Application 2019 & 2032
- Table 98: ASEAN USA Food Flavor Market Volume (K Units) Forecast, by Application 2019 & 2032
- Table 99: Oceania USA Food Flavor Market Revenue (Million) Forecast, by Application 2019 & 2032
- Table 100: Oceania USA Food Flavor Market Volume (K Units) Forecast, by Application 2019 & 2032
- Table 101: Rest of Asia Pacific USA Food Flavor Market Revenue (Million) Forecast, by Application 2019 & 2032
- Table 102: Rest of Asia Pacific USA Food Flavor Market Volume (K Units) Forecast, by Application 2019 & 2032
Frequently Asked Questions
1. What is the projected Compound Annual Growth Rate (CAGR) of the USA Food Flavor Market?
The projected CAGR is approximately 3.90%.
2. Which companies are prominent players in the USA Food Flavor Market?
Key companies in the market include Firmenich SA, Givaudan, Sensient Technologies, Symrise AG*List Not Exhaustive, International Flavors & Fragrances Inc, Archer Daniels Midland Company, Flavorchem Corporation.
3. What are the main segments of the USA Food Flavor Market?
The market segments include Product Type, Application.
4. Can you provide details about the market size?
The market size is estimated to be USD XX Million as of 2022.
5. What are some drivers contributing to market growth?
Surge in Demand for 'Free-from' Food Products; Demand For Convenient And Healthy On-the-go Snacking Options.
6. What are the notable trends driving market growth?
Elevating Demand for Natural Food Flavors.
7. Are there any restraints impacting market growth?
Health Risk Associated with Certain Ingredients.
8. Can you provide examples of recent developments in the market?
N/A
9. What pricing options are available for accessing the report?
Pricing options include single-user, multi-user, and enterprise licenses priced at USD 3800, USD 4500, and USD 5800 respectively.
10. Is the market size provided in terms of value or volume?
The market size is provided in terms of value, measured in Million and volume, measured in K Units.
11. Are there any specific market keywords associated with the report?
Yes, the market keyword associated with the report is "USA Food Flavor Market," which aids in identifying and referencing the specific market segment covered.
12. How do I determine which pricing option suits my needs best?
The pricing options vary based on user requirements and access needs. Individual users may opt for single-user licenses, while businesses requiring broader access may choose multi-user or enterprise licenses for cost-effective access to the report.
13. Are there any additional resources or data provided in the USA Food Flavor Market report?
While the report offers comprehensive insights, it's advisable to review the specific contents or supplementary materials provided to ascertain if additional resources or data are available.
14. How can I stay updated on further developments or reports in the USA Food Flavor Market?
To stay informed about further developments, trends, and reports in the USA Food Flavor Market, consider subscribing to industry newsletters, following relevant companies and organizations, or regularly checking reputable industry news sources and publications.
Methodology
Step 1 - Identification of Relevant Samples Size from Population Database


Step 2 - Approaches for Defining Global Market Size (Value, Volume* & Price*)

Note*: In applicable scenarios
Step 3 - Data Sources
Primary Research
- Web Analytics
- Survey Reports
- Research Institute
- Latest Research Reports
- Opinion Leaders
Secondary Research
- Annual Reports
- White Paper
- Latest Press Release
- Industry Association
- Paid Database
- Investor Presentations

Step 4 - Data Triangulation
Involves using different sources of information in order to increase the validity of a study
These sources are likely to be stakeholders in a program - participants, other researchers, program staff, other community members, and so on.
Then we put all data in single framework & apply various statistical tools to find out the dynamic on the market.
During the analysis stage, feedback from the stakeholder groups would be compared to determine areas of agreement as well as areas of divergence


