
Key Insights
The MEA (Middle East and Africa) food sweetener market, while exhibiting a smaller overall size compared to global giants like North America or Asia-Pacific, presents a compelling growth story. Driven by factors such as increasing urbanization, rising disposable incomes, and changing dietary habits, particularly a preference for processed foods and beverages, the market is experiencing steady expansion. The adoption of westernized lifestyles and the consequent rise in consumption of sugary drinks and confectionery contribute significantly to demand. While sucrose (common sugar) currently dominates the product segment, the increasing health consciousness amongst consumers is fueling growth in the sugar alcohol and high-intensity sweetener (HIS) segments. This trend is further amplified by growing awareness of the health risks associated with excessive sugar consumption, leading consumers to actively seek healthier alternatives. Specific applications showing strong growth potential include the confectionery and beverage sectors, spurred by the ever-evolving range of product innovations within those categories. However, challenges remain, including fluctuating raw material prices, regulatory hurdles related to specific sweetener types, and varying levels of consumer awareness regarding the health implications of different sweeteners across the diverse MEA region. The market's future trajectory will largely depend on the successful navigation of these challenges and capitalizing on emerging opportunities presented by the growing health and wellness focus.
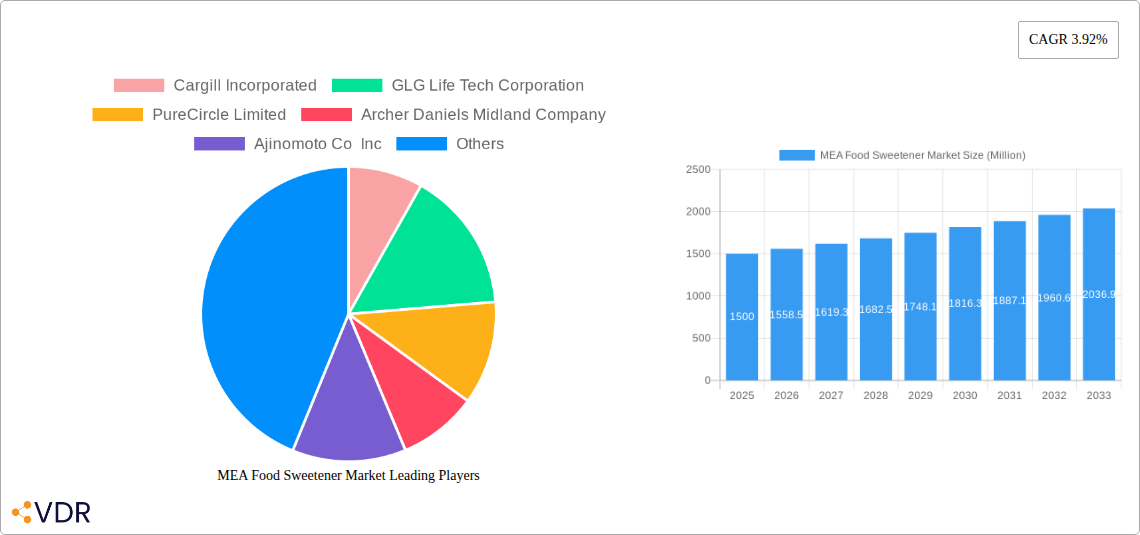
The competitive landscape is characterized by a mix of both international players and regional manufacturers. Global giants like Cargill, ADM, and Tate & Lyle are well-positioned to capitalize on expanding demand, often leveraging established distribution networks. However, local players are also gaining prominence by catering to specific regional preferences and tastes. Future growth will likely be driven by increased product diversification, targeted marketing campaigns to address specific consumer needs, and strategic partnerships aimed at strengthening supply chains and distribution within this fragmented market. The region's diverse cultural landscape necessitates tailored product offerings and marketing strategies to effectively tap into various consumer segments and ensure successful market penetration.
MEA Food Sweetener Market: A Comprehensive Market Report (2019-2033)
This comprehensive report provides an in-depth analysis of the Middle East and Africa (MEA) food sweetener market, offering valuable insights for industry professionals, investors, and stakeholders. The report covers the period from 2019 to 2033, with 2025 as the base year and a forecast period spanning 2025-2033. The market is segmented by product type (Sucrose (Common Sugar), Starch Sweeteners and Sugar Alcohols, High Intensity Sweeteners (HIS)) and application (Dairy, Bakery, Soups, Sauces and Dressings, Confectionery, Beverages, Others). Key players analyzed include Cargill Incorporated, GLG Life Tech Corporation, PureCircle Limited, Archer Daniels Midland Company, Ajinomoto Co Inc, Tate & Lyle PLC, Ingredion Incorporated, and Tereos S A, though the list is not exhaustive. The report's value is expressed in million units.
MEA Food Sweetener Market Dynamics & Structure
The MEA food sweetener market is characterized by a moderate level of concentration, with a few major players holding significant market share. Technological innovation, particularly in high-intensity sweeteners (HIS), is a key driver, pushing the market towards healthier and lower-calorie options. Regulatory frameworks concerning sugar content and labeling significantly influence product development and consumer choices. Competition from natural sweeteners and alternative solutions necessitates continuous innovation. The market witnesses considerable M&A activity, driven by the pursuit of expanding product portfolios and geographical reach.
- Market Concentration: xx% market share held by top 5 players in 2024.
- Technological Innovation: Significant investments in R&D for HIS and sugar substitutes.
- Regulatory Landscape: Stringent regulations on sugar content and labeling impact product formulation.
- Competitive Substitutes: Growing popularity of natural sweeteners and sugar alternatives.
- M&A Activity: xx M&A deals recorded in the MEA region between 2019 and 2024.
- Innovation Barriers: High R&D costs and stringent regulatory approvals hinder innovation.
MEA Food Sweetener Market Growth Trends & Insights
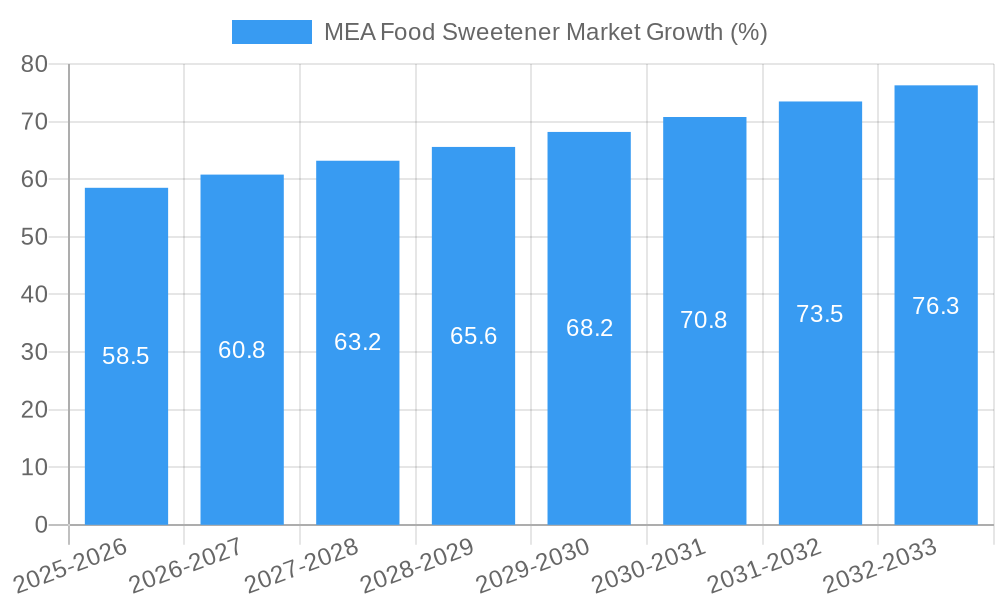
The MEA food sweetener market experienced a CAGR of xx% during the historical period (2019-2024), driven by factors such as rising disposable incomes, changing dietary habits, and a growing preference for processed foods and beverages. The market is expected to continue its growth trajectory during the forecast period (2025-2033), with a projected CAGR of xx%. Technological advancements in sweetener production, along with the increasing adoption of healthier alternatives like HIS, are shaping market trends. Consumer preferences for convenience and functional foods are also significantly influencing demand. Market penetration of HIS is expected to increase from xx% in 2024 to xx% by 2033. The increasing demand for processed foods and beverages across the region is driving the market growth. The rising health consciousness among consumers is leading to a surge in demand for healthier sweeteners.
Dominant Regions, Countries, or Segments in MEA Food Sweetener Market
The [Specific Country/Region - e.g., Egypt or the GCC] represents the dominant region in the MEA food sweetener market, holding approximately xx% market share in 2024. This dominance is attributed to factors such as a large and growing population, expanding food processing industry, and increased consumption of processed foods and beverages. The Sucrose (Common Sugar) segment currently holds the largest market share among product types, although the HIS segment is witnessing the fastest growth due to increasing health consciousness. Within applications, the beverages segment shows strong growth potential, followed by the confectionery sector.
- Key Drivers in [Specific Country/Region]: Rapid urbanization, rising disposable incomes, and a growing middle class.
- Dominance Factors: Large population, well-established food processing industry, and high consumption of sweetened products.
- Growth Potential: High growth potential in emerging markets within the MEA region.
MEA Food Sweetener Market Product Landscape
The MEA food sweetener market offers a diverse range of products, including traditional sucrose, starch-based sweeteners, sugar alcohols, and high-intensity sweeteners. Recent innovations focus on developing sweeteners with improved functionalities, such as enhanced sweetness, reduced aftertaste, and improved solubility. Technological advancements in extraction and processing techniques are contributing to the production of high-quality and cost-effective sweeteners. Unique selling propositions include improved taste profiles, better functional properties, and health-related benefits.
Key Drivers, Barriers & Challenges in MEA Food Sweetener Market
Key Drivers: Rising disposable incomes, increasing demand for processed foods and beverages, and growing awareness of health and wellness drive market growth. Technological advancements in sweetener production and the introduction of innovative products with enhanced functionalities further contribute to market expansion.
Key Challenges: Fluctuations in raw material prices, stringent regulatory compliance requirements, and intense competition among established and emerging players pose significant challenges. Supply chain disruptions and political instability in certain regions also impact market growth. The rising cost of raw materials is increasing the production cost of sweeteners.
Emerging Opportunities in MEA Food Sweetener Market
Emerging opportunities lie in the growing demand for healthier and functional sweeteners, particularly in the HIS segment. Untapped markets in rural areas and the expansion into emerging economies present significant growth potential. Innovative applications of sweeteners in novel food and beverage products cater to evolving consumer preferences. The increasing health consciousness among consumers is creating a strong demand for natural and low-calorie sweeteners.
Growth Accelerators in the MEA Food Sweetener Market Industry
Technological advancements in sweetener production, strategic partnerships between manufacturers and food & beverage companies, and government initiatives promoting the growth of the food processing industry are accelerating market growth. Expansion into new geographical markets and the diversification of product portfolios further enhance the market's expansion.
Key Players Shaping the MEA Food Sweetener Market Market
- Cargill Incorporated
- GLG Life Tech Corporation
- PureCircle Limited
- Archer Daniels Midland Company
- Ajinomoto Co Inc
- Tate & Lyle PLC
- Ingredion Incorporated
- Tereos S A
- List Not Exhaustive
Notable Milestones in MEA Food Sweetener Market Sector
- 2022 Q4: Launch of a new stevia-based sweetener by [Company Name].
- 2023 Q1: Acquisition of [Company A] by [Company B].
- 2024 Q2: Introduction of a new regulatory framework for food sweeteners in [Country]. (Add further milestones as available)
In-Depth MEA Food Sweetener Market Market Outlook
The MEA food sweetener market is poised for robust growth in the coming years, driven by favorable demographic trends, economic growth, and rising demand for processed foods. Strategic partnerships, product innovation, and expansion into new markets will be crucial for sustained success. Companies should focus on developing healthier and sustainable sweeteners to meet the evolving needs of consumers. The market presents significant opportunities for growth and innovation in the years to come.
MEA Food Sweetener Market Segmentation
-
1. Product Type
- 1.1. Sucrose (Common Sugar)
-
1.2. Starch Sweeteners and Sugar Alcohols
- 1.2.1. Dextrose
- 1.2.2. High Fructose Corn Syrup (HFCS)
- 1.2.3. Maltodextrin
- 1.2.4. Sorbitol
- 1.2.5. Xylitol
- 1.2.6. Others
-
1.3. High Intensity Sweeteners (HIS)
- 1.3.1. Sucralose
- 1.3.2. Aspartame
- 1.3.3. Saccharin
- 1.3.4. Cyclamate
- 1.3.5. Ace-K
- 1.3.6. Neotame
- 1.3.7. Stevia
-
2. Application
- 2.1. Dairy
- 2.2. Bakery
- 2.3. Soups, Sauces and Dressings
- 2.4. Confectionery
- 2.5. Beverages
- 2.6. Others
-
3. Geography
- 3.1. South Africa
- 3.2. Rest of Middle East and Africa
MEA Food Sweetener Market Segmentation By Geography
- 1. South Africa
- 2. Rest of Middle East and Africa
MEA Food Sweetener Market REPORT HIGHLIGHTS
| Aspects | Details |
|---|---|
| Study Period | 2019-2033 |
| Base Year | 2024 |
| Estimated Year | 2025 |
| Forecast Period | 2025-2033 |
| Historical Period | 2019-2024 |
| Growth Rate | CAGR of 3.92% from 2019-2033 |
| Segmentation |
|
Table of Contents
- 1. Introduction
- 1.1. Research Scope
- 1.2. Market Segmentation
- 1.3. Research Methodology
- 1.4. Definitions and Assumptions
- 2. Executive Summary
- 2.1. Introduction
- 3. Market Dynamics
- 3.1. Introduction
- 3.2. Market Drivers
- 3.2.1. Shift towards Natural Sweeteners
- 3.3. Market Restrains
- 3.3.1. Health Concerns Related to Sweetener Consumption
- 3.4. Market Trends
- 3.4.1. South Africa is one of the Largest Market
- 4. Market Factor Analysis
- 4.1. Porters Five Forces
- 4.2. Supply/Value Chain
- 4.3. PESTEL analysis
- 4.4. Market Entropy
- 4.5. Patent/Trademark Analysis
- 5. Global MEA Food Sweetener Market Analysis, Insights and Forecast, 2019-2031
- 5.1. Market Analysis, Insights and Forecast - by Product Type
- 5.1.1. Sucrose (Common Sugar)
- 5.1.2. Starch Sweeteners and Sugar Alcohols
- 5.1.2.1. Dextrose
- 5.1.2.2. High Fructose Corn Syrup (HFCS)
- 5.1.2.3. Maltodextrin
- 5.1.2.4. Sorbitol
- 5.1.2.5. Xylitol
- 5.1.2.6. Others
- 5.1.3. High Intensity Sweeteners (HIS)
- 5.1.3.1. Sucralose
- 5.1.3.2. Aspartame
- 5.1.3.3. Saccharin
- 5.1.3.4. Cyclamate
- 5.1.3.5. Ace-K
- 5.1.3.6. Neotame
- 5.1.3.7. Stevia
- 5.2. Market Analysis, Insights and Forecast - by Application
- 5.2.1. Dairy
- 5.2.2. Bakery
- 5.2.3. Soups, Sauces and Dressings
- 5.2.4. Confectionery
- 5.2.5. Beverages
- 5.2.6. Others
- 5.3. Market Analysis, Insights and Forecast - by Geography
- 5.3.1. South Africa
- 5.3.2. Rest of Middle East and Africa
- 5.4. Market Analysis, Insights and Forecast - by Region
- 5.4.1. South Africa
- 5.4.2. Rest of Middle East and Africa
- 5.1. Market Analysis, Insights and Forecast - by Product Type
- 6. South Africa MEA Food Sweetener Market Analysis, Insights and Forecast, 2019-2031
- 6.1. Market Analysis, Insights and Forecast - by Product Type
- 6.1.1. Sucrose (Common Sugar)
- 6.1.2. Starch Sweeteners and Sugar Alcohols
- 6.1.2.1. Dextrose
- 6.1.2.2. High Fructose Corn Syrup (HFCS)
- 6.1.2.3. Maltodextrin
- 6.1.2.4. Sorbitol
- 6.1.2.5. Xylitol
- 6.1.2.6. Others
- 6.1.3. High Intensity Sweeteners (HIS)
- 6.1.3.1. Sucralose
- 6.1.3.2. Aspartame
- 6.1.3.3. Saccharin
- 6.1.3.4. Cyclamate
- 6.1.3.5. Ace-K
- 6.1.3.6. Neotame
- 6.1.3.7. Stevia
- 6.2. Market Analysis, Insights and Forecast - by Application
- 6.2.1. Dairy
- 6.2.2. Bakery
- 6.2.3. Soups, Sauces and Dressings
- 6.2.4. Confectionery
- 6.2.5. Beverages
- 6.2.6. Others
- 6.3. Market Analysis, Insights and Forecast - by Geography
- 6.3.1. South Africa
- 6.3.2. Rest of Middle East and Africa
- 6.1. Market Analysis, Insights and Forecast - by Product Type
- 7. Rest of Middle East and Africa MEA Food Sweetener Market Analysis, Insights and Forecast, 2019-2031
- 7.1. Market Analysis, Insights and Forecast - by Product Type
- 7.1.1. Sucrose (Common Sugar)
- 7.1.2. Starch Sweeteners and Sugar Alcohols
- 7.1.2.1. Dextrose
- 7.1.2.2. High Fructose Corn Syrup (HFCS)
- 7.1.2.3. Maltodextrin
- 7.1.2.4. Sorbitol
- 7.1.2.5. Xylitol
- 7.1.2.6. Others
- 7.1.3. High Intensity Sweeteners (HIS)
- 7.1.3.1. Sucralose
- 7.1.3.2. Aspartame
- 7.1.3.3. Saccharin
- 7.1.3.4. Cyclamate
- 7.1.3.5. Ace-K
- 7.1.3.6. Neotame
- 7.1.3.7. Stevia
- 7.2. Market Analysis, Insights and Forecast - by Application
- 7.2.1. Dairy
- 7.2.2. Bakery
- 7.2.3. Soups, Sauces and Dressings
- 7.2.4. Confectionery
- 7.2.5. Beverages
- 7.2.6. Others
- 7.3. Market Analysis, Insights and Forecast - by Geography
- 7.3.1. South Africa
- 7.3.2. Rest of Middle East and Africa
- 7.1. Market Analysis, Insights and Forecast - by Product Type
- 8. North America MEA Food Sweetener Market Analysis, Insights and Forecast, 2019-2031
- 8.1. Market Analysis, Insights and Forecast - By Country/Sub-region
- 8.1.1 United States
- 8.1.2 Canada
- 8.1.3 Mexico
- 9. Europe MEA Food Sweetener Market Analysis, Insights and Forecast, 2019-2031
- 9.1. Market Analysis, Insights and Forecast - By Country/Sub-region
- 9.1.1 Germany
- 9.1.2 United Kingdom
- 9.1.3 France
- 9.1.4 Spain
- 9.1.5 Italy
- 9.1.6 Spain
- 9.1.7 Belgium
- 9.1.8 Netherland
- 9.1.9 Nordics
- 9.1.10 Rest of Europe
- 10. Asia Pacific MEA Food Sweetener Market Analysis, Insights and Forecast, 2019-2031
- 10.1. Market Analysis, Insights and Forecast - By Country/Sub-region
- 10.1.1 China
- 10.1.2 Japan
- 10.1.3 India
- 10.1.4 South Korea
- 10.1.5 Southeast Asia
- 10.1.6 Australia
- 10.1.7 Indonesia
- 10.1.8 Phillipes
- 10.1.9 Singapore
- 10.1.10 Thailandc
- 10.1.11 Rest of Asia Pacific
- 11. South America MEA Food Sweetener Market Analysis, Insights and Forecast, 2019-2031
- 11.1. Market Analysis, Insights and Forecast - By Country/Sub-region
- 11.1.1 Brazil
- 11.1.2 Argentina
- 11.1.3 Peru
- 11.1.4 Chile
- 11.1.5 Colombia
- 11.1.6 Ecuador
- 11.1.7 Venezuela
- 11.1.8 Rest of South America
- 12. North America MEA Food Sweetener Market Analysis, Insights and Forecast, 2019-2031
- 12.1. Market Analysis, Insights and Forecast - By Country/Sub-region
- 12.1.1 United States
- 12.1.2 Canada
- 12.1.3 Mexico
- 13. MEA MEA Food Sweetener Market Analysis, Insights and Forecast, 2019-2031
- 13.1. Market Analysis, Insights and Forecast - By Country/Sub-region
- 13.1.1 United Arab Emirates
- 13.1.2 Saudi Arabia
- 13.1.3 South Africa
- 13.1.4 Rest of Middle East and Africa
- 14. Competitive Analysis
- 14.1. Global Market Share Analysis 2024
- 14.2. Company Profiles
- 14.2.1 Cargill Incorporated
- 14.2.1.1. Overview
- 14.2.1.2. Products
- 14.2.1.3. SWOT Analysis
- 14.2.1.4. Recent Developments
- 14.2.1.5. Financials (Based on Availability)
- 14.2.2 GLG Life Tech Corporation
- 14.2.2.1. Overview
- 14.2.2.2. Products
- 14.2.2.3. SWOT Analysis
- 14.2.2.4. Recent Developments
- 14.2.2.5. Financials (Based on Availability)
- 14.2.3 PureCircle Limited
- 14.2.3.1. Overview
- 14.2.3.2. Products
- 14.2.3.3. SWOT Analysis
- 14.2.3.4. Recent Developments
- 14.2.3.5. Financials (Based on Availability)
- 14.2.4 Archer Daniels Midland Company
- 14.2.4.1. Overview
- 14.2.4.2. Products
- 14.2.4.3. SWOT Analysis
- 14.2.4.4. Recent Developments
- 14.2.4.5. Financials (Based on Availability)
- 14.2.5 Ajinomoto Co Inc
- 14.2.5.1. Overview
- 14.2.5.2. Products
- 14.2.5.3. SWOT Analysis
- 14.2.5.4. Recent Developments
- 14.2.5.5. Financials (Based on Availability)
- 14.2.6 Tate & Lyle PLC
- 14.2.6.1. Overview
- 14.2.6.2. Products
- 14.2.6.3. SWOT Analysis
- 14.2.6.4. Recent Developments
- 14.2.6.5. Financials (Based on Availability)
- 14.2.7 Ingredion Incorporated
- 14.2.7.1. Overview
- 14.2.7.2. Products
- 14.2.7.3. SWOT Analysis
- 14.2.7.4. Recent Developments
- 14.2.7.5. Financials (Based on Availability)
- 14.2.8 Tereos S A *List Not Exhaustive
- 14.2.8.1. Overview
- 14.2.8.2. Products
- 14.2.8.3. SWOT Analysis
- 14.2.8.4. Recent Developments
- 14.2.8.5. Financials (Based on Availability)
- 14.2.1 Cargill Incorporated
List of Figures
- Figure 1: Global MEA Food Sweetener Market Revenue Breakdown (Million, %) by Region 2024 & 2032
- Figure 2: Global MEA Food Sweetener Market Volume Breakdown (K Tons, %) by Region 2024 & 2032
- Figure 3: North America MEA Food Sweetener Market Revenue (Million), by Country 2024 & 2032
- Figure 4: North America MEA Food Sweetener Market Volume (K Tons), by Country 2024 & 2032
- Figure 5: North America MEA Food Sweetener Market Revenue Share (%), by Country 2024 & 2032
- Figure 6: North America MEA Food Sweetener Market Volume Share (%), by Country 2024 & 2032
- Figure 7: Europe MEA Food Sweetener Market Revenue (Million), by Country 2024 & 2032
- Figure 8: Europe MEA Food Sweetener Market Volume (K Tons), by Country 2024 & 2032
- Figure 9: Europe MEA Food Sweetener Market Revenue Share (%), by Country 2024 & 2032
- Figure 10: Europe MEA Food Sweetener Market Volume Share (%), by Country 2024 & 2032
- Figure 11: Asia Pacific MEA Food Sweetener Market Revenue (Million), by Country 2024 & 2032
- Figure 12: Asia Pacific MEA Food Sweetener Market Volume (K Tons), by Country 2024 & 2032
- Figure 13: Asia Pacific MEA Food Sweetener Market Revenue Share (%), by Country 2024 & 2032
- Figure 14: Asia Pacific MEA Food Sweetener Market Volume Share (%), by Country 2024 & 2032
- Figure 15: South America MEA Food Sweetener Market Revenue (Million), by Country 2024 & 2032
- Figure 16: South America MEA Food Sweetener Market Volume (K Tons), by Country 2024 & 2032
- Figure 17: South America MEA Food Sweetener Market Revenue Share (%), by Country 2024 & 2032
- Figure 18: South America MEA Food Sweetener Market Volume Share (%), by Country 2024 & 2032
- Figure 19: North America MEA Food Sweetener Market Revenue (Million), by Country 2024 & 2032
- Figure 20: North America MEA Food Sweetener Market Volume (K Tons), by Country 2024 & 2032
- Figure 21: North America MEA Food Sweetener Market Revenue Share (%), by Country 2024 & 2032
- Figure 22: North America MEA Food Sweetener Market Volume Share (%), by Country 2024 & 2032
- Figure 23: MEA MEA Food Sweetener Market Revenue (Million), by Country 2024 & 2032
- Figure 24: MEA MEA Food Sweetener Market Volume (K Tons), by Country 2024 & 2032
- Figure 25: MEA MEA Food Sweetener Market Revenue Share (%), by Country 2024 & 2032
- Figure 26: MEA MEA Food Sweetener Market Volume Share (%), by Country 2024 & 2032
- Figure 27: South Africa MEA Food Sweetener Market Revenue (Million), by Product Type 2024 & 2032
- Figure 28: South Africa MEA Food Sweetener Market Volume (K Tons), by Product Type 2024 & 2032
- Figure 29: South Africa MEA Food Sweetener Market Revenue Share (%), by Product Type 2024 & 2032
- Figure 30: South Africa MEA Food Sweetener Market Volume Share (%), by Product Type 2024 & 2032
- Figure 31: South Africa MEA Food Sweetener Market Revenue (Million), by Application 2024 & 2032
- Figure 32: South Africa MEA Food Sweetener Market Volume (K Tons), by Application 2024 & 2032
- Figure 33: South Africa MEA Food Sweetener Market Revenue Share (%), by Application 2024 & 2032
- Figure 34: South Africa MEA Food Sweetener Market Volume Share (%), by Application 2024 & 2032
- Figure 35: South Africa MEA Food Sweetener Market Revenue (Million), by Geography 2024 & 2032
- Figure 36: South Africa MEA Food Sweetener Market Volume (K Tons), by Geography 2024 & 2032
- Figure 37: South Africa MEA Food Sweetener Market Revenue Share (%), by Geography 2024 & 2032
- Figure 38: South Africa MEA Food Sweetener Market Volume Share (%), by Geography 2024 & 2032
- Figure 39: South Africa MEA Food Sweetener Market Revenue (Million), by Country 2024 & 2032
- Figure 40: South Africa MEA Food Sweetener Market Volume (K Tons), by Country 2024 & 2032
- Figure 41: South Africa MEA Food Sweetener Market Revenue Share (%), by Country 2024 & 2032
- Figure 42: South Africa MEA Food Sweetener Market Volume Share (%), by Country 2024 & 2032
- Figure 43: Rest of Middle East and Africa MEA Food Sweetener Market Revenue (Million), by Product Type 2024 & 2032
- Figure 44: Rest of Middle East and Africa MEA Food Sweetener Market Volume (K Tons), by Product Type 2024 & 2032
- Figure 45: Rest of Middle East and Africa MEA Food Sweetener Market Revenue Share (%), by Product Type 2024 & 2032
- Figure 46: Rest of Middle East and Africa MEA Food Sweetener Market Volume Share (%), by Product Type 2024 & 2032
- Figure 47: Rest of Middle East and Africa MEA Food Sweetener Market Revenue (Million), by Application 2024 & 2032
- Figure 48: Rest of Middle East and Africa MEA Food Sweetener Market Volume (K Tons), by Application 2024 & 2032
- Figure 49: Rest of Middle East and Africa MEA Food Sweetener Market Revenue Share (%), by Application 2024 & 2032
- Figure 50: Rest of Middle East and Africa MEA Food Sweetener Market Volume Share (%), by Application 2024 & 2032
- Figure 51: Rest of Middle East and Africa MEA Food Sweetener Market Revenue (Million), by Geography 2024 & 2032
- Figure 52: Rest of Middle East and Africa MEA Food Sweetener Market Volume (K Tons), by Geography 2024 & 2032
- Figure 53: Rest of Middle East and Africa MEA Food Sweetener Market Revenue Share (%), by Geography 2024 & 2032
- Figure 54: Rest of Middle East and Africa MEA Food Sweetener Market Volume Share (%), by Geography 2024 & 2032
- Figure 55: Rest of Middle East and Africa MEA Food Sweetener Market Revenue (Million), by Country 2024 & 2032
- Figure 56: Rest of Middle East and Africa MEA Food Sweetener Market Volume (K Tons), by Country 2024 & 2032
- Figure 57: Rest of Middle East and Africa MEA Food Sweetener Market Revenue Share (%), by Country 2024 & 2032
- Figure 58: Rest of Middle East and Africa MEA Food Sweetener Market Volume Share (%), by Country 2024 & 2032
List of Tables
- Table 1: Global MEA Food Sweetener Market Revenue Million Forecast, by Region 2019 & 2032
- Table 2: Global MEA Food Sweetener Market Volume K Tons Forecast, by Region 2019 & 2032
- Table 3: Global MEA Food Sweetener Market Revenue Million Forecast, by Product Type 2019 & 2032
- Table 4: Global MEA Food Sweetener Market Volume K Tons Forecast, by Product Type 2019 & 2032
- Table 5: Global MEA Food Sweetener Market Revenue Million Forecast, by Application 2019 & 2032
- Table 6: Global MEA Food Sweetener Market Volume K Tons Forecast, by Application 2019 & 2032
- Table 7: Global MEA Food Sweetener Market Revenue Million Forecast, by Geography 2019 & 2032
- Table 8: Global MEA Food Sweetener Market Volume K Tons Forecast, by Geography 2019 & 2032
- Table 9: Global MEA Food Sweetener Market Revenue Million Forecast, by Region 2019 & 2032
- Table 10: Global MEA Food Sweetener Market Volume K Tons Forecast, by Region 2019 & 2032
- Table 11: Global MEA Food Sweetener Market Revenue Million Forecast, by Country 2019 & 2032
- Table 12: Global MEA Food Sweetener Market Volume K Tons Forecast, by Country 2019 & 2032
- Table 13: United States MEA Food Sweetener Market Revenue (Million) Forecast, by Application 2019 & 2032
- Table 14: United States MEA Food Sweetener Market Volume (K Tons) Forecast, by Application 2019 & 2032
- Table 15: Canada MEA Food Sweetener Market Revenue (Million) Forecast, by Application 2019 & 2032
- Table 16: Canada MEA Food Sweetener Market Volume (K Tons) Forecast, by Application 2019 & 2032
- Table 17: Mexico MEA Food Sweetener Market Revenue (Million) Forecast, by Application 2019 & 2032
- Table 18: Mexico MEA Food Sweetener Market Volume (K Tons) Forecast, by Application 2019 & 2032
- Table 19: Global MEA Food Sweetener Market Revenue Million Forecast, by Country 2019 & 2032
- Table 20: Global MEA Food Sweetener Market Volume K Tons Forecast, by Country 2019 & 2032
- Table 21: Germany MEA Food Sweetener Market Revenue (Million) Forecast, by Application 2019 & 2032
- Table 22: Germany MEA Food Sweetener Market Volume (K Tons) Forecast, by Application 2019 & 2032
- Table 23: United Kingdom MEA Food Sweetener Market Revenue (Million) Forecast, by Application 2019 & 2032
- Table 24: United Kingdom MEA Food Sweetener Market Volume (K Tons) Forecast, by Application 2019 & 2032
- Table 25: France MEA Food Sweetener Market Revenue (Million) Forecast, by Application 2019 & 2032
- Table 26: France MEA Food Sweetener Market Volume (K Tons) Forecast, by Application 2019 & 2032
- Table 27: Spain MEA Food Sweetener Market Revenue (Million) Forecast, by Application 2019 & 2032
- Table 28: Spain MEA Food Sweetener Market Volume (K Tons) Forecast, by Application 2019 & 2032
- Table 29: Italy MEA Food Sweetener Market Revenue (Million) Forecast, by Application 2019 & 2032
- Table 30: Italy MEA Food Sweetener Market Volume (K Tons) Forecast, by Application 2019 & 2032
- Table 31: Spain MEA Food Sweetener Market Revenue (Million) Forecast, by Application 2019 & 2032
- Table 32: Spain MEA Food Sweetener Market Volume (K Tons) Forecast, by Application 2019 & 2032
- Table 33: Belgium MEA Food Sweetener Market Revenue (Million) Forecast, by Application 2019 & 2032
- Table 34: Belgium MEA Food Sweetener Market Volume (K Tons) Forecast, by Application 2019 & 2032
- Table 35: Netherland MEA Food Sweetener Market Revenue (Million) Forecast, by Application 2019 & 2032
- Table 36: Netherland MEA Food Sweetener Market Volume (K Tons) Forecast, by Application 2019 & 2032
- Table 37: Nordics MEA Food Sweetener Market Revenue (Million) Forecast, by Application 2019 & 2032
- Table 38: Nordics MEA Food Sweetener Market Volume (K Tons) Forecast, by Application 2019 & 2032
- Table 39: Rest of Europe MEA Food Sweetener Market Revenue (Million) Forecast, by Application 2019 & 2032
- Table 40: Rest of Europe MEA Food Sweetener Market Volume (K Tons) Forecast, by Application 2019 & 2032
- Table 41: Global MEA Food Sweetener Market Revenue Million Forecast, by Country 2019 & 2032
- Table 42: Global MEA Food Sweetener Market Volume K Tons Forecast, by Country 2019 & 2032
- Table 43: China MEA Food Sweetener Market Revenue (Million) Forecast, by Application 2019 & 2032
- Table 44: China MEA Food Sweetener Market Volume (K Tons) Forecast, by Application 2019 & 2032
- Table 45: Japan MEA Food Sweetener Market Revenue (Million) Forecast, by Application 2019 & 2032
- Table 46: Japan MEA Food Sweetener Market Volume (K Tons) Forecast, by Application 2019 & 2032
- Table 47: India MEA Food Sweetener Market Revenue (Million) Forecast, by Application 2019 & 2032
- Table 48: India MEA Food Sweetener Market Volume (K Tons) Forecast, by Application 2019 & 2032
- Table 49: South Korea MEA Food Sweetener Market Revenue (Million) Forecast, by Application 2019 & 2032
- Table 50: South Korea MEA Food Sweetener Market Volume (K Tons) Forecast, by Application 2019 & 2032
- Table 51: Southeast Asia MEA Food Sweetener Market Revenue (Million) Forecast, by Application 2019 & 2032
- Table 52: Southeast Asia MEA Food Sweetener Market Volume (K Tons) Forecast, by Application 2019 & 2032
- Table 53: Australia MEA Food Sweetener Market Revenue (Million) Forecast, by Application 2019 & 2032
- Table 54: Australia MEA Food Sweetener Market Volume (K Tons) Forecast, by Application 2019 & 2032
- Table 55: Indonesia MEA Food Sweetener Market Revenue (Million) Forecast, by Application 2019 & 2032
- Table 56: Indonesia MEA Food Sweetener Market Volume (K Tons) Forecast, by Application 2019 & 2032
- Table 57: Phillipes MEA Food Sweetener Market Revenue (Million) Forecast, by Application 2019 & 2032
- Table 58: Phillipes MEA Food Sweetener Market Volume (K Tons) Forecast, by Application 2019 & 2032
- Table 59: Singapore MEA Food Sweetener Market Revenue (Million) Forecast, by Application 2019 & 2032
- Table 60: Singapore MEA Food Sweetener Market Volume (K Tons) Forecast, by Application 2019 & 2032
- Table 61: Thailandc MEA Food Sweetener Market Revenue (Million) Forecast, by Application 2019 & 2032
- Table 62: Thailandc MEA Food Sweetener Market Volume (K Tons) Forecast, by Application 2019 & 2032
- Table 63: Rest of Asia Pacific MEA Food Sweetener Market Revenue (Million) Forecast, by Application 2019 & 2032
- Table 64: Rest of Asia Pacific MEA Food Sweetener Market Volume (K Tons) Forecast, by Application 2019 & 2032
- Table 65: Global MEA Food Sweetener Market Revenue Million Forecast, by Country 2019 & 2032
- Table 66: Global MEA Food Sweetener Market Volume K Tons Forecast, by Country 2019 & 2032
- Table 67: Brazil MEA Food Sweetener Market Revenue (Million) Forecast, by Application 2019 & 2032
- Table 68: Brazil MEA Food Sweetener Market Volume (K Tons) Forecast, by Application 2019 & 2032
- Table 69: Argentina MEA Food Sweetener Market Revenue (Million) Forecast, by Application 2019 & 2032
- Table 70: Argentina MEA Food Sweetener Market Volume (K Tons) Forecast, by Application 2019 & 2032
- Table 71: Peru MEA Food Sweetener Market Revenue (Million) Forecast, by Application 2019 & 2032
- Table 72: Peru MEA Food Sweetener Market Volume (K Tons) Forecast, by Application 2019 & 2032
- Table 73: Chile MEA Food Sweetener Market Revenue (Million) Forecast, by Application 2019 & 2032
- Table 74: Chile MEA Food Sweetener Market Volume (K Tons) Forecast, by Application 2019 & 2032
- Table 75: Colombia MEA Food Sweetener Market Revenue (Million) Forecast, by Application 2019 & 2032
- Table 76: Colombia MEA Food Sweetener Market Volume (K Tons) Forecast, by Application 2019 & 2032
- Table 77: Ecuador MEA Food Sweetener Market Revenue (Million) Forecast, by Application 2019 & 2032
- Table 78: Ecuador MEA Food Sweetener Market Volume (K Tons) Forecast, by Application 2019 & 2032
- Table 79: Venezuela MEA Food Sweetener Market Revenue (Million) Forecast, by Application 2019 & 2032
- Table 80: Venezuela MEA Food Sweetener Market Volume (K Tons) Forecast, by Application 2019 & 2032
- Table 81: Rest of South America MEA Food Sweetener Market Revenue (Million) Forecast, by Application 2019 & 2032
- Table 82: Rest of South America MEA Food Sweetener Market Volume (K Tons) Forecast, by Application 2019 & 2032
- Table 83: Global MEA Food Sweetener Market Revenue Million Forecast, by Country 2019 & 2032
- Table 84: Global MEA Food Sweetener Market Volume K Tons Forecast, by Country 2019 & 2032
- Table 85: United States MEA Food Sweetener Market Revenue (Million) Forecast, by Application 2019 & 2032
- Table 86: United States MEA Food Sweetener Market Volume (K Tons) Forecast, by Application 2019 & 2032
- Table 87: Canada MEA Food Sweetener Market Revenue (Million) Forecast, by Application 2019 & 2032
- Table 88: Canada MEA Food Sweetener Market Volume (K Tons) Forecast, by Application 2019 & 2032
- Table 89: Mexico MEA Food Sweetener Market Revenue (Million) Forecast, by Application 2019 & 2032
- Table 90: Mexico MEA Food Sweetener Market Volume (K Tons) Forecast, by Application 2019 & 2032
- Table 91: Global MEA Food Sweetener Market Revenue Million Forecast, by Country 2019 & 2032
- Table 92: Global MEA Food Sweetener Market Volume K Tons Forecast, by Country 2019 & 2032
- Table 93: United Arab Emirates MEA Food Sweetener Market Revenue (Million) Forecast, by Application 2019 & 2032
- Table 94: United Arab Emirates MEA Food Sweetener Market Volume (K Tons) Forecast, by Application 2019 & 2032
- Table 95: Saudi Arabia MEA Food Sweetener Market Revenue (Million) Forecast, by Application 2019 & 2032
- Table 96: Saudi Arabia MEA Food Sweetener Market Volume (K Tons) Forecast, by Application 2019 & 2032
- Table 97: South Africa MEA Food Sweetener Market Revenue (Million) Forecast, by Application 2019 & 2032
- Table 98: South Africa MEA Food Sweetener Market Volume (K Tons) Forecast, by Application 2019 & 2032
- Table 99: Rest of Middle East and Africa MEA Food Sweetener Market Revenue (Million) Forecast, by Application 2019 & 2032
- Table 100: Rest of Middle East and Africa MEA Food Sweetener Market Volume (K Tons) Forecast, by Application 2019 & 2032
- Table 101: Global MEA Food Sweetener Market Revenue Million Forecast, by Product Type 2019 & 2032
- Table 102: Global MEA Food Sweetener Market Volume K Tons Forecast, by Product Type 2019 & 2032
- Table 103: Global MEA Food Sweetener Market Revenue Million Forecast, by Application 2019 & 2032
- Table 104: Global MEA Food Sweetener Market Volume K Tons Forecast, by Application 2019 & 2032
- Table 105: Global MEA Food Sweetener Market Revenue Million Forecast, by Geography 2019 & 2032
- Table 106: Global MEA Food Sweetener Market Volume K Tons Forecast, by Geography 2019 & 2032
- Table 107: Global MEA Food Sweetener Market Revenue Million Forecast, by Country 2019 & 2032
- Table 108: Global MEA Food Sweetener Market Volume K Tons Forecast, by Country 2019 & 2032
- Table 109: Global MEA Food Sweetener Market Revenue Million Forecast, by Product Type 2019 & 2032
- Table 110: Global MEA Food Sweetener Market Volume K Tons Forecast, by Product Type 2019 & 2032
- Table 111: Global MEA Food Sweetener Market Revenue Million Forecast, by Application 2019 & 2032
- Table 112: Global MEA Food Sweetener Market Volume K Tons Forecast, by Application 2019 & 2032
- Table 113: Global MEA Food Sweetener Market Revenue Million Forecast, by Geography 2019 & 2032
- Table 114: Global MEA Food Sweetener Market Volume K Tons Forecast, by Geography 2019 & 2032
- Table 115: Global MEA Food Sweetener Market Revenue Million Forecast, by Country 2019 & 2032
- Table 116: Global MEA Food Sweetener Market Volume K Tons Forecast, by Country 2019 & 2032
Frequently Asked Questions
1. What is the projected Compound Annual Growth Rate (CAGR) of the MEA Food Sweetener Market?
The projected CAGR is approximately 3.92%.
2. Which companies are prominent players in the MEA Food Sweetener Market?
Key companies in the market include Cargill Incorporated, GLG Life Tech Corporation, PureCircle Limited, Archer Daniels Midland Company, Ajinomoto Co Inc, Tate & Lyle PLC, Ingredion Incorporated, Tereos S A *List Not Exhaustive.
3. What are the main segments of the MEA Food Sweetener Market?
The market segments include Product Type, Application, Geography.
4. Can you provide details about the market size?
The market size is estimated to be USD XX Million as of 2022.
5. What are some drivers contributing to market growth?
Shift towards Natural Sweeteners.
6. What are the notable trends driving market growth?
South Africa is one of the Largest Market.
7. Are there any restraints impacting market growth?
Health Concerns Related to Sweetener Consumption.
8. Can you provide examples of recent developments in the market?
N/A
9. What pricing options are available for accessing the report?
Pricing options include single-user, multi-user, and enterprise licenses priced at USD 4750, USD 5250, and USD 8750 respectively.
10. Is the market size provided in terms of value or volume?
The market size is provided in terms of value, measured in Million and volume, measured in K Tons.
11. Are there any specific market keywords associated with the report?
Yes, the market keyword associated with the report is "MEA Food Sweetener Market," which aids in identifying and referencing the specific market segment covered.
12. How do I determine which pricing option suits my needs best?
The pricing options vary based on user requirements and access needs. Individual users may opt for single-user licenses, while businesses requiring broader access may choose multi-user or enterprise licenses for cost-effective access to the report.
13. Are there any additional resources or data provided in the MEA Food Sweetener Market report?
While the report offers comprehensive insights, it's advisable to review the specific contents or supplementary materials provided to ascertain if additional resources or data are available.
14. How can I stay updated on further developments or reports in the MEA Food Sweetener Market?
To stay informed about further developments, trends, and reports in the MEA Food Sweetener Market, consider subscribing to industry newsletters, following relevant companies and organizations, or regularly checking reputable industry news sources and publications.
Methodology
Step 1 - Identification of Relevant Samples Size from Population Database


Step 2 - Approaches for Defining Global Market Size (Value, Volume* & Price*)

Note*: In applicable scenarios
Step 3 - Data Sources
Primary Research
- Web Analytics
- Survey Reports
- Research Institute
- Latest Research Reports
- Opinion Leaders
Secondary Research
- Annual Reports
- White Paper
- Latest Press Release
- Industry Association
- Paid Database
- Investor Presentations

Step 4 - Data Triangulation
Involves using different sources of information in order to increase the validity of a study
These sources are likely to be stakeholders in a program - participants, other researchers, program staff, other community members, and so on.
Then we put all data in single framework & apply various statistical tools to find out the dynamic on the market.
During the analysis stage, feedback from the stakeholder groups would be compared to determine areas of agreement as well as areas of divergence


