USA Blueberry Market Analysis Uncovered: Market Drivers and Forecasts 2025-2033

USA Blueberry Market by Production Analysis, by Consumption Analysis, by Import Market Analysis (Value & Volume), by Export Market Analysis (Value & Volume), by Price Trend Analysis, by North America (United States, Canada, Mexico), by South America (Brazil, Argentina, Rest of South America), by Europe (United Kingdom, Germany, France, Italy, Spain, Russia, Benelux, Nordics, Rest of Europe), by Middle East & Africa (Turkey, Israel, GCC, North Africa, South Africa, Rest of Middle East & Africa), by Asia Pacific (China, India, Japan, South Korea, ASEAN, Oceania, Rest of Asia Pacific) Forecast 2025-2033

Jun 27 2025
Base Year: 2024

180 Pages
Main Logo

USA Blueberry Market Analysis Uncovered: Market Drivers and Forecasts 2025-2033


Home
Industries
Agriculture
sponsor image

Tailored for you

  • In-depth Analysis Tailored to Specified Regions or Segments
  • Company Profiles Customized to User Preferences
  • Comprehensive Insights Focused on Specific Segments or Regions
  • Customized Evaluation of Competitive Landscape to Meet Your Needs
  • Tailored Customization to Address Other Specific Requirements
Ask for customization


Key Insights

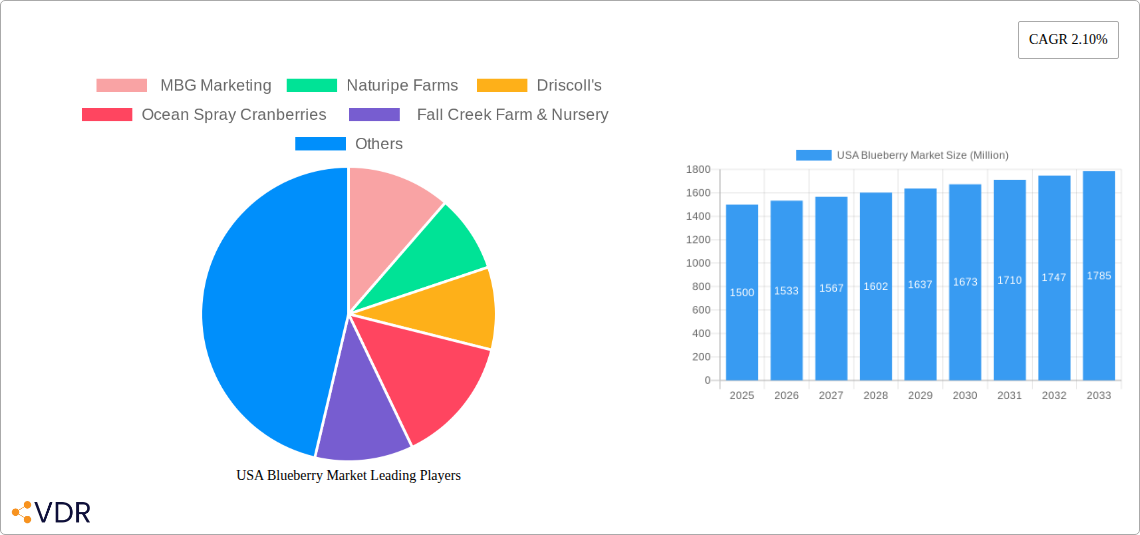
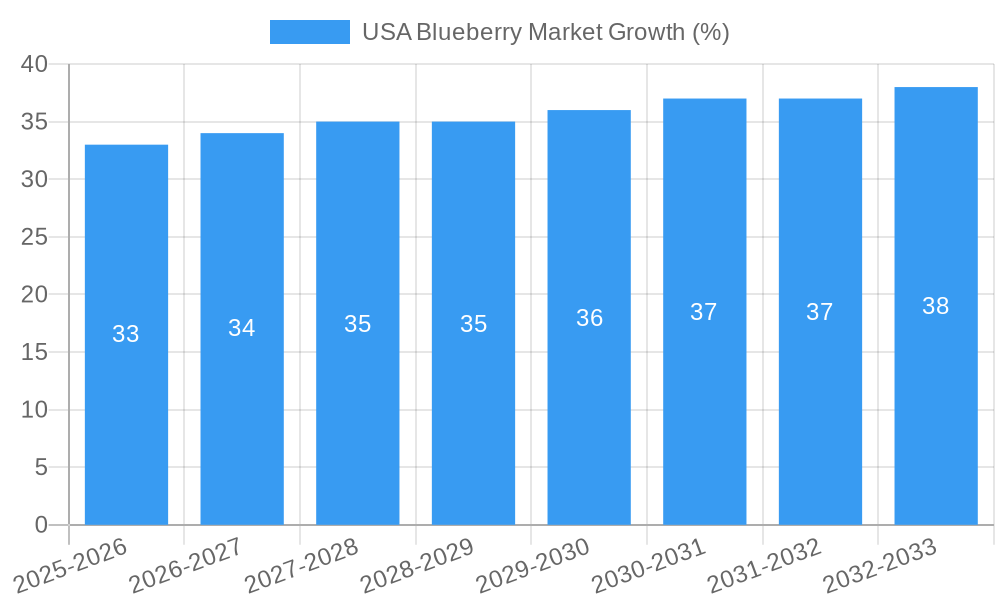
The USA blueberry market, valued at approximately $1.5 billion in 2025, is projected to experience steady growth, driven by increasing consumer demand for healthy and functional foods. The market's Compound Annual Growth Rate (CAGR) of 2.10% from 2025 to 2033 indicates a consistent expansion, primarily fueled by the rising popularity of blueberries in various applications, including the food and beverage industry (where they are used in jams, juices, yogurts, and baked goods), the pharmaceuticals sector (leveraging their antioxidant properties), and the cosmetics industry (utilizing their skin-beneficial components). Growth within the fresh blueberry segment is expected to be particularly strong due to increasing consumer preference for minimally processed, high-quality produce. However, factors such as weather conditions impacting crop yields and fluctuating prices due to supply chain challenges present potential restraints to market expansion. Major players like Naturipe Farms, Driscoll's, and Ocean Spray Cranberries are significantly influencing market dynamics through their production, distribution networks, and innovative product offerings.

The North American region, particularly the United States, dominates the market due to significant domestic production and consumption. The frozen blueberry segment is anticipated to maintain a substantial market share owing to its extended shelf life and convenience. Market segmentation by product type (fresh, frozen, dried) and application (food & beverage, pharmaceuticals, cosmetics) provides a comprehensive understanding of the diverse end-use applications and the specific needs and preferences of various consumer groups. Future growth will likely be influenced by advancements in farming techniques, improved logistics and supply chain infrastructure, and the expansion of innovative blueberry-based products targeting health-conscious consumers. The market's steady expansion, albeit at a moderate pace, suggests a stable investment opportunity for stakeholders with a long-term perspective.

USA Blueberry Market Research Report - Market Size, Growth & Forecast

USA Blueberry Market: A Comprehensive Market Report (2019-2033)

This in-depth report provides a comprehensive analysis of the USA blueberry market, encompassing market dynamics, growth trends, regional dominance, product landscape, key players, and future outlook. The study period covers 2019-2033, with a base year of 2025 and a forecast period of 2025-2033. This report is invaluable for industry professionals, investors, and anyone seeking to understand the intricacies of this dynamic market. The report analyzes the parent market (Fruits Market) and the child market (Berries Market) to provide a holistic perspective.

USA Blueberry Market Market Dynamics & Structure

The USA blueberry market is characterized by a moderately concentrated landscape with key players competing on factors such as product quality, innovation, and distribution networks. Technological advancements in cultivation, processing, and packaging are driving market growth, while stringent regulatory frameworks related to food safety and sustainability influence market practices. The market is witnessing increased mergers and acquisitions (M&A) activity as larger companies seek to consolidate their market share and expand their product portfolios. The increasing demand for healthy and convenient snacks fuels the market's growth, though competition from substitute fruits and berries presents a challenge.

  • Market Concentration: The top 5 players account for approximately xx% of the market share in 2025.
  • Technological Innovation: Precision agriculture techniques, improved processing methods for frozen and dried blueberries, and innovative packaging solutions are key drivers.
  • Regulatory Framework: FDA regulations pertaining to food safety and labeling are crucial considerations.
  • Competitive Substitutes: Other berries (strawberries, raspberries) and fruits compete for consumer preference.
  • M&A Activity: xx M&A deals were recorded in the blueberry market between 2019 and 2024.
  • End-User Demographics: Health-conscious consumers, particularly millennials and Gen Z, represent key target demographics.

USA Blueberry Market Growth Trends & Insights

The USA blueberry market has experienced significant growth over the past five years, driven by rising consumer demand, increasing health awareness, and expanding applications in the food and beverage industry. The market size is projected to reach xx Million units by 2025, exhibiting a Compound Annual Growth Rate (CAGR) of xx% during the forecast period. Technological innovations, such as improved varieties offering higher yields and enhanced flavor profiles, are further accelerating market expansion. Consumer preference shifts towards convenient and readily available healthy options are key factors in the market's upward trajectory. Market penetration is expected to reach xx% by 2033.

USA Blueberry Market Growth

Dominant Regions, Countries, or Segments in USA Blueberry Market

The fresh blueberry segment holds the largest market share by product type, driven by increasing consumer preference for fresh produce. Geographically, the Northwest region is a dominant player due to favorable climatic conditions and established production infrastructure. Within applications, the food and beverage sector dominates due to the versatile use of blueberries in various products, from jams and juices to baked goods and yogurt.

  • Key Drivers for Fresh Blueberries: Favorable growing conditions in specific regions, increased demand for fresh produce, strong distribution networks.
  • Key Drivers for Food & Beverage Application: Expanding processed food industry, growing demand for functional foods and beverages, versatile application in diverse food items.
  • Market Share: The Northwest region holds approximately xx% of the total market share in 2025.

USA Blueberry Market Product Landscape

The USA blueberry market offers diverse product forms, including fresh, frozen, and dried blueberries, catering to various consumer preferences and applications. Recent innovations focus on extending shelf life, improving flavor profiles, and enhancing convenience, such as single-serve packaging options. Product differentiation strategies, focusing on unique flavors, organic certifications, and sustainably sourced berries, are gaining traction.

Key Drivers, Barriers & Challenges in USA Blueberry Market

Key Drivers: Increasing consumer demand for healthy snacks, expanding applications in various sectors, technological advancements in cultivation and processing.

Key Challenges: Fluctuating weather patterns impacting yields, increasing production costs, intense competition among existing players, and maintaining consistent product quality. Supply chain disruptions caused losses of xx Million units in 2022.

Emerging Opportunities in USA Blueberry Market

Emerging opportunities lie in the development of novel food products using blueberries, the exploration of untapped markets both domestically and internationally, and the increasing demand for organic and sustainably produced blueberries. Expanding applications in the nutraceutical and cosmetic industries present further opportunities for growth.

Growth Accelerators in the USA Blueberry Market Industry

Strategic partnerships between growers, processors, and retailers are driving growth, alongside the integration of advanced technologies such as precision agriculture and automation in the production process. Continued research and development efforts aimed at improving blueberry varieties and extending shelf life are expected to fuel long-term growth.

Key Players Shaping the USA Blueberry Market Market

  • MBG Marketing
  • Naturipe Farms
  • Driscoll's
  • Ocean Spray Cranberries
  • Fall Creek Farm & Nursery

Notable Milestones in USA Blueberry Market Sector

  • June 2022: USHBC forecasts a 10.4% increase in blueberry production, reaching 328,940 metric tons. 185,700 metric tons are expected to be sold fresh, and 143,240 metric tons as processed products.
  • June 2021: USHBC expands its programming in India to promote blueberries.

In-Depth USA Blueberry Market Market Outlook

The USA blueberry market exhibits robust growth potential over the next decade, driven by a combination of factors including growing consumer health consciousness, innovative product development, and expansion into new markets. Strategic partnerships and investments in technology will play a crucial role in shaping the market's future trajectory. The market is poised for sustained growth, with opportunities for market expansion and increased product diversification.

USA Blueberry Market Segmentation

  • 1. Production Analysis
  • 2. Consumption Analysis
  • 3. Import Market Analysis (Value & Volume)
  • 4. Export Market Analysis (Value & Volume)
  • 5. Price Trend Analysis

USA Blueberry Market Segmentation By Geography

  • 1. North America
    • 1.1. United States
    • 1.2. Canada
    • 1.3. Mexico
  • 2. South America
    • 2.1. Brazil
    • 2.2. Argentina
    • 2.3. Rest of South America
  • 3. Europe
    • 3.1. United Kingdom
    • 3.2. Germany
    • 3.3. France
    • 3.4. Italy
    • 3.5. Spain
    • 3.6. Russia
    • 3.7. Benelux
    • 3.8. Nordics
    • 3.9. Rest of Europe
  • 4. Middle East & Africa
    • 4.1. Turkey
    • 4.2. Israel
    • 4.3. GCC
    • 4.4. North Africa
    • 4.5. South Africa
    • 4.6. Rest of Middle East & Africa
  • 5. Asia Pacific
    • 5.1. China
    • 5.2. India
    • 5.3. Japan
    • 5.4. South Korea
    • 5.5. ASEAN
    • 5.6. Oceania
    • 5.7. Rest of Asia Pacific
USA Blueberry Market Regional Share


USA Blueberry Market REPORT HIGHLIGHTS

AspectsDetails
Study Period 2019-2033
Base Year 2024
Estimated Year 2025
Forecast Period2025-2033
Historical Period2019-2024
Growth RateCAGR of 2.10% from 2019-2033
Segmentation
    • By Production Analysis
    • By Consumption Analysis
    • By Import Market Analysis (Value & Volume)
    • By Export Market Analysis (Value & Volume)
    • By Price Trend Analysis
  • By Geography
    • North America
      • United States
      • Canada
      • Mexico
    • South America
      • Brazil
      • Argentina
      • Rest of South America
    • Europe
      • United Kingdom
      • Germany
      • France
      • Italy
      • Spain
      • Russia
      • Benelux
      • Nordics
      • Rest of Europe
    • Middle East & Africa
      • Turkey
      • Israel
      • GCC
      • North Africa
      • South Africa
      • Rest of Middle East & Africa
    • Asia Pacific
      • China
      • India
      • Japan
      • South Korea
      • ASEAN
      • Oceania
      • Rest of Asia Pacific


Table of Contents

  1. 1. Introduction
    • 1.1. Research Scope
    • 1.2. Market Segmentation
    • 1.3. Research Methodology
    • 1.4. Definitions and Assumptions
  2. 2. Executive Summary
    • 2.1. Introduction
  3. 3. Market Dynamics
    • 3.1. Introduction
      • 3.2. Market Drivers
        • 3.2.1. ; Awareness About Health Benefits Associated With Pecan Consumption; Wide Application of Pecan
      • 3.3. Market Restrains
        • 3.3.1. ; Volatility in the Prices; Adverse Weather Conditions Affecting Yield
      • 3.4. Market Trends
        • 3.4.1. Increasing Blueberry Production to create more Export Opportunities
  4. 4. Market Factor Analysis
    • 4.1. Porters Five Forces
    • 4.2. Supply/Value Chain
    • 4.3. PESTEL analysis
    • 4.4. Market Entropy
    • 4.5. Patent/Trademark Analysis
  5. 5. Global USA Blueberry Market Analysis, Insights and Forecast, 2019-2031
    • 5.1. Market Analysis, Insights and Forecast - by Production Analysis
      • 5.2. Market Analysis, Insights and Forecast - by Consumption Analysis
        • 5.3. Market Analysis, Insights and Forecast - by Import Market Analysis (Value & Volume)
          • 5.4. Market Analysis, Insights and Forecast - by Export Market Analysis (Value & Volume)
            • 5.5. Market Analysis, Insights and Forecast - by Price Trend Analysis
              • 5.6. Market Analysis, Insights and Forecast - by Region
                • 5.6.1. North America
                • 5.6.2. South America
                • 5.6.3. Europe
                • 5.6.4. Middle East & Africa
                • 5.6.5. Asia Pacific
            • 6. North America USA Blueberry Market Analysis, Insights and Forecast, 2019-2031
              • 6.1. Market Analysis, Insights and Forecast - by Production Analysis
                • 6.2. Market Analysis, Insights and Forecast - by Consumption Analysis
                  • 6.3. Market Analysis, Insights and Forecast - by Import Market Analysis (Value & Volume)
                    • 6.4. Market Analysis, Insights and Forecast - by Export Market Analysis (Value & Volume)
                      • 6.5. Market Analysis, Insights and Forecast - by Price Trend Analysis
                      • 7. South America USA Blueberry Market Analysis, Insights and Forecast, 2019-2031
                        • 7.1. Market Analysis, Insights and Forecast - by Production Analysis
                          • 7.2. Market Analysis, Insights and Forecast - by Consumption Analysis
                            • 7.3. Market Analysis, Insights and Forecast - by Import Market Analysis (Value & Volume)
                              • 7.4. Market Analysis, Insights and Forecast - by Export Market Analysis (Value & Volume)
                                • 7.5. Market Analysis, Insights and Forecast - by Price Trend Analysis
                                • 8. Europe USA Blueberry Market Analysis, Insights and Forecast, 2019-2031
                                  • 8.1. Market Analysis, Insights and Forecast - by Production Analysis
                                    • 8.2. Market Analysis, Insights and Forecast - by Consumption Analysis
                                      • 8.3. Market Analysis, Insights and Forecast - by Import Market Analysis (Value & Volume)
                                        • 8.4. Market Analysis, Insights and Forecast - by Export Market Analysis (Value & Volume)
                                          • 8.5. Market Analysis, Insights and Forecast - by Price Trend Analysis
                                          • 9. Middle East & Africa USA Blueberry Market Analysis, Insights and Forecast, 2019-2031
                                            • 9.1. Market Analysis, Insights and Forecast - by Production Analysis
                                              • 9.2. Market Analysis, Insights and Forecast - by Consumption Analysis
                                                • 9.3. Market Analysis, Insights and Forecast - by Import Market Analysis (Value & Volume)
                                                  • 9.4. Market Analysis, Insights and Forecast - by Export Market Analysis (Value & Volume)
                                                    • 9.5. Market Analysis, Insights and Forecast - by Price Trend Analysis
                                                    • 10. Asia Pacific USA Blueberry Market Analysis, Insights and Forecast, 2019-2031
                                                      • 10.1. Market Analysis, Insights and Forecast - by Production Analysis
                                                        • 10.2. Market Analysis, Insights and Forecast - by Consumption Analysis
                                                          • 10.3. Market Analysis, Insights and Forecast - by Import Market Analysis (Value & Volume)
                                                            • 10.4. Market Analysis, Insights and Forecast - by Export Market Analysis (Value & Volume)
                                                              • 10.5. Market Analysis, Insights and Forecast - by Price Trend Analysis
                                                              • 11. United States USA Blueberry Market Analysis, Insights and Forecast, 2019-2031
                                                                • 12. Canada USA Blueberry Market Analysis, Insights and Forecast, 2019-2031
                                                                  • 13. Mexico USA Blueberry Market Analysis, Insights and Forecast, 2019-2031
                                                                    • 14. Competitive Analysis
                                                                      • 14.1. Global Market Share Analysis 2024
                                                                        • 14.2. Company Profiles
                                                                          • 14.2.1 MBG Marketing
                                                                            • 14.2.1.1. Overview
                                                                            • 14.2.1.2. Products
                                                                            • 14.2.1.3. SWOT Analysis
                                                                            • 14.2.1.4. Recent Developments
                                                                            • 14.2.1.5. Financials (Based on Availability)
                                                                          • 14.2.2 Naturipe Farms
                                                                            • 14.2.2.1. Overview
                                                                            • 14.2.2.2. Products
                                                                            • 14.2.2.3. SWOT Analysis
                                                                            • 14.2.2.4. Recent Developments
                                                                            • 14.2.2.5. Financials (Based on Availability)
                                                                          • 14.2.3 Driscoll's
                                                                            • 14.2.3.1. Overview
                                                                            • 14.2.3.2. Products
                                                                            • 14.2.3.3. SWOT Analysis
                                                                            • 14.2.3.4. Recent Developments
                                                                            • 14.2.3.5. Financials (Based on Availability)
                                                                          • 14.2.4 Ocean Spray Cranberries
                                                                            • 14.2.4.1. Overview
                                                                            • 14.2.4.2. Products
                                                                            • 14.2.4.3. SWOT Analysis
                                                                            • 14.2.4.4. Recent Developments
                                                                            • 14.2.4.5. Financials (Based on Availability)
                                                                          • 14.2.5 Fall Creek Farm & Nursery
                                                                            • 14.2.5.1. Overview
                                                                            • 14.2.5.2. Products
                                                                            • 14.2.5.3. SWOT Analysis
                                                                            • 14.2.5.4. Recent Developments
                                                                            • 14.2.5.5. Financials (Based on Availability)

                                                                    List of Figures

                                                                    1. Figure 1: Global USA Blueberry Market Revenue Breakdown (Million, %) by Region 2024 & 2032
                                                                    2. Figure 2: Global USA Blueberry Market Volume Breakdown (Kiloton, %) by Region 2024 & 2032
                                                                    3. Figure 3: North America USA Blueberry Market Revenue (Million), by Country 2024 & 2032
                                                                    4. Figure 4: North America USA Blueberry Market Volume (Kiloton), by Country 2024 & 2032
                                                                    5. Figure 5: North America USA Blueberry Market Revenue Share (%), by Country 2024 & 2032
                                                                    6. Figure 6: North America USA Blueberry Market Volume Share (%), by Country 2024 & 2032
                                                                    7. Figure 7: North America USA Blueberry Market Revenue (Million), by Production Analysis 2024 & 2032
                                                                    8. Figure 8: North America USA Blueberry Market Volume (Kiloton), by Production Analysis 2024 & 2032
                                                                    9. Figure 9: North America USA Blueberry Market Revenue Share (%), by Production Analysis 2024 & 2032
                                                                    10. Figure 10: North America USA Blueberry Market Volume Share (%), by Production Analysis 2024 & 2032
                                                                    11. Figure 11: North America USA Blueberry Market Revenue (Million), by Consumption Analysis 2024 & 2032
                                                                    12. Figure 12: North America USA Blueberry Market Volume (Kiloton), by Consumption Analysis 2024 & 2032
                                                                    13. Figure 13: North America USA Blueberry Market Revenue Share (%), by Consumption Analysis 2024 & 2032
                                                                    14. Figure 14: North America USA Blueberry Market Volume Share (%), by Consumption Analysis 2024 & 2032
                                                                    15. Figure 15: North America USA Blueberry Market Revenue (Million), by Import Market Analysis (Value & Volume) 2024 & 2032
                                                                    16. Figure 16: North America USA Blueberry Market Volume (Kiloton), by Import Market Analysis (Value & Volume) 2024 & 2032
                                                                    17. Figure 17: North America USA Blueberry Market Revenue Share (%), by Import Market Analysis (Value & Volume) 2024 & 2032
                                                                    18. Figure 18: North America USA Blueberry Market Volume Share (%), by Import Market Analysis (Value & Volume) 2024 & 2032
                                                                    19. Figure 19: North America USA Blueberry Market Revenue (Million), by Export Market Analysis (Value & Volume) 2024 & 2032
                                                                    20. Figure 20: North America USA Blueberry Market Volume (Kiloton), by Export Market Analysis (Value & Volume) 2024 & 2032
                                                                    21. Figure 21: North America USA Blueberry Market Revenue Share (%), by Export Market Analysis (Value & Volume) 2024 & 2032
                                                                    22. Figure 22: North America USA Blueberry Market Volume Share (%), by Export Market Analysis (Value & Volume) 2024 & 2032
                                                                    23. Figure 23: North America USA Blueberry Market Revenue (Million), by Price Trend Analysis 2024 & 2032
                                                                    24. Figure 24: North America USA Blueberry Market Volume (Kiloton), by Price Trend Analysis 2024 & 2032
                                                                    25. Figure 25: North America USA Blueberry Market Revenue Share (%), by Price Trend Analysis 2024 & 2032
                                                                    26. Figure 26: North America USA Blueberry Market Volume Share (%), by Price Trend Analysis 2024 & 2032
                                                                    27. Figure 27: North America USA Blueberry Market Revenue (Million), by Country 2024 & 2032
                                                                    28. Figure 28: North America USA Blueberry Market Volume (Kiloton), by Country 2024 & 2032
                                                                    29. Figure 29: North America USA Blueberry Market Revenue Share (%), by Country 2024 & 2032
                                                                    30. Figure 30: North America USA Blueberry Market Volume Share (%), by Country 2024 & 2032
                                                                    31. Figure 31: South America USA Blueberry Market Revenue (Million), by Production Analysis 2024 & 2032
                                                                    32. Figure 32: South America USA Blueberry Market Volume (Kiloton), by Production Analysis 2024 & 2032
                                                                    33. Figure 33: South America USA Blueberry Market Revenue Share (%), by Production Analysis 2024 & 2032
                                                                    34. Figure 34: South America USA Blueberry Market Volume Share (%), by Production Analysis 2024 & 2032
                                                                    35. Figure 35: South America USA Blueberry Market Revenue (Million), by Consumption Analysis 2024 & 2032
                                                                    36. Figure 36: South America USA Blueberry Market Volume (Kiloton), by Consumption Analysis 2024 & 2032
                                                                    37. Figure 37: South America USA Blueberry Market Revenue Share (%), by Consumption Analysis 2024 & 2032
                                                                    38. Figure 38: South America USA Blueberry Market Volume Share (%), by Consumption Analysis 2024 & 2032
                                                                    39. Figure 39: South America USA Blueberry Market Revenue (Million), by Import Market Analysis (Value & Volume) 2024 & 2032
                                                                    40. Figure 40: South America USA Blueberry Market Volume (Kiloton), by Import Market Analysis (Value & Volume) 2024 & 2032
                                                                    41. Figure 41: South America USA Blueberry Market Revenue Share (%), by Import Market Analysis (Value & Volume) 2024 & 2032
                                                                    42. Figure 42: South America USA Blueberry Market Volume Share (%), by Import Market Analysis (Value & Volume) 2024 & 2032
                                                                    43. Figure 43: South America USA Blueberry Market Revenue (Million), by Export Market Analysis (Value & Volume) 2024 & 2032
                                                                    44. Figure 44: South America USA Blueberry Market Volume (Kiloton), by Export Market Analysis (Value & Volume) 2024 & 2032
                                                                    45. Figure 45: South America USA Blueberry Market Revenue Share (%), by Export Market Analysis (Value & Volume) 2024 & 2032
                                                                    46. Figure 46: South America USA Blueberry Market Volume Share (%), by Export Market Analysis (Value & Volume) 2024 & 2032
                                                                    47. Figure 47: South America USA Blueberry Market Revenue (Million), by Price Trend Analysis 2024 & 2032
                                                                    48. Figure 48: South America USA Blueberry Market Volume (Kiloton), by Price Trend Analysis 2024 & 2032
                                                                    49. Figure 49: South America USA Blueberry Market Revenue Share (%), by Price Trend Analysis 2024 & 2032
                                                                    50. Figure 50: South America USA Blueberry Market Volume Share (%), by Price Trend Analysis 2024 & 2032
                                                                    51. Figure 51: South America USA Blueberry Market Revenue (Million), by Country 2024 & 2032
                                                                    52. Figure 52: South America USA Blueberry Market Volume (Kiloton), by Country 2024 & 2032
                                                                    53. Figure 53: South America USA Blueberry Market Revenue Share (%), by Country 2024 & 2032
                                                                    54. Figure 54: South America USA Blueberry Market Volume Share (%), by Country 2024 & 2032
                                                                    55. Figure 55: Europe USA Blueberry Market Revenue (Million), by Production Analysis 2024 & 2032
                                                                    56. Figure 56: Europe USA Blueberry Market Volume (Kiloton), by Production Analysis 2024 & 2032
                                                                    57. Figure 57: Europe USA Blueberry Market Revenue Share (%), by Production Analysis 2024 & 2032
                                                                    58. Figure 58: Europe USA Blueberry Market Volume Share (%), by Production Analysis 2024 & 2032
                                                                    59. Figure 59: Europe USA Blueberry Market Revenue (Million), by Consumption Analysis 2024 & 2032
                                                                    60. Figure 60: Europe USA Blueberry Market Volume (Kiloton), by Consumption Analysis 2024 & 2032
                                                                    61. Figure 61: Europe USA Blueberry Market Revenue Share (%), by Consumption Analysis 2024 & 2032
                                                                    62. Figure 62: Europe USA Blueberry Market Volume Share (%), by Consumption Analysis 2024 & 2032
                                                                    63. Figure 63: Europe USA Blueberry Market Revenue (Million), by Import Market Analysis (Value & Volume) 2024 & 2032
                                                                    64. Figure 64: Europe USA Blueberry Market Volume (Kiloton), by Import Market Analysis (Value & Volume) 2024 & 2032
                                                                    65. Figure 65: Europe USA Blueberry Market Revenue Share (%), by Import Market Analysis (Value & Volume) 2024 & 2032
                                                                    66. Figure 66: Europe USA Blueberry Market Volume Share (%), by Import Market Analysis (Value & Volume) 2024 & 2032
                                                                    67. Figure 67: Europe USA Blueberry Market Revenue (Million), by Export Market Analysis (Value & Volume) 2024 & 2032
                                                                    68. Figure 68: Europe USA Blueberry Market Volume (Kiloton), by Export Market Analysis (Value & Volume) 2024 & 2032
                                                                    69. Figure 69: Europe USA Blueberry Market Revenue Share (%), by Export Market Analysis (Value & Volume) 2024 & 2032
                                                                    70. Figure 70: Europe USA Blueberry Market Volume Share (%), by Export Market Analysis (Value & Volume) 2024 & 2032
                                                                    71. Figure 71: Europe USA Blueberry Market Revenue (Million), by Price Trend Analysis 2024 & 2032
                                                                    72. Figure 72: Europe USA Blueberry Market Volume (Kiloton), by Price Trend Analysis 2024 & 2032
                                                                    73. Figure 73: Europe USA Blueberry Market Revenue Share (%), by Price Trend Analysis 2024 & 2032
                                                                    74. Figure 74: Europe USA Blueberry Market Volume Share (%), by Price Trend Analysis 2024 & 2032
                                                                    75. Figure 75: Europe USA Blueberry Market Revenue (Million), by Country 2024 & 2032
                                                                    76. Figure 76: Europe USA Blueberry Market Volume (Kiloton), by Country 2024 & 2032
                                                                    77. Figure 77: Europe USA Blueberry Market Revenue Share (%), by Country 2024 & 2032
                                                                    78. Figure 78: Europe USA Blueberry Market Volume Share (%), by Country 2024 & 2032
                                                                    79. Figure 79: Middle East & Africa USA Blueberry Market Revenue (Million), by Production Analysis 2024 & 2032
                                                                    80. Figure 80: Middle East & Africa USA Blueberry Market Volume (Kiloton), by Production Analysis 2024 & 2032
                                                                    81. Figure 81: Middle East & Africa USA Blueberry Market Revenue Share (%), by Production Analysis 2024 & 2032
                                                                    82. Figure 82: Middle East & Africa USA Blueberry Market Volume Share (%), by Production Analysis 2024 & 2032
                                                                    83. Figure 83: Middle East & Africa USA Blueberry Market Revenue (Million), by Consumption Analysis 2024 & 2032
                                                                    84. Figure 84: Middle East & Africa USA Blueberry Market Volume (Kiloton), by Consumption Analysis 2024 & 2032
                                                                    85. Figure 85: Middle East & Africa USA Blueberry Market Revenue Share (%), by Consumption Analysis 2024 & 2032
                                                                    86. Figure 86: Middle East & Africa USA Blueberry Market Volume Share (%), by Consumption Analysis 2024 & 2032
                                                                    87. Figure 87: Middle East & Africa USA Blueberry Market Revenue (Million), by Import Market Analysis (Value & Volume) 2024 & 2032
                                                                    88. Figure 88: Middle East & Africa USA Blueberry Market Volume (Kiloton), by Import Market Analysis (Value & Volume) 2024 & 2032
                                                                    89. Figure 89: Middle East & Africa USA Blueberry Market Revenue Share (%), by Import Market Analysis (Value & Volume) 2024 & 2032
                                                                    90. Figure 90: Middle East & Africa USA Blueberry Market Volume Share (%), by Import Market Analysis (Value & Volume) 2024 & 2032
                                                                    91. Figure 91: Middle East & Africa USA Blueberry Market Revenue (Million), by Export Market Analysis (Value & Volume) 2024 & 2032
                                                                    92. Figure 92: Middle East & Africa USA Blueberry Market Volume (Kiloton), by Export Market Analysis (Value & Volume) 2024 & 2032
                                                                    93. Figure 93: Middle East & Africa USA Blueberry Market Revenue Share (%), by Export Market Analysis (Value & Volume) 2024 & 2032
                                                                    94. Figure 94: Middle East & Africa USA Blueberry Market Volume Share (%), by Export Market Analysis (Value & Volume) 2024 & 2032
                                                                    95. Figure 95: Middle East & Africa USA Blueberry Market Revenue (Million), by Price Trend Analysis 2024 & 2032
                                                                    96. Figure 96: Middle East & Africa USA Blueberry Market Volume (Kiloton), by Price Trend Analysis 2024 & 2032
                                                                    97. Figure 97: Middle East & Africa USA Blueberry Market Revenue Share (%), by Price Trend Analysis 2024 & 2032
                                                                    98. Figure 98: Middle East & Africa USA Blueberry Market Volume Share (%), by Price Trend Analysis 2024 & 2032
                                                                    99. Figure 99: Middle East & Africa USA Blueberry Market Revenue (Million), by Country 2024 & 2032
                                                                    100. Figure 100: Middle East & Africa USA Blueberry Market Volume (Kiloton), by Country 2024 & 2032
                                                                    101. Figure 101: Middle East & Africa USA Blueberry Market Revenue Share (%), by Country 2024 & 2032
                                                                    102. Figure 102: Middle East & Africa USA Blueberry Market Volume Share (%), by Country 2024 & 2032
                                                                    103. Figure 103: Asia Pacific USA Blueberry Market Revenue (Million), by Production Analysis 2024 & 2032
                                                                    104. Figure 104: Asia Pacific USA Blueberry Market Volume (Kiloton), by Production Analysis 2024 & 2032
                                                                    105. Figure 105: Asia Pacific USA Blueberry Market Revenue Share (%), by Production Analysis 2024 & 2032
                                                                    106. Figure 106: Asia Pacific USA Blueberry Market Volume Share (%), by Production Analysis 2024 & 2032
                                                                    107. Figure 107: Asia Pacific USA Blueberry Market Revenue (Million), by Consumption Analysis 2024 & 2032
                                                                    108. Figure 108: Asia Pacific USA Blueberry Market Volume (Kiloton), by Consumption Analysis 2024 & 2032
                                                                    109. Figure 109: Asia Pacific USA Blueberry Market Revenue Share (%), by Consumption Analysis 2024 & 2032
                                                                    110. Figure 110: Asia Pacific USA Blueberry Market Volume Share (%), by Consumption Analysis 2024 & 2032
                                                                    111. Figure 111: Asia Pacific USA Blueberry Market Revenue (Million), by Import Market Analysis (Value & Volume) 2024 & 2032
                                                                    112. Figure 112: Asia Pacific USA Blueberry Market Volume (Kiloton), by Import Market Analysis (Value & Volume) 2024 & 2032
                                                                    113. Figure 113: Asia Pacific USA Blueberry Market Revenue Share (%), by Import Market Analysis (Value & Volume) 2024 & 2032
                                                                    114. Figure 114: Asia Pacific USA Blueberry Market Volume Share (%), by Import Market Analysis (Value & Volume) 2024 & 2032
                                                                    115. Figure 115: Asia Pacific USA Blueberry Market Revenue (Million), by Export Market Analysis (Value & Volume) 2024 & 2032
                                                                    116. Figure 116: Asia Pacific USA Blueberry Market Volume (Kiloton), by Export Market Analysis (Value & Volume) 2024 & 2032
                                                                    117. Figure 117: Asia Pacific USA Blueberry Market Revenue Share (%), by Export Market Analysis (Value & Volume) 2024 & 2032
                                                                    118. Figure 118: Asia Pacific USA Blueberry Market Volume Share (%), by Export Market Analysis (Value & Volume) 2024 & 2032
                                                                    119. Figure 119: Asia Pacific USA Blueberry Market Revenue (Million), by Price Trend Analysis 2024 & 2032
                                                                    120. Figure 120: Asia Pacific USA Blueberry Market Volume (Kiloton), by Price Trend Analysis 2024 & 2032
                                                                    121. Figure 121: Asia Pacific USA Blueberry Market Revenue Share (%), by Price Trend Analysis 2024 & 2032
                                                                    122. Figure 122: Asia Pacific USA Blueberry Market Volume Share (%), by Price Trend Analysis 2024 & 2032
                                                                    123. Figure 123: Asia Pacific USA Blueberry Market Revenue (Million), by Country 2024 & 2032
                                                                    124. Figure 124: Asia Pacific USA Blueberry Market Volume (Kiloton), by Country 2024 & 2032
                                                                    125. Figure 125: Asia Pacific USA Blueberry Market Revenue Share (%), by Country 2024 & 2032
                                                                    126. Figure 126: Asia Pacific USA Blueberry Market Volume Share (%), by Country 2024 & 2032

                                                                    List of Tables

                                                                    1. Table 1: Global USA Blueberry Market Revenue Million Forecast, by Region 2019 & 2032
                                                                    2. Table 2: Global USA Blueberry Market Volume Kiloton Forecast, by Region 2019 & 2032
                                                                    3. Table 3: Global USA Blueberry Market Revenue Million Forecast, by Production Analysis 2019 & 2032
                                                                    4. Table 4: Global USA Blueberry Market Volume Kiloton Forecast, by Production Analysis 2019 & 2032
                                                                    5. Table 5: Global USA Blueberry Market Revenue Million Forecast, by Consumption Analysis 2019 & 2032
                                                                    6. Table 6: Global USA Blueberry Market Volume Kiloton Forecast, by Consumption Analysis 2019 & 2032
                                                                    7. Table 7: Global USA Blueberry Market Revenue Million Forecast, by Import Market Analysis (Value & Volume) 2019 & 2032
                                                                    8. Table 8: Global USA Blueberry Market Volume Kiloton Forecast, by Import Market Analysis (Value & Volume) 2019 & 2032
                                                                    9. Table 9: Global USA Blueberry Market Revenue Million Forecast, by Export Market Analysis (Value & Volume) 2019 & 2032
                                                                    10. Table 10: Global USA Blueberry Market Volume Kiloton Forecast, by Export Market Analysis (Value & Volume) 2019 & 2032
                                                                    11. Table 11: Global USA Blueberry Market Revenue Million Forecast, by Price Trend Analysis 2019 & 2032
                                                                    12. Table 12: Global USA Blueberry Market Volume Kiloton Forecast, by Price Trend Analysis 2019 & 2032
                                                                    13. Table 13: Global USA Blueberry Market Revenue Million Forecast, by Region 2019 & 2032
                                                                    14. Table 14: Global USA Blueberry Market Volume Kiloton Forecast, by Region 2019 & 2032
                                                                    15. Table 15: Global USA Blueberry Market Revenue Million Forecast, by Country 2019 & 2032
                                                                    16. Table 16: Global USA Blueberry Market Volume Kiloton Forecast, by Country 2019 & 2032
                                                                    17. Table 17: United States USA Blueberry Market Revenue (Million) Forecast, by Application 2019 & 2032
                                                                    18. Table 18: United States USA Blueberry Market Volume (Kiloton) Forecast, by Application 2019 & 2032
                                                                    19. Table 19: Canada USA Blueberry Market Revenue (Million) Forecast, by Application 2019 & 2032
                                                                    20. Table 20: Canada USA Blueberry Market Volume (Kiloton) Forecast, by Application 2019 & 2032
                                                                    21. Table 21: Mexico USA Blueberry Market Revenue (Million) Forecast, by Application 2019 & 2032
                                                                    22. Table 22: Mexico USA Blueberry Market Volume (Kiloton) Forecast, by Application 2019 & 2032
                                                                    23. Table 23: Global USA Blueberry Market Revenue Million Forecast, by Production Analysis 2019 & 2032
                                                                    24. Table 24: Global USA Blueberry Market Volume Kiloton Forecast, by Production Analysis 2019 & 2032
                                                                    25. Table 25: Global USA Blueberry Market Revenue Million Forecast, by Consumption Analysis 2019 & 2032
                                                                    26. Table 26: Global USA Blueberry Market Volume Kiloton Forecast, by Consumption Analysis 2019 & 2032
                                                                    27. Table 27: Global USA Blueberry Market Revenue Million Forecast, by Import Market Analysis (Value & Volume) 2019 & 2032
                                                                    28. Table 28: Global USA Blueberry Market Volume Kiloton Forecast, by Import Market Analysis (Value & Volume) 2019 & 2032
                                                                    29. Table 29: Global USA Blueberry Market Revenue Million Forecast, by Export Market Analysis (Value & Volume) 2019 & 2032
                                                                    30. Table 30: Global USA Blueberry Market Volume Kiloton Forecast, by Export Market Analysis (Value & Volume) 2019 & 2032
                                                                    31. Table 31: Global USA Blueberry Market Revenue Million Forecast, by Price Trend Analysis 2019 & 2032
                                                                    32. Table 32: Global USA Blueberry Market Volume Kiloton Forecast, by Price Trend Analysis 2019 & 2032
                                                                    33. Table 33: Global USA Blueberry Market Revenue Million Forecast, by Country 2019 & 2032
                                                                    34. Table 34: Global USA Blueberry Market Volume Kiloton Forecast, by Country 2019 & 2032
                                                                    35. Table 35: United States USA Blueberry Market Revenue (Million) Forecast, by Application 2019 & 2032
                                                                    36. Table 36: United States USA Blueberry Market Volume (Kiloton) Forecast, by Application 2019 & 2032
                                                                    37. Table 37: Canada USA Blueberry Market Revenue (Million) Forecast, by Application 2019 & 2032
                                                                    38. Table 38: Canada USA Blueberry Market Volume (Kiloton) Forecast, by Application 2019 & 2032
                                                                    39. Table 39: Mexico USA Blueberry Market Revenue (Million) Forecast, by Application 2019 & 2032
                                                                    40. Table 40: Mexico USA Blueberry Market Volume (Kiloton) Forecast, by Application 2019 & 2032
                                                                    41. Table 41: Global USA Blueberry Market Revenue Million Forecast, by Production Analysis 2019 & 2032
                                                                    42. Table 42: Global USA Blueberry Market Volume Kiloton Forecast, by Production Analysis 2019 & 2032
                                                                    43. Table 43: Global USA Blueberry Market Revenue Million Forecast, by Consumption Analysis 2019 & 2032
                                                                    44. Table 44: Global USA Blueberry Market Volume Kiloton Forecast, by Consumption Analysis 2019 & 2032
                                                                    45. Table 45: Global USA Blueberry Market Revenue Million Forecast, by Import Market Analysis (Value & Volume) 2019 & 2032
                                                                    46. Table 46: Global USA Blueberry Market Volume Kiloton Forecast, by Import Market Analysis (Value & Volume) 2019 & 2032
                                                                    47. Table 47: Global USA Blueberry Market Revenue Million Forecast, by Export Market Analysis (Value & Volume) 2019 & 2032
                                                                    48. Table 48: Global USA Blueberry Market Volume Kiloton Forecast, by Export Market Analysis (Value & Volume) 2019 & 2032
                                                                    49. Table 49: Global USA Blueberry Market Revenue Million Forecast, by Price Trend Analysis 2019 & 2032
                                                                    50. Table 50: Global USA Blueberry Market Volume Kiloton Forecast, by Price Trend Analysis 2019 & 2032
                                                                    51. Table 51: Global USA Blueberry Market Revenue Million Forecast, by Country 2019 & 2032
                                                                    52. Table 52: Global USA Blueberry Market Volume Kiloton Forecast, by Country 2019 & 2032
                                                                    53. Table 53: Brazil USA Blueberry Market Revenue (Million) Forecast, by Application 2019 & 2032
                                                                    54. Table 54: Brazil USA Blueberry Market Volume (Kiloton) Forecast, by Application 2019 & 2032
                                                                    55. Table 55: Argentina USA Blueberry Market Revenue (Million) Forecast, by Application 2019 & 2032
                                                                    56. Table 56: Argentina USA Blueberry Market Volume (Kiloton) Forecast, by Application 2019 & 2032
                                                                    57. Table 57: Rest of South America USA Blueberry Market Revenue (Million) Forecast, by Application 2019 & 2032
                                                                    58. Table 58: Rest of South America USA Blueberry Market Volume (Kiloton) Forecast, by Application 2019 & 2032
                                                                    59. Table 59: Global USA Blueberry Market Revenue Million Forecast, by Production Analysis 2019 & 2032
                                                                    60. Table 60: Global USA Blueberry Market Volume Kiloton Forecast, by Production Analysis 2019 & 2032
                                                                    61. Table 61: Global USA Blueberry Market Revenue Million Forecast, by Consumption Analysis 2019 & 2032
                                                                    62. Table 62: Global USA Blueberry Market Volume Kiloton Forecast, by Consumption Analysis 2019 & 2032
                                                                    63. Table 63: Global USA Blueberry Market Revenue Million Forecast, by Import Market Analysis (Value & Volume) 2019 & 2032
                                                                    64. Table 64: Global USA Blueberry Market Volume Kiloton Forecast, by Import Market Analysis (Value & Volume) 2019 & 2032
                                                                    65. Table 65: Global USA Blueberry Market Revenue Million Forecast, by Export Market Analysis (Value & Volume) 2019 & 2032
                                                                    66. Table 66: Global USA Blueberry Market Volume Kiloton Forecast, by Export Market Analysis (Value & Volume) 2019 & 2032
                                                                    67. Table 67: Global USA Blueberry Market Revenue Million Forecast, by Price Trend Analysis 2019 & 2032
                                                                    68. Table 68: Global USA Blueberry Market Volume Kiloton Forecast, by Price Trend Analysis 2019 & 2032
                                                                    69. Table 69: Global USA Blueberry Market Revenue Million Forecast, by Country 2019 & 2032
                                                                    70. Table 70: Global USA Blueberry Market Volume Kiloton Forecast, by Country 2019 & 2032
                                                                    71. Table 71: United Kingdom USA Blueberry Market Revenue (Million) Forecast, by Application 2019 & 2032
                                                                    72. Table 72: United Kingdom USA Blueberry Market Volume (Kiloton) Forecast, by Application 2019 & 2032
                                                                    73. Table 73: Germany USA Blueberry Market Revenue (Million) Forecast, by Application 2019 & 2032
                                                                    74. Table 74: Germany USA Blueberry Market Volume (Kiloton) Forecast, by Application 2019 & 2032
                                                                    75. Table 75: France USA Blueberry Market Revenue (Million) Forecast, by Application 2019 & 2032
                                                                    76. Table 76: France USA Blueberry Market Volume (Kiloton) Forecast, by Application 2019 & 2032
                                                                    77. Table 77: Italy USA Blueberry Market Revenue (Million) Forecast, by Application 2019 & 2032
                                                                    78. Table 78: Italy USA Blueberry Market Volume (Kiloton) Forecast, by Application 2019 & 2032
                                                                    79. Table 79: Spain USA Blueberry Market Revenue (Million) Forecast, by Application 2019 & 2032
                                                                    80. Table 80: Spain USA Blueberry Market Volume (Kiloton) Forecast, by Application 2019 & 2032
                                                                    81. Table 81: Russia USA Blueberry Market Revenue (Million) Forecast, by Application 2019 & 2032
                                                                    82. Table 82: Russia USA Blueberry Market Volume (Kiloton) Forecast, by Application 2019 & 2032
                                                                    83. Table 83: Benelux USA Blueberry Market Revenue (Million) Forecast, by Application 2019 & 2032
                                                                    84. Table 84: Benelux USA Blueberry Market Volume (Kiloton) Forecast, by Application 2019 & 2032
                                                                    85. Table 85: Nordics USA Blueberry Market Revenue (Million) Forecast, by Application 2019 & 2032
                                                                    86. Table 86: Nordics USA Blueberry Market Volume (Kiloton) Forecast, by Application 2019 & 2032
                                                                    87. Table 87: Rest of Europe USA Blueberry Market Revenue (Million) Forecast, by Application 2019 & 2032
                                                                    88. Table 88: Rest of Europe USA Blueberry Market Volume (Kiloton) Forecast, by Application 2019 & 2032
                                                                    89. Table 89: Global USA Blueberry Market Revenue Million Forecast, by Production Analysis 2019 & 2032
                                                                    90. Table 90: Global USA Blueberry Market Volume Kiloton Forecast, by Production Analysis 2019 & 2032
                                                                    91. Table 91: Global USA Blueberry Market Revenue Million Forecast, by Consumption Analysis 2019 & 2032
                                                                    92. Table 92: Global USA Blueberry Market Volume Kiloton Forecast, by Consumption Analysis 2019 & 2032
                                                                    93. Table 93: Global USA Blueberry Market Revenue Million Forecast, by Import Market Analysis (Value & Volume) 2019 & 2032
                                                                    94. Table 94: Global USA Blueberry Market Volume Kiloton Forecast, by Import Market Analysis (Value & Volume) 2019 & 2032
                                                                    95. Table 95: Global USA Blueberry Market Revenue Million Forecast, by Export Market Analysis (Value & Volume) 2019 & 2032
                                                                    96. Table 96: Global USA Blueberry Market Volume Kiloton Forecast, by Export Market Analysis (Value & Volume) 2019 & 2032
                                                                    97. Table 97: Global USA Blueberry Market Revenue Million Forecast, by Price Trend Analysis 2019 & 2032
                                                                    98. Table 98: Global USA Blueberry Market Volume Kiloton Forecast, by Price Trend Analysis 2019 & 2032
                                                                    99. Table 99: Global USA Blueberry Market Revenue Million Forecast, by Country 2019 & 2032
                                                                    100. Table 100: Global USA Blueberry Market Volume Kiloton Forecast, by Country 2019 & 2032
                                                                    101. Table 101: Turkey USA Blueberry Market Revenue (Million) Forecast, by Application 2019 & 2032
                                                                    102. Table 102: Turkey USA Blueberry Market Volume (Kiloton) Forecast, by Application 2019 & 2032
                                                                    103. Table 103: Israel USA Blueberry Market Revenue (Million) Forecast, by Application 2019 & 2032
                                                                    104. Table 104: Israel USA Blueberry Market Volume (Kiloton) Forecast, by Application 2019 & 2032
                                                                    105. Table 105: GCC USA Blueberry Market Revenue (Million) Forecast, by Application 2019 & 2032
                                                                    106. Table 106: GCC USA Blueberry Market Volume (Kiloton) Forecast, by Application 2019 & 2032
                                                                    107. Table 107: North Africa USA Blueberry Market Revenue (Million) Forecast, by Application 2019 & 2032
                                                                    108. Table 108: North Africa USA Blueberry Market Volume (Kiloton) Forecast, by Application 2019 & 2032
                                                                    109. Table 109: South Africa USA Blueberry Market Revenue (Million) Forecast, by Application 2019 & 2032
                                                                    110. Table 110: South Africa USA Blueberry Market Volume (Kiloton) Forecast, by Application 2019 & 2032
                                                                    111. Table 111: Rest of Middle East & Africa USA Blueberry Market Revenue (Million) Forecast, by Application 2019 & 2032
                                                                    112. Table 112: Rest of Middle East & Africa USA Blueberry Market Volume (Kiloton) Forecast, by Application 2019 & 2032
                                                                    113. Table 113: Global USA Blueberry Market Revenue Million Forecast, by Production Analysis 2019 & 2032
                                                                    114. Table 114: Global USA Blueberry Market Volume Kiloton Forecast, by Production Analysis 2019 & 2032
                                                                    115. Table 115: Global USA Blueberry Market Revenue Million Forecast, by Consumption Analysis 2019 & 2032
                                                                    116. Table 116: Global USA Blueberry Market Volume Kiloton Forecast, by Consumption Analysis 2019 & 2032
                                                                    117. Table 117: Global USA Blueberry Market Revenue Million Forecast, by Import Market Analysis (Value & Volume) 2019 & 2032
                                                                    118. Table 118: Global USA Blueberry Market Volume Kiloton Forecast, by Import Market Analysis (Value & Volume) 2019 & 2032
                                                                    119. Table 119: Global USA Blueberry Market Revenue Million Forecast, by Export Market Analysis (Value & Volume) 2019 & 2032
                                                                    120. Table 120: Global USA Blueberry Market Volume Kiloton Forecast, by Export Market Analysis (Value & Volume) 2019 & 2032
                                                                    121. Table 121: Global USA Blueberry Market Revenue Million Forecast, by Price Trend Analysis 2019 & 2032
                                                                    122. Table 122: Global USA Blueberry Market Volume Kiloton Forecast, by Price Trend Analysis 2019 & 2032
                                                                    123. Table 123: Global USA Blueberry Market Revenue Million Forecast, by Country 2019 & 2032
                                                                    124. Table 124: Global USA Blueberry Market Volume Kiloton Forecast, by Country 2019 & 2032
                                                                    125. Table 125: China USA Blueberry Market Revenue (Million) Forecast, by Application 2019 & 2032
                                                                    126. Table 126: China USA Blueberry Market Volume (Kiloton) Forecast, by Application 2019 & 2032
                                                                    127. Table 127: India USA Blueberry Market Revenue (Million) Forecast, by Application 2019 & 2032
                                                                    128. Table 128: India USA Blueberry Market Volume (Kiloton) Forecast, by Application 2019 & 2032
                                                                    129. Table 129: Japan USA Blueberry Market Revenue (Million) Forecast, by Application 2019 & 2032
                                                                    130. Table 130: Japan USA Blueberry Market Volume (Kiloton) Forecast, by Application 2019 & 2032
                                                                    131. Table 131: South Korea USA Blueberry Market Revenue (Million) Forecast, by Application 2019 & 2032
                                                                    132. Table 132: South Korea USA Blueberry Market Volume (Kiloton) Forecast, by Application 2019 & 2032
                                                                    133. Table 133: ASEAN USA Blueberry Market Revenue (Million) Forecast, by Application 2019 & 2032
                                                                    134. Table 134: ASEAN USA Blueberry Market Volume (Kiloton) Forecast, by Application 2019 & 2032
                                                                    135. Table 135: Oceania USA Blueberry Market Revenue (Million) Forecast, by Application 2019 & 2032
                                                                    136. Table 136: Oceania USA Blueberry Market Volume (Kiloton) Forecast, by Application 2019 & 2032
                                                                    137. Table 137: Rest of Asia Pacific USA Blueberry Market Revenue (Million) Forecast, by Application 2019 & 2032
                                                                    138. Table 138: Rest of Asia Pacific USA Blueberry Market Volume (Kiloton) Forecast, by Application 2019 & 2032


                                                                    Frequently Asked Questions

                                                                    1. What is the projected Compound Annual Growth Rate (CAGR) of the USA Blueberry Market?

                                                                    The projected CAGR is approximately 2.10%.

                                                                    2. Which companies are prominent players in the USA Blueberry Market?

                                                                    Key companies in the market include MBG Marketing, Naturipe Farms , Driscoll's, Ocean Spray Cranberries , Fall Creek Farm & Nursery .

                                                                    3. What are the main segments of the USA Blueberry Market?

                                                                    The market segments include Production Analysis, Consumption Analysis, Import Market Analysis (Value & Volume), Export Market Analysis (Value & Volume), Price Trend Analysis.

                                                                    4. Can you provide details about the market size?

                                                                    The market size is estimated to be USD XXX Million as of 2022.

                                                                    5. What are some drivers contributing to market growth?

                                                                    ; Awareness About Health Benefits Associated With Pecan Consumption; Wide Application of Pecan.

                                                                    6. What are the notable trends driving market growth?

                                                                    Increasing Blueberry Production to create more Export Opportunities.

                                                                    7. Are there any restraints impacting market growth?

                                                                    ; Volatility in the Prices; Adverse Weather Conditions Affecting Yield.

                                                                    8. Can you provide examples of recent developments in the market?

                                                                    June 2022: According to the USHBC (US Highbush Blueberry Council) forecast, blueberry production in the United States is expected to reach 328,940 metric ton in 2022, an increase of 10.4% from the 297,830 metric ton produced in 2021. Of this volume, 185,700 metric ton are expected to be sold as fresh blueberries and 143,240 metric ton as processed products such as frozen and dried blueberries.

                                                                    9. What pricing options are available for accessing the report?

                                                                    Pricing options include single-user, multi-user, and enterprise licenses priced at USD 3800, USD 4500, and USD 5800 respectively.

                                                                    10. Is the market size provided in terms of value or volume?

                                                                    The market size is provided in terms of value, measured in Million and volume, measured in Kiloton.

                                                                    11. Are there any specific market keywords associated with the report?

                                                                    Yes, the market keyword associated with the report is "USA Blueberry Market," which aids in identifying and referencing the specific market segment covered.

                                                                    12. How do I determine which pricing option suits my needs best?

                                                                    The pricing options vary based on user requirements and access needs. Individual users may opt for single-user licenses, while businesses requiring broader access may choose multi-user or enterprise licenses for cost-effective access to the report.

                                                                    13. Are there any additional resources or data provided in the USA Blueberry Market report?

                                                                    While the report offers comprehensive insights, it's advisable to review the specific contents or supplementary materials provided to ascertain if additional resources or data are available.

                                                                    14. How can I stay updated on further developments or reports in the USA Blueberry Market?

                                                                    To stay informed about further developments, trends, and reports in the USA Blueberry Market, consider subscribing to industry newsletters, following relevant companies and organizations, or regularly checking reputable industry news sources and publications.


                                                                    Methodology

                                                                    Step 1 - Identification of Relevant Samples Size from Population Database

                                                                    Step Chart
                                                                    Bar Chart
                                                                    Method Chart

                                                                    Step 2 - Approaches for Defining Global Market Size (Value, Volume* & Price*)

                                                                    Approach Chart
                                                                    Top-down and bottom-up approaches are used to validate the global market size and estimate the market size for manufactures, regional segments, product, and application.

                                                                    Note*: In applicable scenarios

                                                                    Step 3 - Data Sources

                                                                    Primary Research

                                                                    • Web Analytics
                                                                    • Survey Reports
                                                                    • Research Institute
                                                                    • Latest Research Reports
                                                                    • Opinion Leaders

                                                                    Secondary Research

                                                                    • Annual Reports
                                                                    • White Paper
                                                                    • Latest Press Release
                                                                    • Industry Association
                                                                    • Paid Database
                                                                    • Investor Presentations
                                                                    Analyst Chart

                                                                    Step 4 - Data Triangulation

                                                                    Involves using different sources of information in order to increase the validity of a study

                                                                    These sources are likely to be stakeholders in a program - participants, other researchers, program staff, other community members, and so on.

                                                                    Then we put all data in single framework & apply various statistical tools to find out the dynamic on the market.

                                                                    During the analysis stage, feedback from the stakeholder groups would be compared to determine areas of agreement as well as areas of divergence

                                                                    Additionally, after gathering mixed and scattered data from a wide range of sources, data is triangulated and correlated to come up with estimated figures which are further validated through primary mediums or industry experts, opinion leaders.

                                                                    About Visionary Data Reports

                                                                    Visionary Data Reports provides future-focused market research, advanced analytics, and strategic insights for technology, healthcare, green energy, and finance. Our reports help you anticipate trends, innovate, and lead in your industry. Our expert team combines primary research, data science, and industry knowledge to deliver actionable intelligence. We offer syndicated reports, custom analytics, and consulting services tailored to your business needs. At Visionary Data Reports, we are committed to quality, transparency, and client satisfaction. Every report is rigorously validated to ensure accuracy and relevance. Our global perspective and forward-thinking approach help you understand both current and emerging market dynamics.

                                                                    Stay ahead with Visionary Data Reports. Subscribe to our newsletter for the latest insights and research highlights, and follow us on social media for real-time updates. Visionary Data Reports – Your Guide to Tomorrow’s Opportunities.

                                                                    artwork spiralartwork spiralRelated Reports
                                                                    artwork underline

                                                                    Sudan Alfalfa Market Trends and Forecasts: Comprehensive Insights

                                                                    Discover the booming Sudan alfalfa market! Projected to reach $373.33 million by 2033, with a 5.5% CAGR, this report analyzes market drivers, trends, and key players like Syngenta and DLF Seeds across segments including hay, pellets & seeds for livestock and human consumption. Explore regional data and investment opportunities.

                                                                    July 2025
                                                                    Base Year: 2024
                                                                    No Of Pages: 150
                                                                    Price: $3800

                                                                    North America Specialty Fertilizer Market 2025-2033 Overview: Trends, Competitor Dynamics, and Opportunities

                                                                    The North American specialty fertilizer market is experiencing robust growth, driven by precision agriculture, sustainable farming practices, and demand for high-yield crops. Explore market size, CAGR, key players (Koch Industries, Mosaic, Nutrien), and regional trends (US, Canada, Mexico) in this in-depth analysis. Discover opportunities and challenges in the liquid, slow-release, and water-soluble fertilizer segments.

                                                                    July 2025
                                                                    Base Year: 2024
                                                                    No Of Pages: 197
                                                                    Price: $3800

                                                                    Europe Chia Seeds Market Market’s Role in Emerging Tech: Insights and Projections 2025-2033

                                                                    Discover the booming European chia seeds market! This in-depth analysis reveals market size, CAGR, key players (The Chia Company, Salba, Nutiva), and growth drivers. Explore trends in packaging, applications (food, supplements, personal care), and regional variations. Learn how this €414.20 million market is poised for significant expansion.

                                                                    July 2025
                                                                    Base Year: 2024
                                                                    No Of Pages: 180
                                                                    Price: $4750

                                                                    Drivers of Change in Thailand Vegetable Seed Market Market 2025-2033

                                                                    Discover the thriving Thailand vegetable seed market's growth trajectory (CAGR 5.20%), driven by consumer demand and technological advancements. Explore market segmentation, key players, and challenges impacting this dynamic sector projected to reach $XXX million by 2033.

                                                                    July 2025
                                                                    Base Year: 2024
                                                                    No Of Pages: 150
                                                                    Price: $3800

                                                                    Consumer Trends Driving Indonesia Fungicide Market Market Growth

                                                                    Discover the booming Indonesia Fungicide Market! This report reveals a projected 16.50% CAGR from 2025-2033, driven by rising disease prevalence, advanced application methods, and government support. Learn about market size, key players (Bayer, Syngenta, BASF), and future trends impacting this dynamic agricultural sector.

                                                                    July 2025
                                                                    Base Year: 2024
                                                                    No Of Pages: 197
                                                                    Price: $3800

                                                                    Tomato Seed Market 2025-2033 Overview: Trends, Competitor Dynamics, and Opportunities

                                                                    Discover the booming global tomato seed market! This comprehensive analysis reveals key trends, growth drivers (hybrid seeds, protected cultivation), restraints, and regional insights (Asia-Pacific leading) for the period 2019-2033, featuring top players like Sakata Seeds and Syngenta. Projected CAGR of 4.70% showcases significant investment opportunities.

                                                                    July 2025
                                                                    Base Year: 2024
                                                                    No Of Pages: 180
                                                                    Price: $3800

                                                                    Emerging Trends in Brazil Maize Market: A Technology Perspective 2025-2033

                                                                    Discover the dynamic Brazil maize market forecast (2025-2033)! This in-depth analysis reveals key growth drivers, including animal feed, biofuel, and human consumption, alongside major players like Syngenta and Corteva. Explore market size, CAGR, and regional insights to understand this lucrative opportunity.

                                                                    July 2025
                                                                    Base Year: 2024
                                                                    No Of Pages: 180
                                                                    Price: $3800

                                                                    Future Forecasts for North America Seed Treatment Market Industry Growth

                                                                    Discover the booming North American seed treatment market! This in-depth analysis reveals a CAGR of 4.20% (2025-2033), driven by precision farming, pest control needs, and government support. Explore key players, market segments (fungicides, insecticides, crops), and regional trends in the US, Canada, and Mexico. Get the data-driven insights you need to succeed.

                                                                    July 2025
                                                                    Base Year: 2024
                                                                    No Of Pages: 150
                                                                    Price: $3800

                                                                    Africa Chia Seeds Industry Market’s Drivers and Challenges: Strategic Overview 2025-2033

                                                                    Discover the booming African chia seed market! Our analysis reveals a $13.87M market in 2025, projected to grow at a 2.10% CAGR through 2033. Explore key trends, segments (organic, hybrid, processed, omega-3 rich), applications (food & beverage, supplements, personal care), and leading companies. Get insights for investment and market entry.

                                                                    July 2025
                                                                    Base Year: 2024
                                                                    No Of Pages: 180
                                                                    Price: $4750

                                                                    Strategic Trends in Asia-Pacific Seed Coating Materials Market Market 2025-2033

                                                                    The Asia-Pacific seed coating materials market is booming, with an 8% CAGR. Discover key trends, leading companies (BASF, Bayer), and segment analysis (polymers, colorants) driving growth in this $XX million market. Explore the forecast to 2033.

                                                                    July 2025
                                                                    Base Year: 2024
                                                                    No Of Pages: 150
                                                                    Price: $3800

                                                                    Comprehensive Review of UK Fruits and Vegetables Market Growth Potential

                                                                    Discover the booming UK fruits and vegetables market! This in-depth analysis reveals a £31.58 billion market with a 2.97% CAGR (2025-2033), driven by health trends and major players like Tesco and Sainsbury's. Explore regional data, consumption patterns, and future growth potential.

                                                                    July 2025
                                                                    Base Year: 2024
                                                                    No Of Pages: 180
                                                                    Price: $3800

                                                                    Malaysia Agrochemical Market Market’s Drivers and Challenges: Strategic Overview 2025-2033

                                                                    Discover the booming Malaysian agrochemical market! This comprehensive analysis reveals a RM 679.59 million market in 2025, projected to grow at a 4.56% CAGR until 2033. Explore key drivers, trends, restraints, and leading companies shaping this dynamic sector. Learn about fertilizers, pesticides, and other agrochemical segments.

                                                                    July 2025
                                                                    Base Year: 2024
                                                                    No Of Pages: 150
                                                                    Price: $3800

                                                                    Drivers of Change in Agricultural Surfactant Market Market 2025-2033

                                                                    The global agricultural surfactant market is booming, projected to reach $3.56 billion by 2033 with a 6.70% CAGR. Driven by precision agriculture and sustainable farming, this market analysis explores key segments (anionic, nonionic, bio-based), top players (BASF, Clariant), and regional growth trends. Discover the future of agricultural surfactants.

                                                                    July 2025
                                                                    Base Year: 2024
                                                                    No Of Pages: 234
                                                                    Price: $4750

                                                                    Cameroon Grains Industry Industry Analysis and Consumer Behavior

                                                                    Discover the booming Cameroon grains industry! Explore market size, growth trends (4.80% CAGR), key players (Sodecoton, CDC, etc.), and challenges impacting cereals, pulses, and oilseeds in Cameroon from 2019-2033. Invest wisely in this promising African market.

                                                                    July 2025
                                                                    Base Year: 2024
                                                                    No Of Pages: 180
                                                                    Price: $3800

                                                                    Analyzing Consumer Behavior in Agriculture Market in Tanzania Market

                                                                    Discover the booming Tanzanian agriculture market! Projected to reach $17.44 billion in 2025, with a 5.63% CAGR, this report analyzes market size, key players (Syngenta, Rijk Zwaan), growth drivers, and future trends in Tanzania's agricultural sector. Explore market segments, including food crops and investment opportunities.

                                                                    July 2025
                                                                    Base Year: 2024
                                                                    No Of Pages: 150
                                                                    Price: $3800

                                                                    Analyzing Consumer Behavior in Artificial Intelligence in Agriculture Industry Market

                                                                    Discover the booming AI in Agriculture market! This comprehensive analysis reveals a 4.20% CAGR, key drivers, trends, restraints, and regional insights from 2019-2033. Learn about leading companies and applications like precision farming, drone analytics, and weather tracking. Explore market size projections and future growth potential.

                                                                    July 2025
                                                                    Base Year: 2024
                                                                    No Of Pages: 150
                                                                    Price: $4750

                                                                    Exploring Forestry Machinery Market’s Market Size Dynamics 2025-2033

                                                                    The global forestry machinery market is booming, projected to reach $15 billion by 2033, driven by rising timber demand and technological advancements. Explore market trends, key players (Deere, Komatsu, etc.), and regional growth in our comprehensive analysis.

                                                                    July 2025
                                                                    Base Year: 2024
                                                                    No Of Pages: 150
                                                                    Price: $4750

                                                                    Nutrition Canary Seed Market Competitive Strategies: Trends and Forecasts 2025-2033

                                                                    Discover the booming nutrition canary seed market! Explore key trends, growth drivers, and regional market share projections for 2025-2033. Learn about leading companies and the increasing demand driven by health-conscious consumers and the birdseed industry.

                                                                    July 2025
                                                                    Base Year: 2024
                                                                    No Of Pages: 234
                                                                    Price: $4750

                                                                    Consumer Behavior and Cashews Market in South America Trends

                                                                    Discover the booming South American cashew market! This comprehensive analysis reveals a $582.24 million market in 2025, projected to grow at a 5.20% CAGR through 2033. Explore key trends, drivers, and leading companies shaping this lucrative industry.

                                                                    July 2025
                                                                    Base Year: 2024
                                                                    No Of Pages: 180
                                                                    Price: $3800

                                                                    Strategic Growth Drivers for Rye Industry Market

                                                                    Discover the latest market analysis of the global rye industry, projecting a steady CAGR of 2.20% to 2033. Explore key drivers, restraints, and regional trends impacting the growth of rye in food, feed, and beverage applications. Learn about leading companies and future market opportunities.

                                                                    July 2025
                                                                    Base Year: 2024
                                                                    No Of Pages: 234
                                                                    Price: $4750

                                                                    Business Address

                                                                    Head Office

                                                                    Office no. A 5010, fifth floor, Solitaire Business Hub, Near Phoenix mall, Pune, Maharashtra 411014

                                                                    Contact Information

                                                                    Craig Francis

                                                                    Business Development Head

                                                                    +17162654855

                                                                    [email protected]

                                                                    Connect With Us

                                                                    Secure Payment Partners

                                                                    payment image
                                                                    RetailLogisticsPackagingAutomotiveHealthcareAgricultureEnergy & PowerFood & BeverageAerospace & DefenseChemicals & MaterialsHospitality and TourismAnimal Nutrition & WellnessConsumer Goods and ServicesReal Estate and ConstructionHome and Property ImprovementTechnology, Media and TelecomManufacturing Products and ServicesFinancial Services and Investment Intelligence

                                                                    © 2025 All rights reserved


                                                                    Privacy Policy
                                                                    Terms and Conditions
                                                                    FAQ
                                                                    • Home
                                                                    • About Us
                                                                    • Industries
                                                                      • Aerospace & Defense
                                                                      • Agriculture
                                                                      • Animal Nutrition & Wellness
                                                                      • Automotive
                                                                      • Chemicals & Materials
                                                                      • Consumer Goods and Services
                                                                      • Energy & Power
                                                                      • Financial Services and Investment Intelligence
                                                                      • Food & Beverage
                                                                      • Home and Property Improvement
                                                                      • Hospitality and Tourism
                                                                      • Logistics
                                                                      • Manufacturing Products and Services
                                                                      • Packaging
                                                                      • Professional and Commercial Services
                                                                      • Real Estate and Construction
                                                                      • Retail
                                                                      • Technology, Media and Telecom
                                                                      • Healthcare
                                                                    • Services
                                                                    • Contact
                                                                    Main Logo
                                                                    • Home
                                                                    • About Us
                                                                    • Industries
                                                                      • Aerospace & Defense
                                                                      • Agriculture
                                                                      • Animal Nutrition & Wellness
                                                                      • Automotive
                                                                      • Chemicals & Materials
                                                                      • Consumer Goods and Services
                                                                      • Energy & Power
                                                                      • Financial Services and Investment Intelligence
                                                                      • Food & Beverage
                                                                      • Home and Property Improvement
                                                                      • Hospitality and Tourism
                                                                      • Logistics
                                                                      • Manufacturing Products and Services
                                                                      • Packaging
                                                                      • Professional and Commercial Services
                                                                      • Real Estate and Construction
                                                                      • Retail
                                                                      • Technology, Media and Telecom
                                                                      • Healthcare
                                                                    • Services
                                                                    • Contact
                                                                    +17162654855
                                                                    [email protected]

                                                                    +17162654855

                                                                    [email protected]