
Key Insights
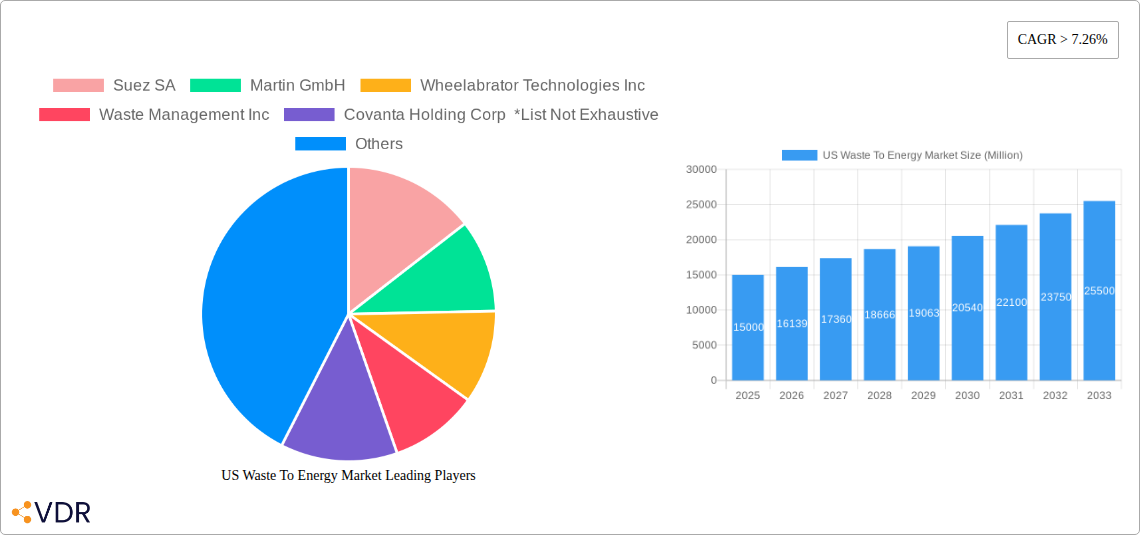
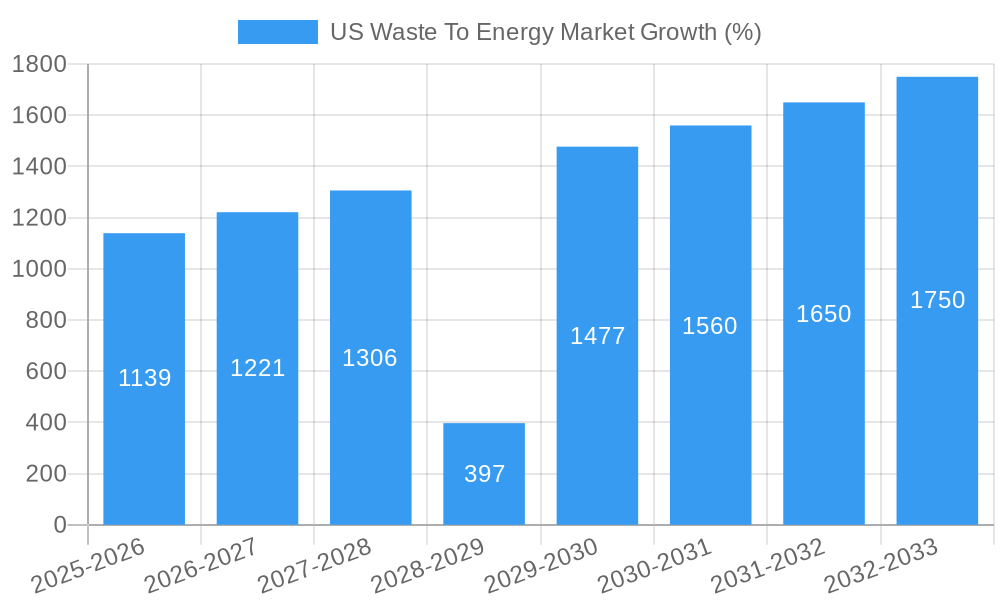
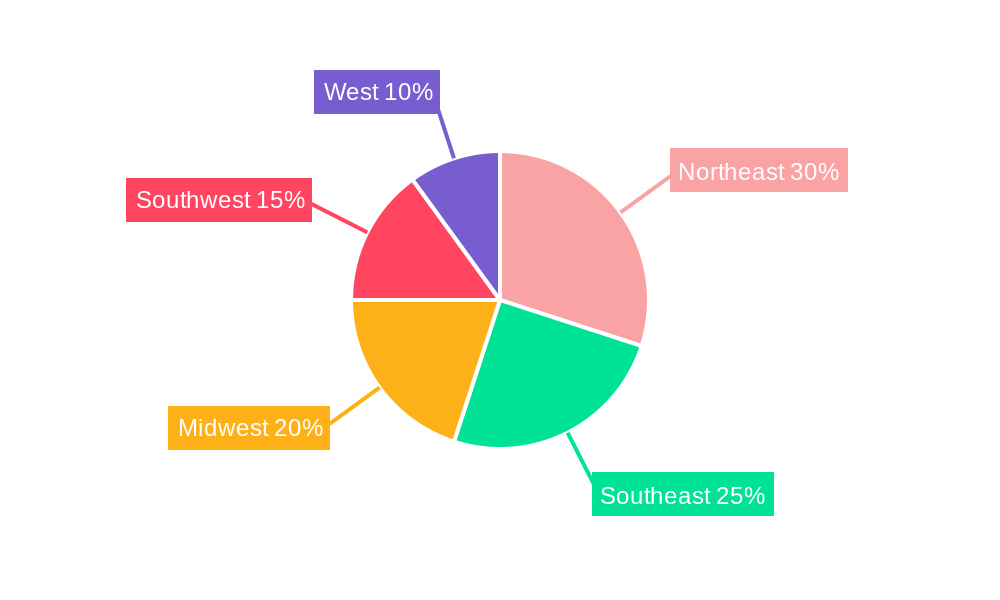
The US waste-to-energy (WtE) market, valued at approximately $15 billion in 2025, is experiencing robust growth, projected to expand at a compound annual growth rate (CAGR) exceeding 7.26% from 2025 to 2033. This surge is driven by several key factors. Stringent environmental regulations aimed at reducing landfill waste and greenhouse gas emissions are compelling municipalities and industries to explore sustainable waste management solutions. The increasing adoption of advanced WtE technologies, such as gasification and pyrolysis, offering higher energy recovery rates and reduced environmental impact, further fuels market growth. Furthermore, the rising cost of landfill disposal and the increasing demand for renewable energy sources are creating a favorable environment for WtE adoption. The market is segmented by technology (physical, thermal, biological) and application (municipal solid waste, industrial waste, agricultural waste), with thermal technologies currently dominating due to their established infrastructure and maturity. Regional variations exist, with the Northeast, benefiting from high population density and robust regulatory frameworks, exhibiting comparatively higher market penetration than other regions.
The market's growth trajectory, however, is not without challenges. High capital investment costs associated with WtE plants, coupled with complex permitting processes and potential public opposition related to siting and environmental concerns, act as significant restraints. Technological advancements, such as improved waste sorting and pre-treatment technologies, are crucial to optimizing WtE plant efficiency and addressing the challenges posed by diverse waste streams. Future growth will likely depend on overcoming these challenges through technological innovation, supportive government policies, and public awareness campaigns highlighting the environmental and economic benefits of WtE. Key players like Suez SA, Martin GmbH, Wheelabrator Technologies Inc, Waste Management Inc, and Covanta Holding Corp are actively shaping the market landscape through technological advancements, strategic partnerships, and market expansion initiatives. The continued focus on sustainable waste management and renewable energy solutions will underpin the long-term growth trajectory of the US WtE market.
US Waste-to-Energy Market Report: 2019-2033
This comprehensive report provides an in-depth analysis of the US Waste-to-Energy market, encompassing market dynamics, growth trends, regional dominance, product landscape, key players, and future outlook. The report covers the period from 2019 to 2033, with a focus on the forecast period of 2025-2033 and a base year of 2025. This crucial analysis is designed for industry professionals, investors, and policymakers seeking a complete understanding of this rapidly evolving sector. The parent market is the broader US Renewable Energy market, while the child markets include Municipal Solid Waste Management and Industrial Waste Management.
US Waste To Energy Market Market Dynamics & Structure
The US Waste-to-Energy market is characterized by moderate concentration, with key players such as Suez SA, Martin GmbH, Wheelabrator Technologies Inc, Waste Management Inc, and Covanta Holding Corp holding significant market share. However, the market exhibits considerable dynamism driven by technological innovation, evolving regulatory frameworks, and increasing pressure from substitute technologies. Market share distribution amongst these key players is estimated to be approximately xx% in 2025, with potential shifts predicted over the forecast period due to technological advancements and mergers & acquisitions. M&A activity in the sector has been relatively consistent over the historical period (2019-2024), with an estimated xx number of deals annually.
- Market Concentration: Moderately concentrated, with top 5 players holding approximately xx% of market share in 2025.
- Technological Innovation: Significant innovation in thermal and biological technologies, driving efficiency gains and cost reductions.
- Regulatory Framework: Federal and state-level regulations promoting renewable energy sources are creating opportunities and shaping market development. The recent Florida legislation is a key example.
- Competitive Substitutes: Recycling and landfill remain significant competing waste management methods.
- End-User Demographics: Primarily municipalities and industrial facilities are the end-users.
- M&A Trends: Consolidation is expected to continue, driven by economies of scale and technological integration.
US Waste To Energy Market Growth Trends & Insights
The US Waste-to-Energy market experienced substantial growth during the historical period (2019-2024), fueled by increased environmental concerns and supportive government policies. Market size is estimated at $xx million in 2025, growing at a CAGR of xx% from 2025 to 2033, reaching a projected $xx million by 2033. This growth is attributable to increasing volumes of waste generated, rising energy costs, and the growing awareness of the environmental benefits of waste-to-energy solutions. Technological advancements, particularly in the areas of thermal and biological technologies, are driving enhanced efficiency and cost-effectiveness, thereby accelerating market adoption. Consumer behavior, driven by environmental consciousness, is also influencing the demand for sustainable waste management solutions. Specific metrics, such as improved waste diversion rates and increasing energy generation capacity from waste, demonstrate substantial market penetration.
Dominant Regions, Countries, or Segments in US Waste To Energy Market
The Northeast and West Coast regions of the US are currently leading the Waste-to-Energy market due to higher population density, stringent environmental regulations, and existing infrastructure. Within technologies, thermal conversion dominates the market, holding a larger market share than biological and physical conversion. Municipal solid waste remains the dominant application segment, but growth is expected in industrial and agricultural waste sectors.
- Key Drivers:
- Stringent environmental regulations and incentives.
- High population density and waste generation in key regions.
- Existing infrastructure in some regions.
- Growing demand for renewable energy.
- Dominance Factors: Existing plant capacity, policy support, and access to waste streams.
- Growth Potential: Significant potential for expansion in the South and Midwest, driven by increasing waste generation and supportive policies.
US Waste To Energy Market Product Landscape
The US Waste-to-Energy market offers a range of technologies, including advanced thermal systems (e.g., gasification, pyrolysis), improved biological processes (e.g., anaerobic digestion), and innovative physical separation techniques. These technologies are continuously being refined to improve efficiency, reduce emissions, and enhance resource recovery. Key selling propositions include reduced landfill reliance, renewable energy production, and minimized environmental impact. Technological advancements focus on higher energy output, reduced greenhouse gas emissions, and improved resource recovery rates.
Key Drivers, Barriers & Challenges in US Waste To Energy Market
Key Drivers:
- Increasing volumes of municipal solid waste.
- Rising energy prices and demand for renewable energy.
- Government policies incentivizing renewable energy production and waste reduction.
- Technological advancements improving efficiency and reducing costs.
Key Barriers & Challenges:
- High capital investment costs for new facilities.
- Public perception and concerns regarding emissions and environmental impact.
- Permitting and regulatory hurdles which often result in project delays.
- Competition from other waste management technologies such as recycling and landfilling. The relative cost-effectiveness of these technologies remains a key factor.
Emerging Opportunities in US Waste To Energy Market
Emerging opportunities lie in the expansion of waste-to-energy facilities in underserved regions, the development of innovative technologies for handling diverse waste streams (e.g., plastics), and the integration of waste-to-energy with other sustainable solutions (e.g., smart cities initiatives). The growing demand for renewable energy and advancements in carbon capture technologies present significant opportunities for growth. Furthermore, exploring new applications for recovered energy and materials can create added value streams.
Growth Accelerators in the US Waste To Energy Market Industry
Long-term growth will be accelerated by technological breakthroughs in advanced conversion technologies, leading to higher energy yields and reduced emissions. Strategic partnerships between waste management companies, energy providers, and technology developers will facilitate the deployment of innovative solutions. Furthermore, expansion into new geographic markets, particularly those with supportive regulatory frameworks, will drive substantial growth.
Key Players Shaping the US Waste To Energy Market Market
- Suez SA
- Martin GmbH
- Wheelabrator Technologies Inc
- Waste Management Inc
- Covanta Holding Corp
- *List Not Exhaustive
Notable Milestones in US Waste To Energy Market Sector
- October 2022: Kore Infrastructure successfully demonstrated its modular waste-to-energy system in Los Angeles, showcasing a closed-loop, carbon-negative process. This signals a shift towards more sustainable and efficient technologies.
- June 2022: Florida's new law established financial assistance for power purchase agreements and grants for capacity expansion at municipally-owned facilities. This demonstrates proactive government support for the sector.
In-Depth US Waste To Energy Market Market Outlook
The US Waste-to-Energy market is poised for sustained growth over the forecast period, driven by the confluence of factors including increasing waste generation, growing demand for renewable energy, supportive government policies, and technological advancements. Strategic opportunities lie in leveraging innovative technologies to address diverse waste streams, expanding into new geographic markets, and forging strategic partnerships to accelerate market penetration. The market's long-term potential is substantial, particularly given the increasing pressure to reduce landfill reliance and transition towards a more circular economy.
US Waste To Energy Market Segmentation
-
1. Technology
- 1.1. Physical
- 1.2. Thermal
- 1.3. Biological
US Waste To Energy Market Segmentation By Geography
-
1. North America
- 1.1. United States
- 1.2. Canada
- 1.3. Mexico
-
2. South America
- 2.1. Brazil
- 2.2. Argentina
- 2.3. Rest of South America
-
3. Europe
- 3.1. United Kingdom
- 3.2. Germany
- 3.3. France
- 3.4. Italy
- 3.5. Spain
- 3.6. Russia
- 3.7. Benelux
- 3.8. Nordics
- 3.9. Rest of Europe
-
4. Middle East & Africa
- 4.1. Turkey
- 4.2. Israel
- 4.3. GCC
- 4.4. North Africa
- 4.5. South Africa
- 4.6. Rest of Middle East & Africa
-
5. Asia Pacific
- 5.1. China
- 5.2. India
- 5.3. Japan
- 5.4. South Korea
- 5.5. ASEAN
- 5.6. Oceania
- 5.7. Rest of Asia Pacific
US Waste To Energy Market REPORT HIGHLIGHTS
| Aspects | Details |
|---|---|
| Study Period | 2019-2033 |
| Base Year | 2024 |
| Estimated Year | 2025 |
| Forecast Period | 2025-2033 |
| Historical Period | 2019-2024 |
| Growth Rate | CAGR of > 7.26% from 2019-2033 |
| Segmentation |
|
Table of Contents
- 1. Introduction
- 1.1. Research Scope
- 1.2. Market Segmentation
- 1.3. Research Methodology
- 1.4. Definitions and Assumptions
- 2. Executive Summary
- 2.1. Introduction
- 3. Market Dynamics
- 3.1. Introduction
- 3.2. Market Drivers
- 3.2.1. 4.; Global Inclination toward Renewable-based Power Generation4.; Increased Power Demand in Line with the Increasing Population
- 3.3. Market Restrains
- 3.3.1. 4.; High Initial Cost
- 3.4. Market Trends
- 3.4.1. Thermal Based Waste to Energy Conversion to Dominate the Market
- 4. Market Factor Analysis
- 4.1. Porters Five Forces
- 4.2. Supply/Value Chain
- 4.3. PESTEL analysis
- 4.4. Market Entropy
- 4.5. Patent/Trademark Analysis
- 5. Global US Waste To Energy Market Analysis, Insights and Forecast, 2019-2031
- 5.1. Market Analysis, Insights and Forecast - by Technology
- 5.1.1. Physical
- 5.1.2. Thermal
- 5.1.3. Biological
- 5.2. Market Analysis, Insights and Forecast - by Region
- 5.2.1. North America
- 5.2.2. South America
- 5.2.3. Europe
- 5.2.4. Middle East & Africa
- 5.2.5. Asia Pacific
- 5.1. Market Analysis, Insights and Forecast - by Technology
- 6. North America US Waste To Energy Market Analysis, Insights and Forecast, 2019-2031
- 6.1. Market Analysis, Insights and Forecast - by Technology
- 6.1.1. Physical
- 6.1.2. Thermal
- 6.1.3. Biological
- 6.1. Market Analysis, Insights and Forecast - by Technology
- 7. South America US Waste To Energy Market Analysis, Insights and Forecast, 2019-2031
- 7.1. Market Analysis, Insights and Forecast - by Technology
- 7.1.1. Physical
- 7.1.2. Thermal
- 7.1.3. Biological
- 7.1. Market Analysis, Insights and Forecast - by Technology
- 8. Europe US Waste To Energy Market Analysis, Insights and Forecast, 2019-2031
- 8.1. Market Analysis, Insights and Forecast - by Technology
- 8.1.1. Physical
- 8.1.2. Thermal
- 8.1.3. Biological
- 8.1. Market Analysis, Insights and Forecast - by Technology
- 9. Middle East & Africa US Waste To Energy Market Analysis, Insights and Forecast, 2019-2031
- 9.1. Market Analysis, Insights and Forecast - by Technology
- 9.1.1. Physical
- 9.1.2. Thermal
- 9.1.3. Biological
- 9.1. Market Analysis, Insights and Forecast - by Technology
- 10. Asia Pacific US Waste To Energy Market Analysis, Insights and Forecast, 2019-2031
- 10.1. Market Analysis, Insights and Forecast - by Technology
- 10.1.1. Physical
- 10.1.2. Thermal
- 10.1.3. Biological
- 10.1. Market Analysis, Insights and Forecast - by Technology
- 11. Northeast US Waste To Energy Market Analysis, Insights and Forecast, 2019-2031
- 12. Southeast US Waste To Energy Market Analysis, Insights and Forecast, 2019-2031
- 13. Midwest US Waste To Energy Market Analysis, Insights and Forecast, 2019-2031
- 14. Southwest US Waste To Energy Market Analysis, Insights and Forecast, 2019-2031
- 15. West US Waste To Energy Market Analysis, Insights and Forecast, 2019-2031
- 16. Competitive Analysis
- 16.1. Global Market Share Analysis 2024
- 16.2. Company Profiles
- 16.2.1 Suez SA
- 16.2.1.1. Overview
- 16.2.1.2. Products
- 16.2.1.3. SWOT Analysis
- 16.2.1.4. Recent Developments
- 16.2.1.5. Financials (Based on Availability)
- 16.2.2 Martin GmbH
- 16.2.2.1. Overview
- 16.2.2.2. Products
- 16.2.2.3. SWOT Analysis
- 16.2.2.4. Recent Developments
- 16.2.2.5. Financials (Based on Availability)
- 16.2.3 Wheelabrator Technologies Inc
- 16.2.3.1. Overview
- 16.2.3.2. Products
- 16.2.3.3. SWOT Analysis
- 16.2.3.4. Recent Developments
- 16.2.3.5. Financials (Based on Availability)
- 16.2.4 Waste Management Inc
- 16.2.4.1. Overview
- 16.2.4.2. Products
- 16.2.4.3. SWOT Analysis
- 16.2.4.4. Recent Developments
- 16.2.4.5. Financials (Based on Availability)
- 16.2.5 Covanta Holding Corp *List Not Exhaustive
- 16.2.5.1. Overview
- 16.2.5.2. Products
- 16.2.5.3. SWOT Analysis
- 16.2.5.4. Recent Developments
- 16.2.5.5. Financials (Based on Availability)
- 16.2.1 Suez SA
List of Figures
- Figure 1: Global US Waste To Energy Market Revenue Breakdown (Million, %) by Region 2024 & 2032
- Figure 2: United states US Waste To Energy Market Revenue (Million), by Country 2024 & 2032
- Figure 3: United states US Waste To Energy Market Revenue Share (%), by Country 2024 & 2032
- Figure 4: North America US Waste To Energy Market Revenue (Million), by Technology 2024 & 2032
- Figure 5: North America US Waste To Energy Market Revenue Share (%), by Technology 2024 & 2032
- Figure 6: North America US Waste To Energy Market Revenue (Million), by Country 2024 & 2032
- Figure 7: North America US Waste To Energy Market Revenue Share (%), by Country 2024 & 2032
- Figure 8: South America US Waste To Energy Market Revenue (Million), by Technology 2024 & 2032
- Figure 9: South America US Waste To Energy Market Revenue Share (%), by Technology 2024 & 2032
- Figure 10: South America US Waste To Energy Market Revenue (Million), by Country 2024 & 2032
- Figure 11: South America US Waste To Energy Market Revenue Share (%), by Country 2024 & 2032
- Figure 12: Europe US Waste To Energy Market Revenue (Million), by Technology 2024 & 2032
- Figure 13: Europe US Waste To Energy Market Revenue Share (%), by Technology 2024 & 2032
- Figure 14: Europe US Waste To Energy Market Revenue (Million), by Country 2024 & 2032
- Figure 15: Europe US Waste To Energy Market Revenue Share (%), by Country 2024 & 2032
- Figure 16: Middle East & Africa US Waste To Energy Market Revenue (Million), by Technology 2024 & 2032
- Figure 17: Middle East & Africa US Waste To Energy Market Revenue Share (%), by Technology 2024 & 2032
- Figure 18: Middle East & Africa US Waste To Energy Market Revenue (Million), by Country 2024 & 2032
- Figure 19: Middle East & Africa US Waste To Energy Market Revenue Share (%), by Country 2024 & 2032
- Figure 20: Asia Pacific US Waste To Energy Market Revenue (Million), by Technology 2024 & 2032
- Figure 21: Asia Pacific US Waste To Energy Market Revenue Share (%), by Technology 2024 & 2032
- Figure 22: Asia Pacific US Waste To Energy Market Revenue (Million), by Country 2024 & 2032
- Figure 23: Asia Pacific US Waste To Energy Market Revenue Share (%), by Country 2024 & 2032
List of Tables
- Table 1: Global US Waste To Energy Market Revenue Million Forecast, by Region 2019 & 2032
- Table 2: Global US Waste To Energy Market Revenue Million Forecast, by Technology 2019 & 2032
- Table 3: Global US Waste To Energy Market Revenue Million Forecast, by Region 2019 & 2032
- Table 4: Global US Waste To Energy Market Revenue Million Forecast, by Country 2019 & 2032
- Table 5: Northeast US Waste To Energy Market Revenue (Million) Forecast, by Application 2019 & 2032
- Table 6: Southeast US Waste To Energy Market Revenue (Million) Forecast, by Application 2019 & 2032
- Table 7: Midwest US Waste To Energy Market Revenue (Million) Forecast, by Application 2019 & 2032
- Table 8: Southwest US Waste To Energy Market Revenue (Million) Forecast, by Application 2019 & 2032
- Table 9: West US Waste To Energy Market Revenue (Million) Forecast, by Application 2019 & 2032
- Table 10: Global US Waste To Energy Market Revenue Million Forecast, by Technology 2019 & 2032
- Table 11: Global US Waste To Energy Market Revenue Million Forecast, by Country 2019 & 2032
- Table 12: United States US Waste To Energy Market Revenue (Million) Forecast, by Application 2019 & 2032
- Table 13: Canada US Waste To Energy Market Revenue (Million) Forecast, by Application 2019 & 2032
- Table 14: Mexico US Waste To Energy Market Revenue (Million) Forecast, by Application 2019 & 2032
- Table 15: Global US Waste To Energy Market Revenue Million Forecast, by Technology 2019 & 2032
- Table 16: Global US Waste To Energy Market Revenue Million Forecast, by Country 2019 & 2032
- Table 17: Brazil US Waste To Energy Market Revenue (Million) Forecast, by Application 2019 & 2032
- Table 18: Argentina US Waste To Energy Market Revenue (Million) Forecast, by Application 2019 & 2032
- Table 19: Rest of South America US Waste To Energy Market Revenue (Million) Forecast, by Application 2019 & 2032
- Table 20: Global US Waste To Energy Market Revenue Million Forecast, by Technology 2019 & 2032
- Table 21: Global US Waste To Energy Market Revenue Million Forecast, by Country 2019 & 2032
- Table 22: United Kingdom US Waste To Energy Market Revenue (Million) Forecast, by Application 2019 & 2032
- Table 23: Germany US Waste To Energy Market Revenue (Million) Forecast, by Application 2019 & 2032
- Table 24: France US Waste To Energy Market Revenue (Million) Forecast, by Application 2019 & 2032
- Table 25: Italy US Waste To Energy Market Revenue (Million) Forecast, by Application 2019 & 2032
- Table 26: Spain US Waste To Energy Market Revenue (Million) Forecast, by Application 2019 & 2032
- Table 27: Russia US Waste To Energy Market Revenue (Million) Forecast, by Application 2019 & 2032
- Table 28: Benelux US Waste To Energy Market Revenue (Million) Forecast, by Application 2019 & 2032
- Table 29: Nordics US Waste To Energy Market Revenue (Million) Forecast, by Application 2019 & 2032
- Table 30: Rest of Europe US Waste To Energy Market Revenue (Million) Forecast, by Application 2019 & 2032
- Table 31: Global US Waste To Energy Market Revenue Million Forecast, by Technology 2019 & 2032
- Table 32: Global US Waste To Energy Market Revenue Million Forecast, by Country 2019 & 2032
- Table 33: Turkey US Waste To Energy Market Revenue (Million) Forecast, by Application 2019 & 2032
- Table 34: Israel US Waste To Energy Market Revenue (Million) Forecast, by Application 2019 & 2032
- Table 35: GCC US Waste To Energy Market Revenue (Million) Forecast, by Application 2019 & 2032
- Table 36: North Africa US Waste To Energy Market Revenue (Million) Forecast, by Application 2019 & 2032
- Table 37: South Africa US Waste To Energy Market Revenue (Million) Forecast, by Application 2019 & 2032
- Table 38: Rest of Middle East & Africa US Waste To Energy Market Revenue (Million) Forecast, by Application 2019 & 2032
- Table 39: Global US Waste To Energy Market Revenue Million Forecast, by Technology 2019 & 2032
- Table 40: Global US Waste To Energy Market Revenue Million Forecast, by Country 2019 & 2032
- Table 41: China US Waste To Energy Market Revenue (Million) Forecast, by Application 2019 & 2032
- Table 42: India US Waste To Energy Market Revenue (Million) Forecast, by Application 2019 & 2032
- Table 43: Japan US Waste To Energy Market Revenue (Million) Forecast, by Application 2019 & 2032
- Table 44: South Korea US Waste To Energy Market Revenue (Million) Forecast, by Application 2019 & 2032
- Table 45: ASEAN US Waste To Energy Market Revenue (Million) Forecast, by Application 2019 & 2032
- Table 46: Oceania US Waste To Energy Market Revenue (Million) Forecast, by Application 2019 & 2032
- Table 47: Rest of Asia Pacific US Waste To Energy Market Revenue (Million) Forecast, by Application 2019 & 2032
Frequently Asked Questions
1. What is the projected Compound Annual Growth Rate (CAGR) of the US Waste To Energy Market?
The projected CAGR is approximately > 7.26%.
2. Which companies are prominent players in the US Waste To Energy Market?
Key companies in the market include Suez SA, Martin GmbH, Wheelabrator Technologies Inc, Waste Management Inc, Covanta Holding Corp *List Not Exhaustive.
3. What are the main segments of the US Waste To Energy Market?
The market segments include Technology.
4. Can you provide details about the market size?
The market size is estimated to be USD XX Million as of 2022.
5. What are some drivers contributing to market growth?
4.; Global Inclination toward Renewable-based Power Generation4.; Increased Power Demand in Line with the Increasing Population.
6. What are the notable trends driving market growth?
Thermal Based Waste to Energy Conversion to Dominate the Market.
7. Are there any restraints impacting market growth?
4.; High Initial Cost.
8. Can you provide examples of recent developments in the market?
October 2022: Kore Infrastructure announced the successful one-year demonstration of its waste-to-energy modular system in Los Angeles, California. The company's technology can produce 100% renewable energy from organic waste using a closed-loop, carbon-negative process.
9. What pricing options are available for accessing the report?
Pricing options include single-user, multi-user, and enterprise licenses priced at USD 3800, USD 4500, and USD 5800 respectively.
10. Is the market size provided in terms of value or volume?
The market size is provided in terms of value, measured in Million.
11. Are there any specific market keywords associated with the report?
Yes, the market keyword associated with the report is "US Waste To Energy Market," which aids in identifying and referencing the specific market segment covered.
12. How do I determine which pricing option suits my needs best?
The pricing options vary based on user requirements and access needs. Individual users may opt for single-user licenses, while businesses requiring broader access may choose multi-user or enterprise licenses for cost-effective access to the report.
13. Are there any additional resources or data provided in the US Waste To Energy Market report?
While the report offers comprehensive insights, it's advisable to review the specific contents or supplementary materials provided to ascertain if additional resources or data are available.
14. How can I stay updated on further developments or reports in the US Waste To Energy Market?
To stay informed about further developments, trends, and reports in the US Waste To Energy Market, consider subscribing to industry newsletters, following relevant companies and organizations, or regularly checking reputable industry news sources and publications.
Methodology
Step 1 - Identification of Relevant Samples Size from Population Database


Step 2 - Approaches for Defining Global Market Size (Value, Volume* & Price*)

Note*: In applicable scenarios
Step 3 - Data Sources
Primary Research
- Web Analytics
- Survey Reports
- Research Institute
- Latest Research Reports
- Opinion Leaders
Secondary Research
- Annual Reports
- White Paper
- Latest Press Release
- Industry Association
- Paid Database
- Investor Presentations

Step 4 - Data Triangulation
Involves using different sources of information in order to increase the validity of a study
These sources are likely to be stakeholders in a program - participants, other researchers, program staff, other community members, and so on.
Then we put all data in single framework & apply various statistical tools to find out the dynamic on the market.
During the analysis stage, feedback from the stakeholder groups would be compared to determine areas of agreement as well as areas of divergence


