

Key Insights
The U.S. veterinary healthcare market is poised for significant expansion, projected to reach $65.45 billion by 2025, with a Compound Annual Growth Rate (CAGR) of 7.8% from 2025 to 2033. This robust growth is primarily driven by increasing pet ownership, particularly for companion animals, and the escalating trend of pet humanization, leading to greater investment in animal health and wellness. Technological advancements in diagnostics and therapeutics, coupled with a heightened awareness of animal welfare and preventative care among owners, further fuel market demand. The market is segmented by product (therapeutics, diagnostics, and others) and animal type (dogs and cats, horses, ruminants, swine, poultry, and others), with companion animals representing the largest segment. Leading companies such as Zoetis, Merck, and Boehringer Ingelheim exemplify the sector's vitality. Regional variations are anticipated, with the Northeast, West, and Southeast likely to exhibit larger market shares due to higher pet ownership rates and disposable incomes.
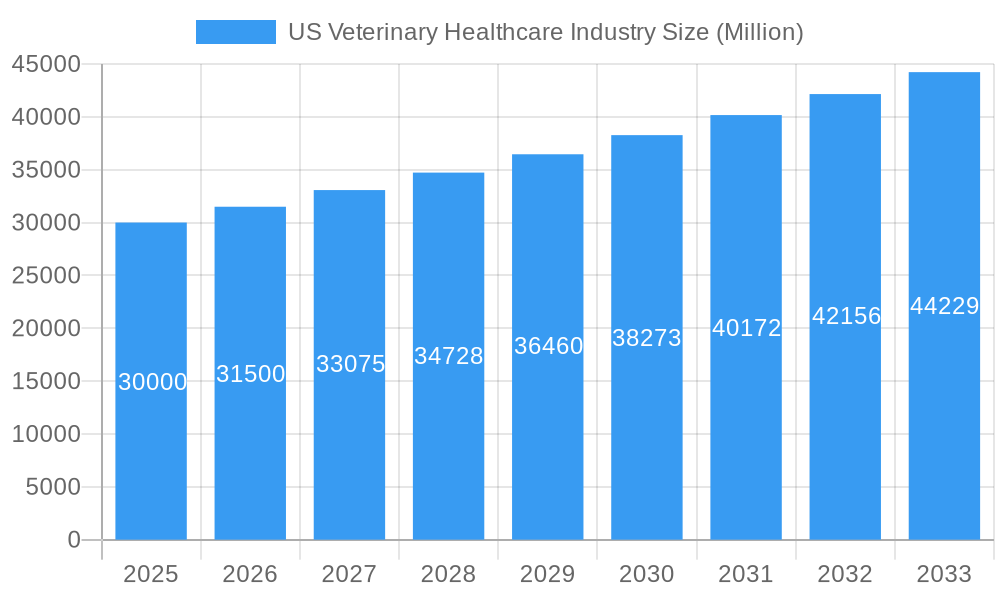
US Veterinary Healthcare Industry Market Size (In Billion)
Potential growth restraints include rising veterinary care costs, competitive pressures influencing pricing and profitability, and regulatory landscapes. Nonetheless, the long-term outlook remains overwhelmingly positive, propelled by sustained growth in pet ownership and increasing demand for advanced veterinary services. The market's substantial size and consistent growth trajectory present attractive opportunities for investment and innovation. Detailed regional data and granular segmentation by product and animal type will offer further insights into specific market dynamics.
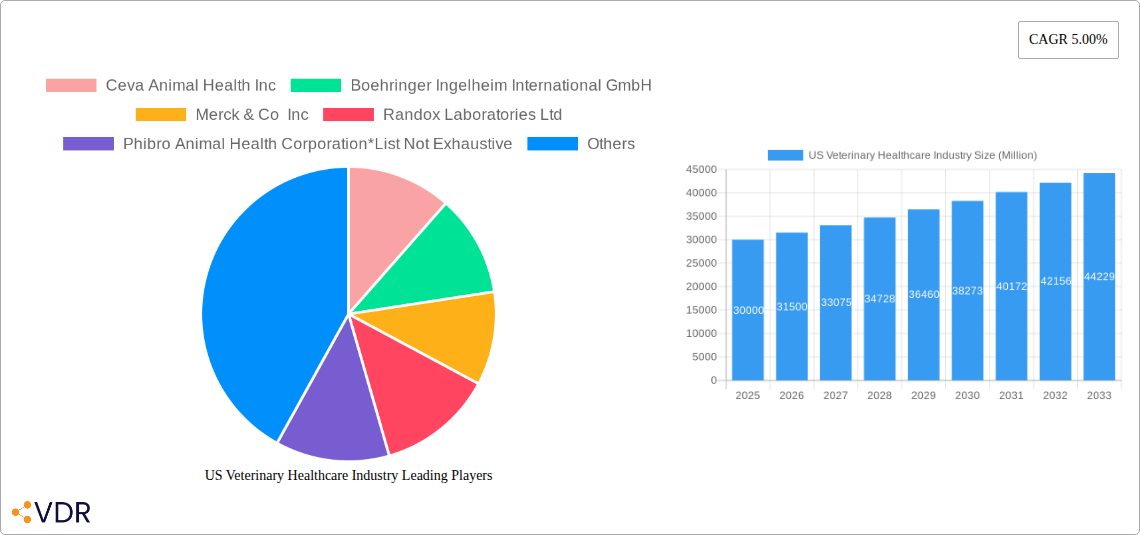
US Veterinary Healthcare Industry Company Market Share
US Veterinary Healthcare Industry Market Report: 2019-2033
This comprehensive report provides an in-depth analysis of the US veterinary healthcare market, offering invaluable insights for industry professionals, investors, and stakeholders. The report covers the period 2019-2033, with a focus on the forecast period 2025-2033 (Base Year: 2025, Estimated Year: 2025). Market size is presented in millions of US dollars.
US Veterinary Healthcare Industry Market Dynamics & Structure
The US veterinary healthcare market is characterized by a moderately concentrated landscape with key players like Zoetis Inc, Merck & Co Inc, and Elanco Animal Health holding significant market share. Technological innovation, particularly in diagnostics and therapeutics, is a major growth driver. Stringent regulatory frameworks, including FDA approvals, impact product development and market entry. The market experiences competitive pressure from product substitutes and generic medications. End-user demographics, including an increasing pet ownership rate and rising pet humanization, significantly influence market demand. Consolidation through mergers and acquisitions (M&A) is frequent, with xx M&A deals recorded between 2019-2024, resulting in a xx% increase in market concentration.
- Market Concentration: Moderately concentrated, with top 5 players holding xx% market share.
- Technological Innovation: Focus on diagnostics (rapid testing, telehealth), personalized medicine, and novel therapeutics.
- Regulatory Framework: Stringent FDA regulations impacting product approvals and market access.
- Competitive Landscape: Intense competition among established players and emerging companies.
- M&A Activity: Significant M&A activity driving market consolidation and expansion.
US Veterinary Healthcare Industry Growth Trends & Insights
The US veterinary healthcare market exhibits robust growth, driven by increasing pet ownership, rising pet healthcare expenditure, and technological advancements. The market size expanded from $xx million in 2019 to $xx million in 2024, registering a CAGR of xx%. Adoption of advanced diagnostics and therapeutics is increasing, with a market penetration of xx% for rapid diagnostic tests in 2024. Consumer behavior is shifting towards premium pet care products and services, creating opportunities for specialized veterinary care and personalized treatments. Technological disruptions, like telehealth and remote monitoring, are reshaping service delivery models.
- Market Size (2019-2024): $xx million to $xx million; CAGR: xx%
- Market Size (2025-2033): Projected to reach $xx million in 2033; CAGR: xx%
- Technological Disruptions: Telehealth, AI-driven diagnostics, remote monitoring.
- Consumer Behavior: Increased willingness to spend on premium pet care.
Dominant Regions, Countries, or Segments in US Veterinary Healthcare Industry
The companion animal segment (dogs and cats) dominates the US veterinary healthcare market, representing xx% of the total market in 2024. This dominance is driven by high pet ownership rates, increased human-animal bonding, and higher willingness to spend on companion animal healthcare. Within the product segment, therapeutics hold the largest share (xx%), followed by diagnostics (xx%). Geographically, the market is spread relatively evenly across regions, with higher concentrations in densely populated states. Growth is expected to be strongest in areas with rising pet ownership and increasing disposable incomes.
- Dominant Segment: Companion animals (Dogs and Cats) – xx% market share in 2024.
- Leading Product Type: Therapeutics – xx% market share in 2024.
- Regional Growth: Strongest growth anticipated in high-income and densely populated states.
- Key Drivers: Rising pet ownership, increased pet humanization, and higher disposable incomes.
US Veterinary Healthcare Industry Product Landscape
The US veterinary healthcare product landscape is characterized by continuous innovation in diagnostics, therapeutics, and related technologies. New diagnostic tools offer faster and more accurate results, while advancements in therapeutics provide more targeted and effective treatments. The market sees a rise in personalized medicine and specialized products catering to specific animal breeds or health conditions. Key trends include the development of rapid diagnostic tests, point-of-care diagnostics, and novel therapeutic agents.
Key Drivers, Barriers & Challenges in US Veterinary Healthcare Industry
Key Drivers: Rising pet ownership, increasing pet humanization, technological advancements in diagnostics and therapeutics, and government initiatives promoting animal health.
Challenges: High cost of veterinary care, limited access to veterinary services in rural areas, regulatory hurdles for new product approvals, competition from generic drugs, and supply chain disruptions impacting the availability of certain products and medications. These challenges have a quantifiable impact, estimated to restrain market growth by xx% in 2024.
Emerging Opportunities in US Veterinary Healthcare Industry
Emerging opportunities include the expanding telehealth market for veterinary services, the growing demand for personalized medicine approaches, the development of novel diagnostics and therapeutics, and the potential for preventive healthcare programs. Untapped markets in specialized veterinary care (e.g., avian, exotic pets) also present significant growth potential.
Growth Accelerators in the US Veterinary Healthcare Industry
Long-term growth will be propelled by continued technological advancements, strategic partnerships between veterinary clinics and technology providers, market expansion into underserved areas, and increasing awareness of preventative care among pet owners. Government initiatives aimed at improving animal welfare will also contribute to the market’s continued expansion.
Key Players Shaping the US Veterinary Healthcare Industry Market
- Ceva Animal Health Inc
- Boehringer Ingelheim International GmbH
- Merck & Co Inc
- Randox Laboratories Ltd
- Phibro Animal Health Corporation
- Vetoquinol
- Virbac SA
- Elanco Animal Health
- Idexx Laboratories
- Zoetis Inc
Notable Milestones in US Veterinary Healthcare Industry Sector
- March 2022: LexaGene Holdings developed the MiQLab System, a rapid pathogen testing device for companion animals.
- January 2022: Covetrus launched Covetrus Pulse, a cloud-based veterinary operating system.
In-Depth US Veterinary Healthcare Industry Market Outlook
The US veterinary healthcare market is poised for sustained growth, driven by a confluence of factors, including technological innovation, increasing pet ownership, and rising consumer spending on pet healthcare. Strategic partnerships, expansion into specialized niches, and the adoption of advanced technologies will further fuel market expansion, presenting significant opportunities for established players and emerging companies alike. The market is expected to maintain a strong growth trajectory throughout the forecast period (2025-2033).
US Veterinary Healthcare Industry Segmentation
-
1. Product
-
1.1. Therapeutics
- 1.1.1. Vaccines
- 1.1.2. Parasiticides
- 1.1.3. Anti-infectives
- 1.1.4. Medical Feed Additives
- 1.1.5. Other Therapeutics
-
1.2. Diagnostics
- 1.2.1. Immunodiagnostic Tests
- 1.2.2. Molecular Diagnostics
- 1.2.3. Diagnostic Imaging
- 1.2.4. Clinical Chemistry
- 1.2.5. Other Diagnostics
-
1.1. Therapeutics
-
2. Animal Type
- 2.1. Dogs and Cats
- 2.2. Horses
- 2.3. Ruminants
- 2.4. Swine
- 2.5. Poultry
- 2.6. Other Animals
US Veterinary Healthcare Industry Segmentation By Geography
-
1. North America
- 1.1. United States
- 1.2. Canada
- 1.3. Mexico
-
2. South America
- 2.1. Brazil
- 2.2. Argentina
- 2.3. Rest of South America
-
3. Europe
- 3.1. United Kingdom
- 3.2. Germany
- 3.3. France
- 3.4. Italy
- 3.5. Spain
- 3.6. Russia
- 3.7. Benelux
- 3.8. Nordics
- 3.9. Rest of Europe
-
4. Middle East & Africa
- 4.1. Turkey
- 4.2. Israel
- 4.3. GCC
- 4.4. North Africa
- 4.5. South Africa
- 4.6. Rest of Middle East & Africa
-
5. Asia Pacific
- 5.1. China
- 5.2. India
- 5.3. Japan
- 5.4. South Korea
- 5.5. ASEAN
- 5.6. Oceania
- 5.7. Rest of Asia Pacific
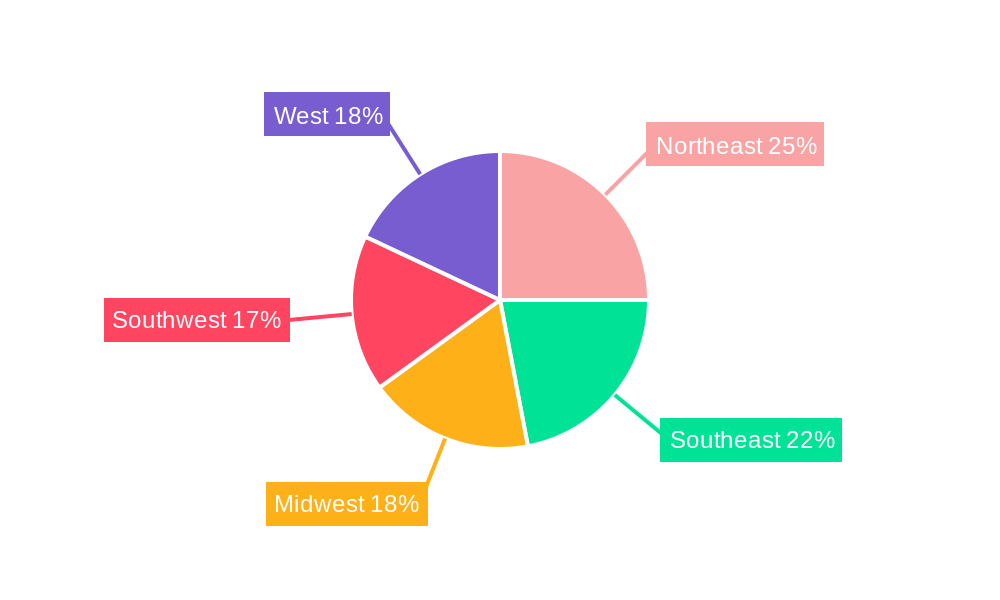
US Veterinary Healthcare Industry Regional Market Share
Geographic Coverage of US Veterinary Healthcare Industry
US Veterinary Healthcare Industry REPORT HIGHLIGHTS
| Aspects | Details |
|---|---|
| Study Period | 2020-2034 |
| Base Year | 2025 |
| Estimated Year | 2026 |
| Forecast Period | 2026-2034 |
| Historical Period | 2020-2025 |
| Growth Rate | CAGR of 7.8% from 2020-2034 |
| Segmentation |
|
Table of Contents
- 1. Introduction
- 1.1. Research Scope
- 1.2. Market Segmentation
- 1.3. Research Objective
- 1.4. Definitions and Assumptions
- 2. Executive Summary
- 2.1. Market Snapshot
- 3. Market Dynamics
- 3.1. Market Drivers
- 3.2. Market Restrains
- 3.3. Market Trends
- 3.4. Market Opportunities
- 4. Market Factor Analysis
- 4.1. Porters Five Forces
- 4.1.1. Bargaining Power of Suppliers
- 4.1.2. Bargaining Power of Buyers
- 4.1.3. Threat of New Entrants
- 4.1.4. Threat of Substitutes
- 4.1.5. Competitive Rivalry
- 4.2. PESTEL analysis
- 4.3. BCG Analysis
- 4.3.1. Stars (High Growth, High Market Share)
- 4.3.2. Cash Cows (Low Growth, High Market Share)
- 4.3.3. Question Mark (High Growth, Low Market Share)
- 4.3.4. Dogs (Low Growth, Low Market Share)
- 4.4. Ansoff Matrix Analysis
- 4.5. Supply Chain Analysis
- 4.6. Regulatory Landscape
- 4.7. Current Market Potential and Opportunity Assessment (TAM–SAM–SOM Framework)
- 4.8. VDR Analyst Note
- 4.1. Porters Five Forces
- 5. Market Analysis, Insights and Forecast 2021-2033
- 5.1. Market Analysis, Insights and Forecast - by Product
- 5.1.1. Therapeutics
- 5.1.1.1. Vaccines
- 5.1.1.2. Parasiticides
- 5.1.1.3. Anti-infectives
- 5.1.1.4. Medical Feed Additives
- 5.1.1.5. Other Therapeutics
- 5.1.2. Diagnostics
- 5.1.2.1. Immunodiagnostic Tests
- 5.1.2.2. Molecular Diagnostics
- 5.1.2.3. Diagnostic Imaging
- 5.1.2.4. Clinical Chemistry
- 5.1.2.5. Other Diagnostics
- 5.1.1. Therapeutics
- 5.2. Market Analysis, Insights and Forecast - by Animal Type
- 5.2.1. Dogs and Cats
- 5.2.2. Horses
- 5.2.3. Ruminants
- 5.2.4. Swine
- 5.2.5. Poultry
- 5.2.6. Other Animals
- 5.3. Market Analysis, Insights and Forecast - by Region
- 5.3.1. North America
- 5.3.2. South America
- 5.3.3. Europe
- 5.3.4. Middle East & Africa
- 5.3.5. Asia Pacific
- 5.1. Market Analysis, Insights and Forecast - by Product
- 6. Global US Veterinary Healthcare Industry Analysis, Insights and Forecast, 2021-2033
- 6.1. Market Analysis, Insights and Forecast - by Product
- 6.1.1. Therapeutics
- 6.1.1.1. Vaccines
- 6.1.1.2. Parasiticides
- 6.1.1.3. Anti-infectives
- 6.1.1.4. Medical Feed Additives
- 6.1.1.5. Other Therapeutics
- 6.1.2. Diagnostics
- 6.1.2.1. Immunodiagnostic Tests
- 6.1.2.2. Molecular Diagnostics
- 6.1.2.3. Diagnostic Imaging
- 6.1.2.4. Clinical Chemistry
- 6.1.2.5. Other Diagnostics
- 6.1.1. Therapeutics
- 6.2. Market Analysis, Insights and Forecast - by Animal Type
- 6.2.1. Dogs and Cats
- 6.2.2. Horses
- 6.2.3. Ruminants
- 6.2.4. Swine
- 6.2.5. Poultry
- 6.2.6. Other Animals
- 6.1. Market Analysis, Insights and Forecast - by Product
- 7. North America US Veterinary Healthcare Industry Analysis, Insights and Forecast, 2021-2033
- 7.1. Market Analysis, Insights and Forecast - by Product
- 7.1.1. Therapeutics
- 7.1.1.1. Vaccines
- 7.1.1.2. Parasiticides
- 7.1.1.3. Anti-infectives
- 7.1.1.4. Medical Feed Additives
- 7.1.1.5. Other Therapeutics
- 7.1.2. Diagnostics
- 7.1.2.1. Immunodiagnostic Tests
- 7.1.2.2. Molecular Diagnostics
- 7.1.2.3. Diagnostic Imaging
- 7.1.2.4. Clinical Chemistry
- 7.1.2.5. Other Diagnostics
- 7.1.1. Therapeutics
- 7.2. Market Analysis, Insights and Forecast - by Animal Type
- 7.2.1. Dogs and Cats
- 7.2.2. Horses
- 7.2.3. Ruminants
- 7.2.4. Swine
- 7.2.5. Poultry
- 7.2.6. Other Animals
- 7.1. Market Analysis, Insights and Forecast - by Product
- 8. South America US Veterinary Healthcare Industry Analysis, Insights and Forecast, 2021-2033
- 8.1. Market Analysis, Insights and Forecast - by Product
- 8.1.1. Therapeutics
- 8.1.1.1. Vaccines
- 8.1.1.2. Parasiticides
- 8.1.1.3. Anti-infectives
- 8.1.1.4. Medical Feed Additives
- 8.1.1.5. Other Therapeutics
- 8.1.2. Diagnostics
- 8.1.2.1. Immunodiagnostic Tests
- 8.1.2.2. Molecular Diagnostics
- 8.1.2.3. Diagnostic Imaging
- 8.1.2.4. Clinical Chemistry
- 8.1.2.5. Other Diagnostics
- 8.1.1. Therapeutics
- 8.2. Market Analysis, Insights and Forecast - by Animal Type
- 8.2.1. Dogs and Cats
- 8.2.2. Horses
- 8.2.3. Ruminants
- 8.2.4. Swine
- 8.2.5. Poultry
- 8.2.6. Other Animals
- 8.1. Market Analysis, Insights and Forecast - by Product
- 9. Europe US Veterinary Healthcare Industry Analysis, Insights and Forecast, 2021-2033
- 9.1. Market Analysis, Insights and Forecast - by Product
- 9.1.1. Therapeutics
- 9.1.1.1. Vaccines
- 9.1.1.2. Parasiticides
- 9.1.1.3. Anti-infectives
- 9.1.1.4. Medical Feed Additives
- 9.1.1.5. Other Therapeutics
- 9.1.2. Diagnostics
- 9.1.2.1. Immunodiagnostic Tests
- 9.1.2.2. Molecular Diagnostics
- 9.1.2.3. Diagnostic Imaging
- 9.1.2.4. Clinical Chemistry
- 9.1.2.5. Other Diagnostics
- 9.1.1. Therapeutics
- 9.2. Market Analysis, Insights and Forecast - by Animal Type
- 9.2.1. Dogs and Cats
- 9.2.2. Horses
- 9.2.3. Ruminants
- 9.2.4. Swine
- 9.2.5. Poultry
- 9.2.6. Other Animals
- 9.1. Market Analysis, Insights and Forecast - by Product
- 10. Middle East & Africa US Veterinary Healthcare Industry Analysis, Insights and Forecast, 2021-2033
- 10.1. Market Analysis, Insights and Forecast - by Product
- 10.1.1. Therapeutics
- 10.1.1.1. Vaccines
- 10.1.1.2. Parasiticides
- 10.1.1.3. Anti-infectives
- 10.1.1.4. Medical Feed Additives
- 10.1.1.5. Other Therapeutics
- 10.1.2. Diagnostics
- 10.1.2.1. Immunodiagnostic Tests
- 10.1.2.2. Molecular Diagnostics
- 10.1.2.3. Diagnostic Imaging
- 10.1.2.4. Clinical Chemistry
- 10.1.2.5. Other Diagnostics
- 10.1.1. Therapeutics
- 10.2. Market Analysis, Insights and Forecast - by Animal Type
- 10.2.1. Dogs and Cats
- 10.2.2. Horses
- 10.2.3. Ruminants
- 10.2.4. Swine
- 10.2.5. Poultry
- 10.2.6. Other Animals
- 10.1. Market Analysis, Insights and Forecast - by Product
- 11. Asia Pacific US Veterinary Healthcare Industry Analysis, Insights and Forecast, 2021-2033
- 11.1. Market Analysis, Insights and Forecast - by Product
- 11.1.1. Therapeutics
- 11.1.1.1. Vaccines
- 11.1.1.2. Parasiticides
- 11.1.1.3. Anti-infectives
- 11.1.1.4. Medical Feed Additives
- 11.1.1.5. Other Therapeutics
- 11.1.2. Diagnostics
- 11.1.2.1. Immunodiagnostic Tests
- 11.1.2.2. Molecular Diagnostics
- 11.1.2.3. Diagnostic Imaging
- 11.1.2.4. Clinical Chemistry
- 11.1.2.5. Other Diagnostics
- 11.1.1. Therapeutics
- 11.2. Market Analysis, Insights and Forecast - by Animal Type
- 11.2.1. Dogs and Cats
- 11.2.2. Horses
- 11.2.3. Ruminants
- 11.2.4. Swine
- 11.2.5. Poultry
- 11.2.6. Other Animals
- 11.1. Market Analysis, Insights and Forecast - by Product
- 12. Competitive Analysis
- 12.1. Company Profiles
- 12.1.1 Ceva Animal Health Inc
- 12.1.1.1. Company Overview
- 12.1.1.2. Products
- 12.1.1.3. Company Financials
- 12.1.1.4. SWOT Analysis
- 12.1.2 Boehringer Ingelheim International GmbH
- 12.1.2.1. Company Overview
- 12.1.2.2. Products
- 12.1.2.3. Company Financials
- 12.1.2.4. SWOT Analysis
- 12.1.3 Merck & Co Inc
- 12.1.3.1. Company Overview
- 12.1.3.2. Products
- 12.1.3.3. Company Financials
- 12.1.3.4. SWOT Analysis
- 12.1.4 Randox Laboratories Ltd
- 12.1.4.1. Company Overview
- 12.1.4.2. Products
- 12.1.4.3. Company Financials
- 12.1.4.4. SWOT Analysis
- 12.1.5 Phibro Animal Health Corporation*List Not Exhaustive
- 12.1.5.1. Company Overview
- 12.1.5.2. Products
- 12.1.5.3. Company Financials
- 12.1.5.4. SWOT Analysis
- 12.1.6 Vetoquinol
- 12.1.6.1. Company Overview
- 12.1.6.2. Products
- 12.1.6.3. Company Financials
- 12.1.6.4. SWOT Analysis
- 12.1.7 Virbac SA
- 12.1.7.1. Company Overview
- 12.1.7.2. Products
- 12.1.7.3. Company Financials
- 12.1.7.4. SWOT Analysis
- 12.1.8 Elanco Animal Health
- 12.1.8.1. Company Overview
- 12.1.8.2. Products
- 12.1.8.3. Company Financials
- 12.1.8.4. SWOT Analysis
- 12.1.9 Idexx Laboratories
- 12.1.9.1. Company Overview
- 12.1.9.2. Products
- 12.1.9.3. Company Financials
- 12.1.9.4. SWOT Analysis
- 12.1.10 Zoetis Inc
- 12.1.10.1. Company Overview
- 12.1.10.2. Products
- 12.1.10.3. Company Financials
- 12.1.10.4. SWOT Analysis
- 12.1.1 Ceva Animal Health Inc
- 12.2. Market Entropy
- 12.2.1 Company's Key Areas Served
- 12.2.2 Recent Developments
- 12.3. Company Market Share Analysis 2025
- 12.3.1 Top 5 Companies Market Share Analysis
- 12.3.2 Top 3 Companies Market Share Analysis
- 12.4. List of Potential Customers
- 13. Research Methodology
List of Figures
- Figure 1: Global US Veterinary Healthcare Industry Revenue Breakdown (billion, %) by Region 2025 & 2033
- Figure 2: North America US Veterinary Healthcare Industry Revenue (billion), by Product 2025 & 2033
- Figure 3: North America US Veterinary Healthcare Industry Revenue Share (%), by Product 2025 & 2033
- Figure 4: North America US Veterinary Healthcare Industry Revenue (billion), by Animal Type 2025 & 2033
- Figure 5: North America US Veterinary Healthcare Industry Revenue Share (%), by Animal Type 2025 & 2033
- Figure 6: North America US Veterinary Healthcare Industry Revenue (billion), by Country 2025 & 2033
- Figure 7: North America US Veterinary Healthcare Industry Revenue Share (%), by Country 2025 & 2033
- Figure 8: South America US Veterinary Healthcare Industry Revenue (billion), by Product 2025 & 2033
- Figure 9: South America US Veterinary Healthcare Industry Revenue Share (%), by Product 2025 & 2033
- Figure 10: South America US Veterinary Healthcare Industry Revenue (billion), by Animal Type 2025 & 2033
- Figure 11: South America US Veterinary Healthcare Industry Revenue Share (%), by Animal Type 2025 & 2033
- Figure 12: South America US Veterinary Healthcare Industry Revenue (billion), by Country 2025 & 2033
- Figure 13: South America US Veterinary Healthcare Industry Revenue Share (%), by Country 2025 & 2033
- Figure 14: Europe US Veterinary Healthcare Industry Revenue (billion), by Product 2025 & 2033
- Figure 15: Europe US Veterinary Healthcare Industry Revenue Share (%), by Product 2025 & 2033
- Figure 16: Europe US Veterinary Healthcare Industry Revenue (billion), by Animal Type 2025 & 2033
- Figure 17: Europe US Veterinary Healthcare Industry Revenue Share (%), by Animal Type 2025 & 2033
- Figure 18: Europe US Veterinary Healthcare Industry Revenue (billion), by Country 2025 & 2033
- Figure 19: Europe US Veterinary Healthcare Industry Revenue Share (%), by Country 2025 & 2033
- Figure 20: Middle East & Africa US Veterinary Healthcare Industry Revenue (billion), by Product 2025 & 2033
- Figure 21: Middle East & Africa US Veterinary Healthcare Industry Revenue Share (%), by Product 2025 & 2033
- Figure 22: Middle East & Africa US Veterinary Healthcare Industry Revenue (billion), by Animal Type 2025 & 2033
- Figure 23: Middle East & Africa US Veterinary Healthcare Industry Revenue Share (%), by Animal Type 2025 & 2033
- Figure 24: Middle East & Africa US Veterinary Healthcare Industry Revenue (billion), by Country 2025 & 2033
- Figure 25: Middle East & Africa US Veterinary Healthcare Industry Revenue Share (%), by Country 2025 & 2033
- Figure 26: Asia Pacific US Veterinary Healthcare Industry Revenue (billion), by Product 2025 & 2033
- Figure 27: Asia Pacific US Veterinary Healthcare Industry Revenue Share (%), by Product 2025 & 2033
- Figure 28: Asia Pacific US Veterinary Healthcare Industry Revenue (billion), by Animal Type 2025 & 2033
- Figure 29: Asia Pacific US Veterinary Healthcare Industry Revenue Share (%), by Animal Type 2025 & 2033
- Figure 30: Asia Pacific US Veterinary Healthcare Industry Revenue (billion), by Country 2025 & 2033
- Figure 31: Asia Pacific US Veterinary Healthcare Industry Revenue Share (%), by Country 2025 & 2033
List of Tables
- Table 1: Global US Veterinary Healthcare Industry Revenue billion Forecast, by Product 2020 & 2033
- Table 2: Global US Veterinary Healthcare Industry Revenue billion Forecast, by Animal Type 2020 & 2033
- Table 3: Global US Veterinary Healthcare Industry Revenue billion Forecast, by Region 2020 & 2033
- Table 4: Global US Veterinary Healthcare Industry Revenue billion Forecast, by Product 2020 & 2033
- Table 5: Global US Veterinary Healthcare Industry Revenue billion Forecast, by Animal Type 2020 & 2033
- Table 6: Global US Veterinary Healthcare Industry Revenue billion Forecast, by Country 2020 & 2033
- Table 7: United States US Veterinary Healthcare Industry Revenue (billion) Forecast, by Application 2020 & 2033
- Table 8: Canada US Veterinary Healthcare Industry Revenue (billion) Forecast, by Application 2020 & 2033
- Table 9: Mexico US Veterinary Healthcare Industry Revenue (billion) Forecast, by Application 2020 & 2033
- Table 10: Global US Veterinary Healthcare Industry Revenue billion Forecast, by Product 2020 & 2033
- Table 11: Global US Veterinary Healthcare Industry Revenue billion Forecast, by Animal Type 2020 & 2033
- Table 12: Global US Veterinary Healthcare Industry Revenue billion Forecast, by Country 2020 & 2033
- Table 13: Brazil US Veterinary Healthcare Industry Revenue (billion) Forecast, by Application 2020 & 2033
- Table 14: Argentina US Veterinary Healthcare Industry Revenue (billion) Forecast, by Application 2020 & 2033
- Table 15: Rest of South America US Veterinary Healthcare Industry Revenue (billion) Forecast, by Application 2020 & 2033
- Table 16: Global US Veterinary Healthcare Industry Revenue billion Forecast, by Product 2020 & 2033
- Table 17: Global US Veterinary Healthcare Industry Revenue billion Forecast, by Animal Type 2020 & 2033
- Table 18: Global US Veterinary Healthcare Industry Revenue billion Forecast, by Country 2020 & 2033
- Table 19: United Kingdom US Veterinary Healthcare Industry Revenue (billion) Forecast, by Application 2020 & 2033
- Table 20: Germany US Veterinary Healthcare Industry Revenue (billion) Forecast, by Application 2020 & 2033
- Table 21: France US Veterinary Healthcare Industry Revenue (billion) Forecast, by Application 2020 & 2033
- Table 22: Italy US Veterinary Healthcare Industry Revenue (billion) Forecast, by Application 2020 & 2033
- Table 23: Spain US Veterinary Healthcare Industry Revenue (billion) Forecast, by Application 2020 & 2033
- Table 24: Russia US Veterinary Healthcare Industry Revenue (billion) Forecast, by Application 2020 & 2033
- Table 25: Benelux US Veterinary Healthcare Industry Revenue (billion) Forecast, by Application 2020 & 2033
- Table 26: Nordics US Veterinary Healthcare Industry Revenue (billion) Forecast, by Application 2020 & 2033
- Table 27: Rest of Europe US Veterinary Healthcare Industry Revenue (billion) Forecast, by Application 2020 & 2033
- Table 28: Global US Veterinary Healthcare Industry Revenue billion Forecast, by Product 2020 & 2033
- Table 29: Global US Veterinary Healthcare Industry Revenue billion Forecast, by Animal Type 2020 & 2033
- Table 30: Global US Veterinary Healthcare Industry Revenue billion Forecast, by Country 2020 & 2033
- Table 31: Turkey US Veterinary Healthcare Industry Revenue (billion) Forecast, by Application 2020 & 2033
- Table 32: Israel US Veterinary Healthcare Industry Revenue (billion) Forecast, by Application 2020 & 2033
- Table 33: GCC US Veterinary Healthcare Industry Revenue (billion) Forecast, by Application 2020 & 2033
- Table 34: North Africa US Veterinary Healthcare Industry Revenue (billion) Forecast, by Application 2020 & 2033
- Table 35: South Africa US Veterinary Healthcare Industry Revenue (billion) Forecast, by Application 2020 & 2033
- Table 36: Rest of Middle East & Africa US Veterinary Healthcare Industry Revenue (billion) Forecast, by Application 2020 & 2033
- Table 37: Global US Veterinary Healthcare Industry Revenue billion Forecast, by Product 2020 & 2033
- Table 38: Global US Veterinary Healthcare Industry Revenue billion Forecast, by Animal Type 2020 & 2033
- Table 39: Global US Veterinary Healthcare Industry Revenue billion Forecast, by Country 2020 & 2033
- Table 40: China US Veterinary Healthcare Industry Revenue (billion) Forecast, by Application 2020 & 2033
- Table 41: India US Veterinary Healthcare Industry Revenue (billion) Forecast, by Application 2020 & 2033
- Table 42: Japan US Veterinary Healthcare Industry Revenue (billion) Forecast, by Application 2020 & 2033
- Table 43: South Korea US Veterinary Healthcare Industry Revenue (billion) Forecast, by Application 2020 & 2033
- Table 44: ASEAN US Veterinary Healthcare Industry Revenue (billion) Forecast, by Application 2020 & 2033
- Table 45: Oceania US Veterinary Healthcare Industry Revenue (billion) Forecast, by Application 2020 & 2033
- Table 46: Rest of Asia Pacific US Veterinary Healthcare Industry Revenue (billion) Forecast, by Application 2020 & 2033
Frequently Asked Questions
1. What is the projected Compound Annual Growth Rate (CAGR) of the US Veterinary Healthcare Industry?
The projected CAGR is approximately 7.8%.
2. Which companies are prominent players in the US Veterinary Healthcare Industry?
Key companies in the market include Ceva Animal Health Inc, Boehringer Ingelheim International GmbH, Merck & Co Inc, Randox Laboratories Ltd, Phibro Animal Health Corporation*List Not Exhaustive, Vetoquinol, Virbac SA, Elanco Animal Health, Idexx Laboratories, Zoetis Inc.
3. What are the main segments of the US Veterinary Healthcare Industry?
The market segments include Product, Animal Type.
4. Can you provide details about the market size?
The market size is estimated to be USD 65.45 billion as of 2022.
5. What are some drivers contributing to market growth?
Advanced Technology Leading to Innovations in Animal Healthcare; Increasing Productivity at the Risk of Emerging Zoonosis; Increasing Initiatives by the Governments and Animal Welfare Associations.
6. What are the notable trends driving market growth?
Medical Feed Additives Segment Expects to Register a High CAGR in the United States Veterinary Healthcare Market Over the Forecast Period.
7. Are there any restraints impacting market growth?
High Costs Related to Animal Testing.
8. Can you provide examples of recent developments in the market?
In March 2022, LexaGeneHoldings developed a fully automated rapid pathogen testing device LexaGenes MiQLab System and announced advancements to its sample preparation cartridge for processing complex samples. This system s designed to process liquid samples from companion animals used in the diagnosis of infections such as urinary tract infections (UTIs) and skin infections.
9. What pricing options are available for accessing the report?
Pricing options include single-user, multi-user, and enterprise licenses priced at USD 3800, USD 4500, and USD 5800 respectively.
10. Is the market size provided in terms of value or volume?
The market size is provided in terms of value, measured in billion.
11. Are there any specific market keywords associated with the report?
Yes, the market keyword associated with the report is "US Veterinary Healthcare Industry," which aids in identifying and referencing the specific market segment covered.
12. How do I determine which pricing option suits my needs best?
The pricing options vary based on user requirements and access needs. Individual users may opt for single-user licenses, while businesses requiring broader access may choose multi-user or enterprise licenses for cost-effective access to the report.
13. Are there any additional resources or data provided in the US Veterinary Healthcare Industry report?
While the report offers comprehensive insights, it's advisable to review the specific contents or supplementary materials provided to ascertain if additional resources or data are available.
14. How can I stay updated on further developments or reports in the US Veterinary Healthcare Industry?
To stay informed about further developments, trends, and reports in the US Veterinary Healthcare Industry, consider subscribing to industry newsletters, following relevant companies and organizations, or regularly checking reputable industry news sources and publications.
Methodology
Step 1 - Identification of Relevant Samples Size from Population Database


Step 2 - Approaches for Defining Global Market Size (Value, Volume* & Price*)

Note*: In applicable scenarios
Step 3 - Data Sources
Primary Research
- Web Analytics
- Survey Reports
- Research Institute
- Latest Research Reports
- Opinion Leaders
Secondary Research
- Annual Reports
- White Paper
- Latest Press Release
- Industry Association
- Paid Database
- Investor Presentations

Step 4 - Data Triangulation
Involves using different sources of information in order to increase the validity of a study
These sources are likely to be stakeholders in a program - participants, other researchers, program staff, other community members, and so on.
Then we put all data in single framework & apply various statistical tools to find out the dynamic on the market.
During the analysis stage, feedback from the stakeholder groups would be compared to determine areas of agreement as well as areas of divergence