

Key Insights
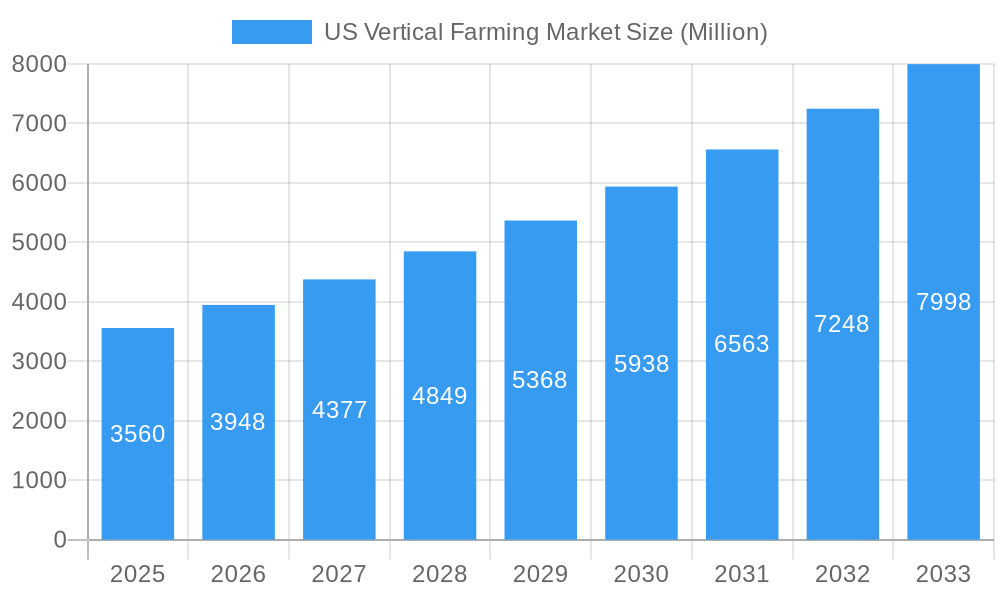
The US vertical farming market, valued at $3.56 billion in 2025, is poised for significant growth, exhibiting a Compound Annual Growth Rate (CAGR) of 10.80% from 2025 to 2033. This expansion is driven by several key factors. Increasing urbanization leads to a higher demand for fresh produce, while simultaneously reducing available arable land. Vertical farming offers a solution by maximizing yield in limited spaces, minimizing transportation costs and reducing environmental impact through reduced water usage and pesticide application. Consumer preference for locally sourced, sustainably grown produce further fuels market growth. Technological advancements in hydroponics, aeroponics, and aquaponics are improving efficiency and yield, making vertical farming increasingly economically viable. The diverse segmentations within the market – encompassing various growth mechanisms, farm structures (from building-based to shipping container farms), and a wide range of crops (fruits, vegetables, herbs, microgreens, and ornamentals) – contribute to its dynamism and appeal to diverse investors and entrepreneurs. The presence of established players like Bowery Farming, Plenty Unlimited, and Aero Farms, alongside emerging companies, indicates a competitive yet innovative landscape. Regional variations in market penetration are expected, with regions like the Northeast and West potentially showing faster adoption rates due to higher population density and consumer awareness.
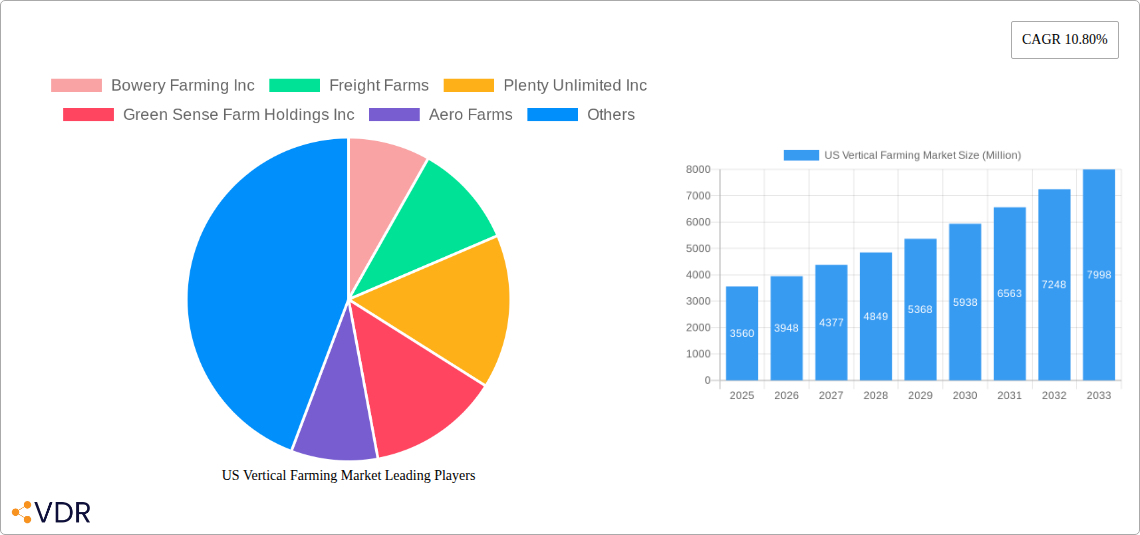
US Vertical Farming Market Market Size (In Billion)
The forecast period (2025-2033) promises robust growth, primarily driven by continuous technological innovation, increasing consumer demand for high-quality produce, and government support for sustainable agricultural practices. However, challenges remain, including high initial investment costs for infrastructure and technology, the need for skilled labor, and potential energy consumption concerns. Overcoming these obstacles will be crucial for sustaining the market's rapid expansion. The ongoing development of more efficient and cost-effective vertical farming technologies, coupled with strategic partnerships and investment in research and development, will be instrumental in shaping the future of this dynamic market segment.
US Vertical Farming Market Company Market Share
US Vertical Farming Market: A Comprehensive Report (2019-2033)
This comprehensive report provides an in-depth analysis of the US vertical farming market, encompassing market dynamics, growth trends, dominant segments, product landscape, key players, and future outlook. The study period covers 2019-2033, with 2025 as the base year and a forecast period of 2025-2033. The report is essential for industry professionals, investors, and anyone seeking to understand this rapidly evolving sector. Market values are presented in million USD.
US Vertical Farming Market Market Dynamics & Structure
The US vertical farming market is characterized by increasing market concentration, driven by significant investments and mergers and acquisitions (M&A). Technological innovation, particularly in areas like aeroponics and hydroponics, is a key growth driver. However, regulatory frameworks and the availability of suitable infrastructure pose challenges. Competitive substitutes, such as traditional farming methods, present ongoing competition. The market exhibits varied end-user demographics, including large retailers, restaurants, and consumers.
- Market Concentration: The market is moderately concentrated, with a few major players holding significant market share (estimated at xx%).
- Technological Innovation: Advancements in automation, lighting, and climate control are accelerating market growth. The adoption of AI and data analytics is also enhancing efficiency and yield.
- Regulatory Framework: Varying regulations across states create complexities for market expansion. Streamlined regulations are crucial for further growth.
- Competitive Substitutes: Traditional farming remains a significant competitor, particularly for commodity crops. However, vertical farming offers advantages in terms of consistency, sustainability, and reduced transportation costs.
- M&A Activity: The number of M&A deals in the sector has increased significantly over the past five years, reflecting industry consolidation. (estimated xx deals in 2024)
- End-User Demographics: Large retail chains and food service providers are major buyers, followed by a growing segment of consumers who value locally sourced, sustainably produced food.
US Vertical Farming Market Growth Trends & Insights
The US vertical farming market experienced substantial growth during the historical period (2019-2024), with a CAGR of xx%. This growth is projected to continue, with a forecast CAGR of xx% from 2025 to 2033. Market penetration is still relatively low but is expected to increase significantly as consumers become more aware of the benefits of vertical farming. Technological disruptions, including automation and improved lighting systems, are driving higher yields and reduced operational costs, making vertical farming more economically viable. Consumer preferences are shifting towards locally sourced, sustainable products, further boosting market demand. Key factors impacting adoption rates include initial investment costs, energy consumption, and scalability challenges. Specific data points will be detailed within the full report.
Dominant Regions, Countries, or Segments in US Vertical Farming Market
The US vertical farming market shows strong regional variation, with the [State/Region- e.g., West Coast] currently dominating due to factors such as high population density, favorable climate for certain crops, and robust venture capital investment. Within growth mechanisms, hydroponics holds the largest market share (xx%) followed by aeroponics (xx%), driven by its relatively lower setup costs and ease of implementation. Building-based vertical farms currently dominate the market structure (xx%), but the shipping container segment is expected to experience high growth, driven by its flexibility and lower land requirements. Fruits and vegetables constitute the largest crop type segment (xx%), while herbs and microgreens exhibit strong growth potential.
- Key Regional Drivers: Proximity to major consumer markets, access to funding, and supportive government policies influence regional dominance.
- Growth Mechanism Drivers: Hydroponics' established infrastructure and lower setup costs are key factors behind its current dominance. Aeroponics' potential for higher yields and water efficiency will fuel its future growth.
- Structure Drivers: Building-based farms offer greater scale and control, but shipping containers are becoming more attractive due to flexibility and reduced land constraints.
- Crop Type Drivers: High consumer demand for fresh produce drives growth in fruits and vegetables, while the increasing popularity of healthy foods boosts demand for herbs and microgreens.
US Vertical Farming Market Product Landscape
Vertical farming products are constantly evolving, with innovations focused on increasing yield, improving efficiency, and enhancing the quality of produce. Technological advancements in LED lighting, sensors, and automation are key to optimizing growth conditions and reducing operational costs. Unique selling propositions often center on sustainability, traceability, and the ability to produce high-quality produce year-round, regardless of external environmental conditions.
Key Drivers, Barriers & Challenges in US Vertical Farming Market
Key Drivers: Growing consumer demand for locally sourced food, increasing concerns about food security, the need for sustainable agriculture practices, and technological advancements are driving market growth.
Challenges: High initial investment costs, energy consumption, and the need for specialized skills are major barriers. Regulatory hurdles and competition from traditional agriculture methods also pose challenges. Supply chain complexities and securing consistent, high-quality inputs are additional factors limiting scalability.
Emerging Opportunities in US Vertical Farming Market
Emerging opportunities lie in exploring untapped markets, such as remote areas with limited access to fresh produce, and developing innovative applications, such as vertical farming for specific niche crops or using vertical farms for integrated pest management. Evolving consumer preferences for sustainable and traceable food products present significant growth potential.
Growth Accelerators in the US Vertical Farming Market Industry
Technological breakthroughs in areas like AI-powered automation and precision agriculture are expected to drive significant growth in the sector. Strategic partnerships between vertical farming companies and large retailers are increasing access to markets and reducing distribution costs. Expansion into new geographic areas and diversification into new crop types will further accelerate market growth.
Key Players Shaping the US Vertical Farming Market Market
- Bowery Farming Inc
- Freight Farms
- Plenty Unlimited Inc
- Green Sense Farm Holdings Inc
- Aero Farms
- Altius Farm
- Green Spirit Farms
Notable Milestones in US Vertical Farming Market Sector
- August 2023: Plenty Unlimited Inc. begins construction of a USD 300 million vertical farming campus, expected to be the world's largest.
- February 2022: Aero Farms announces a tomato research partnership with FFAR and the University of Florida.
- January 2022: Plenty and Walmart announce a long-term investment to supply fresh produce.
In-Depth US Vertical Farming Market Market Outlook
The US vertical farming market is poised for significant growth in the coming years, driven by technological advancements, increasing consumer demand for sustainable food, and strategic investments. The focus on improving efficiency, reducing operational costs, and expanding into new markets will be key to unlocking the full potential of this innovative sector. Opportunities exist in developing specialized vertical farming systems for specific crop types and optimizing energy consumption through innovative solutions. The market is projected to reach xx million USD by 2033.
US Vertical Farming Market Segmentation
- 1. Production Analysis
- 2. Consumption Analysis
- 3. Import Market Analysis (Value & Volume)
- 4. Export Market Analysis (Value & Volume)
- 5. Price Trend Analysis
US Vertical Farming Market Segmentation By Geography
-
1. North America
- 1.1. United States
- 1.2. Canada
- 1.3. Mexico
-
2. South America
- 2.1. Brazil
- 2.2. Argentina
- 2.3. Rest of South America
-
3. Europe
- 3.1. United Kingdom
- 3.2. Germany
- 3.3. France
- 3.4. Italy
- 3.5. Spain
- 3.6. Russia
- 3.7. Benelux
- 3.8. Nordics
- 3.9. Rest of Europe
-
4. Middle East & Africa
- 4.1. Turkey
- 4.2. Israel
- 4.3. GCC
- 4.4. North Africa
- 4.5. South Africa
- 4.6. Rest of Middle East & Africa
-
5. Asia Pacific
- 5.1. China
- 5.2. India
- 5.3. Japan
- 5.4. South Korea
- 5.5. ASEAN
- 5.6. Oceania
- 5.7. Rest of Asia Pacific
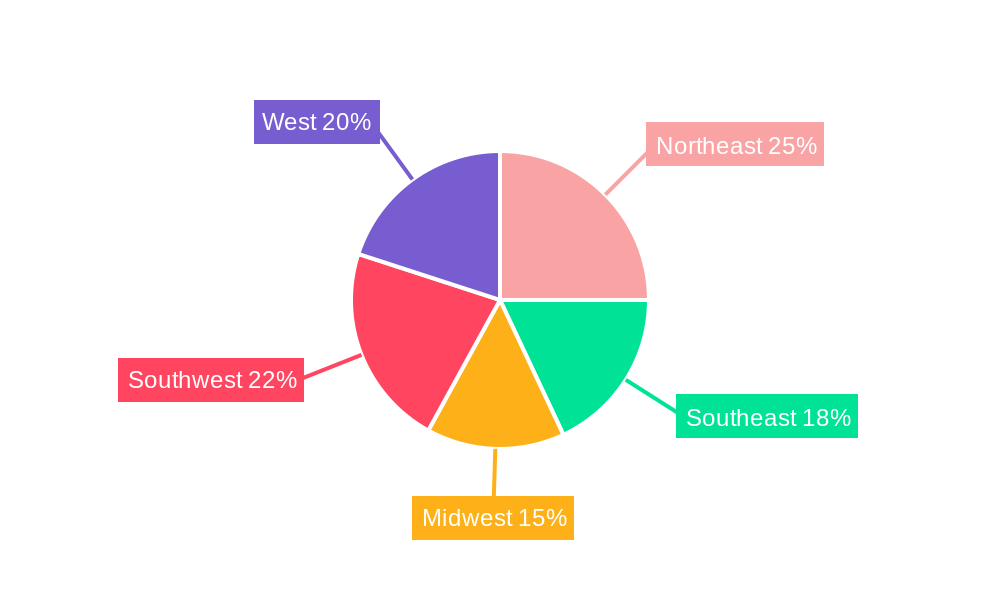
US Vertical Farming Market Regional Market Share
Geographic Coverage of US Vertical Farming Market
US Vertical Farming Market REPORT HIGHLIGHTS
| Aspects | Details |
|---|---|
| Study Period | 2020-2034 |
| Base Year | 2025 |
| Estimated Year | 2026 |
| Forecast Period | 2026-2034 |
| Historical Period | 2020-2025 |
| Growth Rate | CAGR of 10.80% from 2020-2034 |
| Segmentation |
|
Table of Contents
- 1. Introduction
- 1.1. Research Scope
- 1.2. Market Segmentation
- 1.3. Research Objective
- 1.4. Definitions and Assumptions
- 2. Executive Summary
- 2.1. Market Snapshot
- 3. Market Dynamics
- 3.1. Market Drivers
- 3.2. Market Restrains
- 3.3. Market Trends
- 3.4. Market Opportunities
- 4. Market Factor Analysis
- 4.1. Porters Five Forces
- 4.1.1. Bargaining Power of Suppliers
- 4.1.2. Bargaining Power of Buyers
- 4.1.3. Threat of New Entrants
- 4.1.4. Threat of Substitutes
- 4.1.5. Competitive Rivalry
- 4.2. PESTEL analysis
- 4.3. BCG Analysis
- 4.3.1. Stars (High Growth, High Market Share)
- 4.3.2. Cash Cows (Low Growth, High Market Share)
- 4.3.3. Question Mark (High Growth, Low Market Share)
- 4.3.4. Dogs (Low Growth, Low Market Share)
- 4.4. Ansoff Matrix Analysis
- 4.5. Supply Chain Analysis
- 4.6. Regulatory Landscape
- 4.7. Current Market Potential and Opportunity Assessment (TAM–SAM–SOM Framework)
- 4.8. VDR Analyst Note
- 4.1. Porters Five Forces
- 5. Market Analysis, Insights and Forecast 2021-2033
- 5.1. Market Analysis, Insights and Forecast - by Production Analysis
- 5.2. Market Analysis, Insights and Forecast - by Consumption Analysis
- 5.3. Market Analysis, Insights and Forecast - by Import Market Analysis (Value & Volume)
- 5.4. Market Analysis, Insights and Forecast - by Export Market Analysis (Value & Volume)
- 5.5. Market Analysis, Insights and Forecast - by Price Trend Analysis
- 5.6. Market Analysis, Insights and Forecast - by Region
- 5.6.1. North America
- 5.6.2. South America
- 5.6.3. Europe
- 5.6.4. Middle East & Africa
- 5.6.5. Asia Pacific
- 6. Global US Vertical Farming Market Analysis, Insights and Forecast, 2021-2033
- 6.1. Market Analysis, Insights and Forecast - by Production Analysis
- 6.2. Market Analysis, Insights and Forecast - by Consumption Analysis
- 6.3. Market Analysis, Insights and Forecast - by Import Market Analysis (Value & Volume)
- 6.4. Market Analysis, Insights and Forecast - by Export Market Analysis (Value & Volume)
- 6.5. Market Analysis, Insights and Forecast - by Price Trend Analysis
- 7. North America US Vertical Farming Market Analysis, Insights and Forecast, 2021-2033
- 7.1. Market Analysis, Insights and Forecast - by Production Analysis
- 7.2. Market Analysis, Insights and Forecast - by Consumption Analysis
- 7.3. Market Analysis, Insights and Forecast - by Import Market Analysis (Value & Volume)
- 7.4. Market Analysis, Insights and Forecast - by Export Market Analysis (Value & Volume)
- 7.5. Market Analysis, Insights and Forecast - by Price Trend Analysis
- 8. South America US Vertical Farming Market Analysis, Insights and Forecast, 2021-2033
- 8.1. Market Analysis, Insights and Forecast - by Production Analysis
- 8.2. Market Analysis, Insights and Forecast - by Consumption Analysis
- 8.3. Market Analysis, Insights and Forecast - by Import Market Analysis (Value & Volume)
- 8.4. Market Analysis, Insights and Forecast - by Export Market Analysis (Value & Volume)
- 8.5. Market Analysis, Insights and Forecast - by Price Trend Analysis
- 9. Europe US Vertical Farming Market Analysis, Insights and Forecast, 2021-2033
- 9.1. Market Analysis, Insights and Forecast - by Production Analysis
- 9.2. Market Analysis, Insights and Forecast - by Consumption Analysis
- 9.3. Market Analysis, Insights and Forecast - by Import Market Analysis (Value & Volume)
- 9.4. Market Analysis, Insights and Forecast - by Export Market Analysis (Value & Volume)
- 9.5. Market Analysis, Insights and Forecast - by Price Trend Analysis
- 10. Middle East & Africa US Vertical Farming Market Analysis, Insights and Forecast, 2021-2033
- 10.1. Market Analysis, Insights and Forecast - by Production Analysis
- 10.2. Market Analysis, Insights and Forecast - by Consumption Analysis
- 10.3. Market Analysis, Insights and Forecast - by Import Market Analysis (Value & Volume)
- 10.4. Market Analysis, Insights and Forecast - by Export Market Analysis (Value & Volume)
- 10.5. Market Analysis, Insights and Forecast - by Price Trend Analysis
- 11. Asia Pacific US Vertical Farming Market Analysis, Insights and Forecast, 2021-2033
- 11.1. Market Analysis, Insights and Forecast - by Production Analysis
- 11.2. Market Analysis, Insights and Forecast - by Consumption Analysis
- 11.3. Market Analysis, Insights and Forecast - by Import Market Analysis (Value & Volume)
- 11.4. Market Analysis, Insights and Forecast - by Export Market Analysis (Value & Volume)
- 11.5. Market Analysis, Insights and Forecast - by Price Trend Analysis
- 12. Competitive Analysis
- 12.1. Company Profiles
- 12.1.1 Bowery Farming Inc
- 12.1.1.1. Company Overview
- 12.1.1.2. Products
- 12.1.1.3. Company Financials
- 12.1.1.4. SWOT Analysis
- 12.1.2 Freight Farms
- 12.1.2.1. Company Overview
- 12.1.2.2. Products
- 12.1.2.3. Company Financials
- 12.1.2.4. SWOT Analysis
- 12.1.3 Plenty Unlimited Inc
- 12.1.3.1. Company Overview
- 12.1.3.2. Products
- 12.1.3.3. Company Financials
- 12.1.3.4. SWOT Analysis
- 12.1.4 Green Sense Farm Holdings Inc
- 12.1.4.1. Company Overview
- 12.1.4.2. Products
- 12.1.4.3. Company Financials
- 12.1.4.4. SWOT Analysis
- 12.1.5 Aero Farms
- 12.1.5.1. Company Overview
- 12.1.5.2. Products
- 12.1.5.3. Company Financials
- 12.1.5.4. SWOT Analysis
- 12.1.6 Altius Farm
- 12.1.6.1. Company Overview
- 12.1.6.2. Products
- 12.1.6.3. Company Financials
- 12.1.6.4. SWOT Analysis
- 12.1.7 Green Spirit Farms
- 12.1.7.1. Company Overview
- 12.1.7.2. Products
- 12.1.7.3. Company Financials
- 12.1.7.4. SWOT Analysis
- 12.1.1 Bowery Farming Inc
- 12.2. Market Entropy
- 12.2.1 Company's Key Areas Served
- 12.2.2 Recent Developments
- 12.3. Company Market Share Analysis 2025
- 12.3.1 Top 5 Companies Market Share Analysis
- 12.3.2 Top 3 Companies Market Share Analysis
- 12.4. List of Potential Customers
- 13. Research Methodology
List of Figures
- Figure 1: Global US Vertical Farming Market Revenue Breakdown (Million, %) by Region 2025 & 2033
- Figure 2: North America US Vertical Farming Market Revenue (Million), by Production Analysis 2025 & 2033
- Figure 3: North America US Vertical Farming Market Revenue Share (%), by Production Analysis 2025 & 2033
- Figure 4: North America US Vertical Farming Market Revenue (Million), by Consumption Analysis 2025 & 2033
- Figure 5: North America US Vertical Farming Market Revenue Share (%), by Consumption Analysis 2025 & 2033
- Figure 6: North America US Vertical Farming Market Revenue (Million), by Import Market Analysis (Value & Volume) 2025 & 2033
- Figure 7: North America US Vertical Farming Market Revenue Share (%), by Import Market Analysis (Value & Volume) 2025 & 2033
- Figure 8: North America US Vertical Farming Market Revenue (Million), by Export Market Analysis (Value & Volume) 2025 & 2033
- Figure 9: North America US Vertical Farming Market Revenue Share (%), by Export Market Analysis (Value & Volume) 2025 & 2033
- Figure 10: North America US Vertical Farming Market Revenue (Million), by Price Trend Analysis 2025 & 2033
- Figure 11: North America US Vertical Farming Market Revenue Share (%), by Price Trend Analysis 2025 & 2033
- Figure 12: North America US Vertical Farming Market Revenue (Million), by Country 2025 & 2033
- Figure 13: North America US Vertical Farming Market Revenue Share (%), by Country 2025 & 2033
- Figure 14: South America US Vertical Farming Market Revenue (Million), by Production Analysis 2025 & 2033
- Figure 15: South America US Vertical Farming Market Revenue Share (%), by Production Analysis 2025 & 2033
- Figure 16: South America US Vertical Farming Market Revenue (Million), by Consumption Analysis 2025 & 2033
- Figure 17: South America US Vertical Farming Market Revenue Share (%), by Consumption Analysis 2025 & 2033
- Figure 18: South America US Vertical Farming Market Revenue (Million), by Import Market Analysis (Value & Volume) 2025 & 2033
- Figure 19: South America US Vertical Farming Market Revenue Share (%), by Import Market Analysis (Value & Volume) 2025 & 2033
- Figure 20: South America US Vertical Farming Market Revenue (Million), by Export Market Analysis (Value & Volume) 2025 & 2033
- Figure 21: South America US Vertical Farming Market Revenue Share (%), by Export Market Analysis (Value & Volume) 2025 & 2033
- Figure 22: South America US Vertical Farming Market Revenue (Million), by Price Trend Analysis 2025 & 2033
- Figure 23: South America US Vertical Farming Market Revenue Share (%), by Price Trend Analysis 2025 & 2033
- Figure 24: South America US Vertical Farming Market Revenue (Million), by Country 2025 & 2033
- Figure 25: South America US Vertical Farming Market Revenue Share (%), by Country 2025 & 2033
- Figure 26: Europe US Vertical Farming Market Revenue (Million), by Production Analysis 2025 & 2033
- Figure 27: Europe US Vertical Farming Market Revenue Share (%), by Production Analysis 2025 & 2033
- Figure 28: Europe US Vertical Farming Market Revenue (Million), by Consumption Analysis 2025 & 2033
- Figure 29: Europe US Vertical Farming Market Revenue Share (%), by Consumption Analysis 2025 & 2033
- Figure 30: Europe US Vertical Farming Market Revenue (Million), by Import Market Analysis (Value & Volume) 2025 & 2033
- Figure 31: Europe US Vertical Farming Market Revenue Share (%), by Import Market Analysis (Value & Volume) 2025 & 2033
- Figure 32: Europe US Vertical Farming Market Revenue (Million), by Export Market Analysis (Value & Volume) 2025 & 2033
- Figure 33: Europe US Vertical Farming Market Revenue Share (%), by Export Market Analysis (Value & Volume) 2025 & 2033
- Figure 34: Europe US Vertical Farming Market Revenue (Million), by Price Trend Analysis 2025 & 2033
- Figure 35: Europe US Vertical Farming Market Revenue Share (%), by Price Trend Analysis 2025 & 2033
- Figure 36: Europe US Vertical Farming Market Revenue (Million), by Country 2025 & 2033
- Figure 37: Europe US Vertical Farming Market Revenue Share (%), by Country 2025 & 2033
- Figure 38: Middle East & Africa US Vertical Farming Market Revenue (Million), by Production Analysis 2025 & 2033
- Figure 39: Middle East & Africa US Vertical Farming Market Revenue Share (%), by Production Analysis 2025 & 2033
- Figure 40: Middle East & Africa US Vertical Farming Market Revenue (Million), by Consumption Analysis 2025 & 2033
- Figure 41: Middle East & Africa US Vertical Farming Market Revenue Share (%), by Consumption Analysis 2025 & 2033
- Figure 42: Middle East & Africa US Vertical Farming Market Revenue (Million), by Import Market Analysis (Value & Volume) 2025 & 2033
- Figure 43: Middle East & Africa US Vertical Farming Market Revenue Share (%), by Import Market Analysis (Value & Volume) 2025 & 2033
- Figure 44: Middle East & Africa US Vertical Farming Market Revenue (Million), by Export Market Analysis (Value & Volume) 2025 & 2033
- Figure 45: Middle East & Africa US Vertical Farming Market Revenue Share (%), by Export Market Analysis (Value & Volume) 2025 & 2033
- Figure 46: Middle East & Africa US Vertical Farming Market Revenue (Million), by Price Trend Analysis 2025 & 2033
- Figure 47: Middle East & Africa US Vertical Farming Market Revenue Share (%), by Price Trend Analysis 2025 & 2033
- Figure 48: Middle East & Africa US Vertical Farming Market Revenue (Million), by Country 2025 & 2033
- Figure 49: Middle East & Africa US Vertical Farming Market Revenue Share (%), by Country 2025 & 2033
- Figure 50: Asia Pacific US Vertical Farming Market Revenue (Million), by Production Analysis 2025 & 2033
- Figure 51: Asia Pacific US Vertical Farming Market Revenue Share (%), by Production Analysis 2025 & 2033
- Figure 52: Asia Pacific US Vertical Farming Market Revenue (Million), by Consumption Analysis 2025 & 2033
- Figure 53: Asia Pacific US Vertical Farming Market Revenue Share (%), by Consumption Analysis 2025 & 2033
- Figure 54: Asia Pacific US Vertical Farming Market Revenue (Million), by Import Market Analysis (Value & Volume) 2025 & 2033
- Figure 55: Asia Pacific US Vertical Farming Market Revenue Share (%), by Import Market Analysis (Value & Volume) 2025 & 2033
- Figure 56: Asia Pacific US Vertical Farming Market Revenue (Million), by Export Market Analysis (Value & Volume) 2025 & 2033
- Figure 57: Asia Pacific US Vertical Farming Market Revenue Share (%), by Export Market Analysis (Value & Volume) 2025 & 2033
- Figure 58: Asia Pacific US Vertical Farming Market Revenue (Million), by Price Trend Analysis 2025 & 2033
- Figure 59: Asia Pacific US Vertical Farming Market Revenue Share (%), by Price Trend Analysis 2025 & 2033
- Figure 60: Asia Pacific US Vertical Farming Market Revenue (Million), by Country 2025 & 2033
- Figure 61: Asia Pacific US Vertical Farming Market Revenue Share (%), by Country 2025 & 2033
List of Tables
- Table 1: Global US Vertical Farming Market Revenue Million Forecast, by Production Analysis 2020 & 2033
- Table 2: Global US Vertical Farming Market Revenue Million Forecast, by Consumption Analysis 2020 & 2033
- Table 3: Global US Vertical Farming Market Revenue Million Forecast, by Import Market Analysis (Value & Volume) 2020 & 2033
- Table 4: Global US Vertical Farming Market Revenue Million Forecast, by Export Market Analysis (Value & Volume) 2020 & 2033
- Table 5: Global US Vertical Farming Market Revenue Million Forecast, by Price Trend Analysis 2020 & 2033
- Table 6: Global US Vertical Farming Market Revenue Million Forecast, by Region 2020 & 2033
- Table 7: Global US Vertical Farming Market Revenue Million Forecast, by Production Analysis 2020 & 2033
- Table 8: Global US Vertical Farming Market Revenue Million Forecast, by Consumption Analysis 2020 & 2033
- Table 9: Global US Vertical Farming Market Revenue Million Forecast, by Import Market Analysis (Value & Volume) 2020 & 2033
- Table 10: Global US Vertical Farming Market Revenue Million Forecast, by Export Market Analysis (Value & Volume) 2020 & 2033
- Table 11: Global US Vertical Farming Market Revenue Million Forecast, by Price Trend Analysis 2020 & 2033
- Table 12: Global US Vertical Farming Market Revenue Million Forecast, by Country 2020 & 2033
- Table 13: United States US Vertical Farming Market Revenue (Million) Forecast, by Application 2020 & 2033
- Table 14: Canada US Vertical Farming Market Revenue (Million) Forecast, by Application 2020 & 2033
- Table 15: Mexico US Vertical Farming Market Revenue (Million) Forecast, by Application 2020 & 2033
- Table 16: Global US Vertical Farming Market Revenue Million Forecast, by Production Analysis 2020 & 2033
- Table 17: Global US Vertical Farming Market Revenue Million Forecast, by Consumption Analysis 2020 & 2033
- Table 18: Global US Vertical Farming Market Revenue Million Forecast, by Import Market Analysis (Value & Volume) 2020 & 2033
- Table 19: Global US Vertical Farming Market Revenue Million Forecast, by Export Market Analysis (Value & Volume) 2020 & 2033
- Table 20: Global US Vertical Farming Market Revenue Million Forecast, by Price Trend Analysis 2020 & 2033
- Table 21: Global US Vertical Farming Market Revenue Million Forecast, by Country 2020 & 2033
- Table 22: Brazil US Vertical Farming Market Revenue (Million) Forecast, by Application 2020 & 2033
- Table 23: Argentina US Vertical Farming Market Revenue (Million) Forecast, by Application 2020 & 2033
- Table 24: Rest of South America US Vertical Farming Market Revenue (Million) Forecast, by Application 2020 & 2033
- Table 25: Global US Vertical Farming Market Revenue Million Forecast, by Production Analysis 2020 & 2033
- Table 26: Global US Vertical Farming Market Revenue Million Forecast, by Consumption Analysis 2020 & 2033
- Table 27: Global US Vertical Farming Market Revenue Million Forecast, by Import Market Analysis (Value & Volume) 2020 & 2033
- Table 28: Global US Vertical Farming Market Revenue Million Forecast, by Export Market Analysis (Value & Volume) 2020 & 2033
- Table 29: Global US Vertical Farming Market Revenue Million Forecast, by Price Trend Analysis 2020 & 2033
- Table 30: Global US Vertical Farming Market Revenue Million Forecast, by Country 2020 & 2033
- Table 31: United Kingdom US Vertical Farming Market Revenue (Million) Forecast, by Application 2020 & 2033
- Table 32: Germany US Vertical Farming Market Revenue (Million) Forecast, by Application 2020 & 2033
- Table 33: France US Vertical Farming Market Revenue (Million) Forecast, by Application 2020 & 2033
- Table 34: Italy US Vertical Farming Market Revenue (Million) Forecast, by Application 2020 & 2033
- Table 35: Spain US Vertical Farming Market Revenue (Million) Forecast, by Application 2020 & 2033
- Table 36: Russia US Vertical Farming Market Revenue (Million) Forecast, by Application 2020 & 2033
- Table 37: Benelux US Vertical Farming Market Revenue (Million) Forecast, by Application 2020 & 2033
- Table 38: Nordics US Vertical Farming Market Revenue (Million) Forecast, by Application 2020 & 2033
- Table 39: Rest of Europe US Vertical Farming Market Revenue (Million) Forecast, by Application 2020 & 2033
- Table 40: Global US Vertical Farming Market Revenue Million Forecast, by Production Analysis 2020 & 2033
- Table 41: Global US Vertical Farming Market Revenue Million Forecast, by Consumption Analysis 2020 & 2033
- Table 42: Global US Vertical Farming Market Revenue Million Forecast, by Import Market Analysis (Value & Volume) 2020 & 2033
- Table 43: Global US Vertical Farming Market Revenue Million Forecast, by Export Market Analysis (Value & Volume) 2020 & 2033
- Table 44: Global US Vertical Farming Market Revenue Million Forecast, by Price Trend Analysis 2020 & 2033
- Table 45: Global US Vertical Farming Market Revenue Million Forecast, by Country 2020 & 2033
- Table 46: Turkey US Vertical Farming Market Revenue (Million) Forecast, by Application 2020 & 2033
- Table 47: Israel US Vertical Farming Market Revenue (Million) Forecast, by Application 2020 & 2033
- Table 48: GCC US Vertical Farming Market Revenue (Million) Forecast, by Application 2020 & 2033
- Table 49: North Africa US Vertical Farming Market Revenue (Million) Forecast, by Application 2020 & 2033
- Table 50: South Africa US Vertical Farming Market Revenue (Million) Forecast, by Application 2020 & 2033
- Table 51: Rest of Middle East & Africa US Vertical Farming Market Revenue (Million) Forecast, by Application 2020 & 2033
- Table 52: Global US Vertical Farming Market Revenue Million Forecast, by Production Analysis 2020 & 2033
- Table 53: Global US Vertical Farming Market Revenue Million Forecast, by Consumption Analysis 2020 & 2033
- Table 54: Global US Vertical Farming Market Revenue Million Forecast, by Import Market Analysis (Value & Volume) 2020 & 2033
- Table 55: Global US Vertical Farming Market Revenue Million Forecast, by Export Market Analysis (Value & Volume) 2020 & 2033
- Table 56: Global US Vertical Farming Market Revenue Million Forecast, by Price Trend Analysis 2020 & 2033
- Table 57: Global US Vertical Farming Market Revenue Million Forecast, by Country 2020 & 2033
- Table 58: China US Vertical Farming Market Revenue (Million) Forecast, by Application 2020 & 2033
- Table 59: India US Vertical Farming Market Revenue (Million) Forecast, by Application 2020 & 2033
- Table 60: Japan US Vertical Farming Market Revenue (Million) Forecast, by Application 2020 & 2033
- Table 61: South Korea US Vertical Farming Market Revenue (Million) Forecast, by Application 2020 & 2033
- Table 62: ASEAN US Vertical Farming Market Revenue (Million) Forecast, by Application 2020 & 2033
- Table 63: Oceania US Vertical Farming Market Revenue (Million) Forecast, by Application 2020 & 2033
- Table 64: Rest of Asia Pacific US Vertical Farming Market Revenue (Million) Forecast, by Application 2020 & 2033
Frequently Asked Questions
1. What is the projected Compound Annual Growth Rate (CAGR) of the US Vertical Farming Market?
The projected CAGR is approximately 10.80%.
2. Which companies are prominent players in the US Vertical Farming Market?
Key companies in the market include Bowery Farming Inc, Freight Farms, Plenty Unlimited Inc, Green Sense Farm Holdings Inc, Aero Farms, Altius Farm, Green Spirit Farms.
3. What are the main segments of the US Vertical Farming Market?
The market segments include Production Analysis, Consumption Analysis, Import Market Analysis (Value & Volume), Export Market Analysis (Value & Volume), Price Trend Analysis.
4. Can you provide details about the market size?
The market size is estimated to be USD 3.56 Million as of 2022.
5. What are some drivers contributing to market growth?
Seed Treatment As A Solution To Enhance Yield; Growing Awareness For Seed Treatment Among The Farmers; Rising Trend Of Organic Farming.
6. What are the notable trends driving market growth?
The Hydroponics Segment Dominates the Market.
7. Are there any restraints impacting market growth?
Limitations Across Farm-Level Seed Treatment; Rising Environmental Concerns.
8. Can you provide examples of recent developments in the market?
August 2023: Plenty Unlimited Inc., a San Francisco-based company, began construction on a vertical indoor farming campus that, when completed, is likely to be the largest such operation in the world. The campus, to be developed in phases totaling USD 300 million, will sit on 120 acres in the Meadowville Technology Park.
9. What pricing options are available for accessing the report?
Pricing options include single-user, multi-user, and enterprise licenses priced at USD 3800, USD 4500, and USD 5800 respectively.
10. Is the market size provided in terms of value or volume?
The market size is provided in terms of value, measured in Million.
11. Are there any specific market keywords associated with the report?
Yes, the market keyword associated with the report is "US Vertical Farming Market," which aids in identifying and referencing the specific market segment covered.
12. How do I determine which pricing option suits my needs best?
The pricing options vary based on user requirements and access needs. Individual users may opt for single-user licenses, while businesses requiring broader access may choose multi-user or enterprise licenses for cost-effective access to the report.
13. Are there any additional resources or data provided in the US Vertical Farming Market report?
While the report offers comprehensive insights, it's advisable to review the specific contents or supplementary materials provided to ascertain if additional resources or data are available.
14. How can I stay updated on further developments or reports in the US Vertical Farming Market?
To stay informed about further developments, trends, and reports in the US Vertical Farming Market, consider subscribing to industry newsletters, following relevant companies and organizations, or regularly checking reputable industry news sources and publications.
Methodology
Step 1 - Identification of Relevant Samples Size from Population Database


Step 2 - Approaches for Defining Global Market Size (Value, Volume* & Price*)

Note*: In applicable scenarios
Step 3 - Data Sources
Primary Research
- Web Analytics
- Survey Reports
- Research Institute
- Latest Research Reports
- Opinion Leaders
Secondary Research
- Annual Reports
- White Paper
- Latest Press Release
- Industry Association
- Paid Database
- Investor Presentations

Step 4 - Data Triangulation
Involves using different sources of information in order to increase the validity of a study
These sources are likely to be stakeholders in a program - participants, other researchers, program staff, other community members, and so on.
Then we put all data in single framework & apply various statistical tools to find out the dynamic on the market.
During the analysis stage, feedback from the stakeholder groups would be compared to determine areas of agreement as well as areas of divergence