

Key Insights
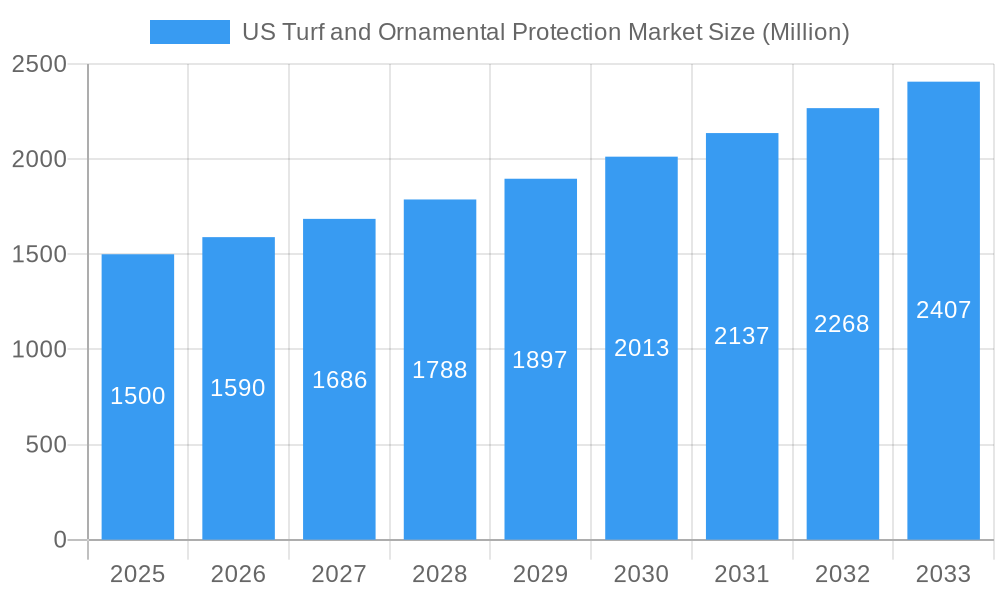
The US Turf and Ornamental Protection Market, including fungicides, herbicides, insecticides, molluscicides, and nematicides, is a robust sector demonstrating consistent expansion. Key growth drivers include increasing urbanization, rising disposable incomes fueling landscaping investments, and heightened awareness of pest and disease management across residential and commercial properties. Demand is propelled by the desire for aesthetically pleasing and healthy lawns and landscapes, necessitating effective protection solutions. Predominant application methods comprise foliar treatments, soil applications, and chemigation. While regulatory hurdles for new product approvals and environmental considerations associated with chemical use present challenges, innovation in biopesticides and integrated pest management (IPM) strategies is actively addressing these concerns. Leading industry players such as Syngenta, BASF, FMC, and Corteva are investing significantly in research and development to pioneer advanced, sustainable solutions. Insecticides and fungicides are anticipated to command the largest market shares, reflecting the prevalence of infestations. Geographically, the Northeast and West regions, with substantial residential and commercial landscaping sectors, are expected to be major market contributors. With a CAGR of 3.1% and a projected market size of $4.91 billion in the base year 2025, the market is positioned for significant growth through 2033.
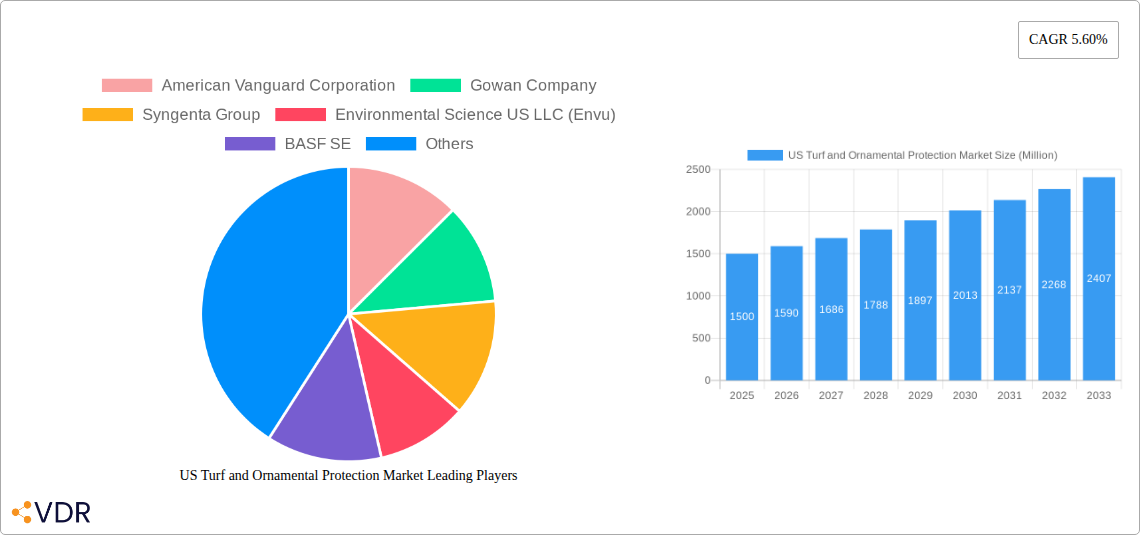
US Turf and Ornamental Protection Market Market Size (In Billion)
The competitive environment features a mix of multinational corporations and specialized firms vying for market share through product innovation, competitive pricing, and robust distribution networks. Future expansion will be shaped by advancements in biological control agents, the increasing adoption of precision agriculture for targeted application, and regulatory frameworks promoting sustainable pest management. The ongoing development and integration of eco-friendly solutions will be critical in defining the future trajectory of the US Turf and Ornamental Protection Market. Educational campaigns emphasizing responsible pesticide use are also expected to positively influence market growth and sustainability.
US Turf and Ornamental Protection Market Company Market Share
US Turf and Ornamental Protection Market: A Comprehensive Report (2019-2033)
This in-depth report provides a comprehensive analysis of the US Turf and Ornamental Protection market, covering market dynamics, growth trends, key players, and future outlook. The study period spans from 2019 to 2033, with 2025 serving as the base and estimated year. This report is essential for industry professionals, investors, and stakeholders seeking to understand this dynamic market and capitalize on emerging opportunities. The report segments the market by function (Fungicide, Herbicide, Insecticide, Molluscicide, Nematicide) and application mode (Chemigation, Foliar, Fumigation, Seed Treatment, Soil Treatment), providing granular insights into each segment's performance and growth potential.
US Turf and Ornamental Protection Market Market Dynamics & Structure
The US Turf and Ornamental Protection market is characterized by moderate concentration, with several multinational corporations holding significant market share. Key drivers include technological innovation in formulation and application methods, stringent regulatory frameworks governing pesticide use, and increasing demand for high-performing, environmentally friendly products. The market also witnesses continuous M&A activity, consolidating market players and shaping the competitive landscape. Substitute products like biological controls are gaining traction, although their market penetration remains relatively low compared to traditional chemical solutions. The end-user base spans residential, commercial, and public landscaping sectors, each exhibiting unique needs and purchasing patterns.
- Market Concentration: Moderately concentrated, with top 10 players holding approximately xx% of the market share in 2025.
- Technological Innovation: Focus on developing targeted, low-impact formulations; advancements in application technologies like drones and precision spraying systems.
- Regulatory Framework: Stringent EPA regulations drive the adoption of safer, more environmentally friendly products.
- Competitive Substitutes: Biological controls and integrated pest management (IPM) strategies are emerging as viable alternatives but currently hold a xx% market share.
- End-User Demographics: Residential landscaping shows steady growth, while commercial and public sectors drive demand for larger-scale solutions.
- M&A Trends: A moderate level of M&A activity observed in the historical period (2019-2024), with approximately xx deals completed, primarily focusing on expanding product portfolios and geographical reach.
US Turf and Ornamental Protection Market Growth Trends & Insights
The US Turf and Ornamental Protection market experienced steady growth during the historical period (2019-2024), driven by increasing urbanization, rising disposable incomes, and a growing preference for aesthetically pleasing landscapes. The market size reached xx million units in 2024, exhibiting a CAGR of xx% during this period. Technological advancements, such as the development of more effective and environmentally friendly products, have further accelerated market growth. Adoption rates of new technologies vary across segments, with foliar application remaining dominant. Consumer behavior is shifting towards a preference for eco-conscious options, impacting product development and marketing strategies. The forecast period (2025-2033) anticipates continued growth, with a projected CAGR of xx%, driven by sustained demand and innovative product introductions. Market penetration of biological controls is expected to increase, albeit gradually, reaching approximately xx% by 2033.
Dominant Regions, Countries, or Segments in US Turf and Ornamental Protection Market
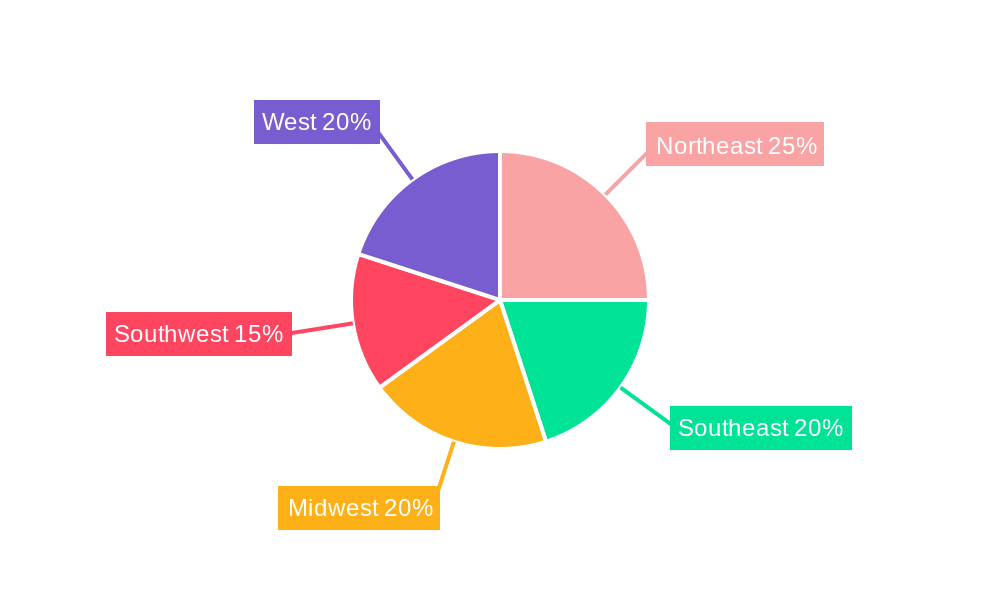
The Northeast and West Coast regions dominate the US Turf and Ornamental Protection market due to higher population density, favorable climatic conditions for landscaping, and established turf and ornamental industries. Within application modes, foliar application maintains its leading position, owing to its convenience and effectiveness across various crop types. The Fungicide segment is the largest, driven by the prevalence of fungal diseases affecting turfgrass and ornamental plants.
- Key Regional Drivers: Higher population density in the Northeast and West Coast, conducive climate, and strong horticultural industries drive regional dominance.
- Leading Application Mode: Foliar application holds the largest market share due to ease of use and broad applicability.
- Largest Functional Segment: Fungicides capture the largest market share due to the wide range of fungal diseases affecting turf and ornamentals.
- Market Share Distribution (2025): Northeast: xx%; West Coast: xx%; Other Regions: xx%; Foliar Application: xx%; Fungicide Segment: xx%.
US Turf and Ornamental Protection Market Product Landscape
The US Turf and Ornamental Protection market offers a diverse range of products tailored to specific pest and disease management needs. Recent innovations focus on enhancing efficacy, reducing environmental impact, and improving ease of application. These include targeted formulations, biological control agents, and advanced application technologies like drone-based spraying. Unique selling propositions often revolve around improved efficacy, reduced application rates, and minimized environmental impact. Key technological advancements include the development of biopesticides, slow-release formulations, and intelligent application systems.
Key Drivers, Barriers & Challenges in US Turf and Ornamental Protection Market
Key Drivers: Increasing urbanization, rising disposable incomes fueling demand for landscaping services, growing awareness of pest and disease management, and technological advancements leading to improved efficacy and reduced environmental impact of products.
Key Challenges & Restraints: Stringent environmental regulations increasing development costs, growing consumer preference for environmentally friendly options putting pressure on manufacturers, and potential supply chain disruptions impacting the availability and cost of active ingredients.
Emerging Opportunities in US Turf and Ornamental Protection Market
Emerging opportunities lie in the development and adoption of biopesticides, precision application technologies, and integrated pest management (IPM) strategies. Untapped markets include organic and sustainable landscaping segments. Evolving consumer preferences are driving demand for eco-friendly products, creating significant opportunities for manufacturers who can effectively cater to this demand.
Growth Accelerators in the US Turf and Ornamental Protection Market Industry
The long-term growth of the US Turf and Ornamental Protection market is fueled by several factors. Technological breakthroughs in product formulation and application methods, strategic partnerships between chemical companies and biotech firms to develop novel solutions, and market expansion strategies targeting niche segments like organic landscaping are creating significant opportunities.
Key Players Shaping the US Turf and Ornamental Protection Market Market
Notable Milestones in US Turf and Ornamental Protection Market Sector
- April 2023: Nufarm launched Tourney EZ, a new liquid formulation fungicide for turf and ornamental crops, strengthening its market position.
- November 2022: Lier Chemical Company Ltd and Nufarm Ltd Americas Inc. partnered to supply glufosinate to the T&O industry.
- March 2022: UPL Environmental Solutions expanded its fumigation product line with the QuickPHlo-R phosphine generator.
In-Depth US Turf and Ornamental Protection Market Market Outlook
The US Turf and Ornamental Protection market is poised for continued growth, driven by innovation in product formulation and application methods. Strategic partnerships, market expansion into niche segments, and the increasing adoption of sustainable practices will shape the future of the industry. Companies that can effectively adapt to evolving regulatory landscapes and consumer preferences are best positioned to capitalize on the significant opportunities within this dynamic market.
US Turf and Ornamental Protection Market Segmentation
- 1. Production Analysis
- 2. Consumption Analysis
- 3. Import Market Analysis (Value & Volume)
- 4. Export Market Analysis (Value & Volume)
- 5. Price Trend Analysis
US Turf and Ornamental Protection Market Segmentation By Geography
-
1. North America
- 1.1. United States
- 1.2. Canada
- 1.3. Mexico
-
2. South America
- 2.1. Brazil
- 2.2. Argentina
- 2.3. Rest of South America
-
3. Europe
- 3.1. United Kingdom
- 3.2. Germany
- 3.3. France
- 3.4. Italy
- 3.5. Spain
- 3.6. Russia
- 3.7. Benelux
- 3.8. Nordics
- 3.9. Rest of Europe
-
4. Middle East & Africa
- 4.1. Turkey
- 4.2. Israel
- 4.3. GCC
- 4.4. North Africa
- 4.5. South Africa
- 4.6. Rest of Middle East & Africa
-
5. Asia Pacific
- 5.1. China
- 5.2. India
- 5.3. Japan
- 5.4. South Korea
- 5.5. ASEAN
- 5.6. Oceania
- 5.7. Rest of Asia Pacific
US Turf and Ornamental Protection Market Regional Market Share
Geographic Coverage of US Turf and Ornamental Protection Market
US Turf and Ornamental Protection Market REPORT HIGHLIGHTS
| Aspects | Details |
|---|---|
| Study Period | 2020-2034 |
| Base Year | 2025 |
| Estimated Year | 2026 |
| Forecast Period | 2026-2034 |
| Historical Period | 2020-2025 |
| Growth Rate | CAGR of 3.1% from 2020-2034 |
| Segmentation |
|
Table of Contents
- 1. Introduction
- 1.1. Research Scope
- 1.2. Market Segmentation
- 1.3. Research Objective
- 1.4. Definitions and Assumptions
- 2. Executive Summary
- 2.1. Market Snapshot
- 3. Market Dynamics
- 3.1. Market Drivers
- 3.2. Market Restrains
- 3.3. Market Trends
- 3.4. Market Opportunities
- 4. Market Factor Analysis
- 4.1. Porters Five Forces
- 4.1.1. Bargaining Power of Suppliers
- 4.1.2. Bargaining Power of Buyers
- 4.1.3. Threat of New Entrants
- 4.1.4. Threat of Substitutes
- 4.1.5. Competitive Rivalry
- 4.2. PESTEL analysis
- 4.3. BCG Analysis
- 4.3.1. Stars (High Growth, High Market Share)
- 4.3.2. Cash Cows (Low Growth, High Market Share)
- 4.3.3. Question Mark (High Growth, Low Market Share)
- 4.3.4. Dogs (Low Growth, Low Market Share)
- 4.4. Ansoff Matrix Analysis
- 4.5. Supply Chain Analysis
- 4.6. Regulatory Landscape
- 4.7. Current Market Potential and Opportunity Assessment (TAM–SAM–SOM Framework)
- 4.8. VDR Analyst Note
- 4.1. Porters Five Forces
- 5. Market Analysis, Insights and Forecast 2021-2033
- 5.1. Market Analysis, Insights and Forecast - by Production Analysis
- 5.2. Market Analysis, Insights and Forecast - by Consumption Analysis
- 5.3. Market Analysis, Insights and Forecast - by Import Market Analysis (Value & Volume)
- 5.4. Market Analysis, Insights and Forecast - by Export Market Analysis (Value & Volume)
- 5.5. Market Analysis, Insights and Forecast - by Price Trend Analysis
- 5.6. Market Analysis, Insights and Forecast - by Region
- 5.6.1. North America
- 5.6.2. South America
- 5.6.3. Europe
- 5.6.4. Middle East & Africa
- 5.6.5. Asia Pacific
- 6. Global US Turf and Ornamental Protection Market Analysis, Insights and Forecast, 2021-2033
- 6.1. Market Analysis, Insights and Forecast - by Production Analysis
- 6.2. Market Analysis, Insights and Forecast - by Consumption Analysis
- 6.3. Market Analysis, Insights and Forecast - by Import Market Analysis (Value & Volume)
- 6.4. Market Analysis, Insights and Forecast - by Export Market Analysis (Value & Volume)
- 6.5. Market Analysis, Insights and Forecast - by Price Trend Analysis
- 7. North America US Turf and Ornamental Protection Market Analysis, Insights and Forecast, 2021-2033
- 7.1. Market Analysis, Insights and Forecast - by Production Analysis
- 7.2. Market Analysis, Insights and Forecast - by Consumption Analysis
- 7.3. Market Analysis, Insights and Forecast - by Import Market Analysis (Value & Volume)
- 7.4. Market Analysis, Insights and Forecast - by Export Market Analysis (Value & Volume)
- 7.5. Market Analysis, Insights and Forecast - by Price Trend Analysis
- 8. South America US Turf and Ornamental Protection Market Analysis, Insights and Forecast, 2021-2033
- 8.1. Market Analysis, Insights and Forecast - by Production Analysis
- 8.2. Market Analysis, Insights and Forecast - by Consumption Analysis
- 8.3. Market Analysis, Insights and Forecast - by Import Market Analysis (Value & Volume)
- 8.4. Market Analysis, Insights and Forecast - by Export Market Analysis (Value & Volume)
- 8.5. Market Analysis, Insights and Forecast - by Price Trend Analysis
- 9. Europe US Turf and Ornamental Protection Market Analysis, Insights and Forecast, 2021-2033
- 9.1. Market Analysis, Insights and Forecast - by Production Analysis
- 9.2. Market Analysis, Insights and Forecast - by Consumption Analysis
- 9.3. Market Analysis, Insights and Forecast - by Import Market Analysis (Value & Volume)
- 9.4. Market Analysis, Insights and Forecast - by Export Market Analysis (Value & Volume)
- 9.5. Market Analysis, Insights and Forecast - by Price Trend Analysis
- 10. Middle East & Africa US Turf and Ornamental Protection Market Analysis, Insights and Forecast, 2021-2033
- 10.1. Market Analysis, Insights and Forecast - by Production Analysis
- 10.2. Market Analysis, Insights and Forecast - by Consumption Analysis
- 10.3. Market Analysis, Insights and Forecast - by Import Market Analysis (Value & Volume)
- 10.4. Market Analysis, Insights and Forecast - by Export Market Analysis (Value & Volume)
- 10.5. Market Analysis, Insights and Forecast - by Price Trend Analysis
- 11. Asia Pacific US Turf and Ornamental Protection Market Analysis, Insights and Forecast, 2021-2033
- 11.1. Market Analysis, Insights and Forecast - by Production Analysis
- 11.2. Market Analysis, Insights and Forecast - by Consumption Analysis
- 11.3. Market Analysis, Insights and Forecast - by Import Market Analysis (Value & Volume)
- 11.4. Market Analysis, Insights and Forecast - by Export Market Analysis (Value & Volume)
- 11.5. Market Analysis, Insights and Forecast - by Price Trend Analysis
- 12. Competitive Analysis
- 12.1. Company Profiles
- 12.1.1 American Vanguard Corporation
- 12.1.1.1. Company Overview
- 12.1.1.2. Products
- 12.1.1.3. Company Financials
- 12.1.1.4. SWOT Analysis
- 12.1.2 Gowan Company
- 12.1.2.1. Company Overview
- 12.1.2.2. Products
- 12.1.2.3. Company Financials
- 12.1.2.4. SWOT Analysis
- 12.1.3 Syngenta Group
- 12.1.3.1. Company Overview
- 12.1.3.2. Products
- 12.1.3.3. Company Financials
- 12.1.3.4. SWOT Analysis
- 12.1.4 Environmental Science US LLC (Envu)
- 12.1.4.1. Company Overview
- 12.1.4.2. Products
- 12.1.4.3. Company Financials
- 12.1.4.4. SWOT Analysis
- 12.1.5 BASF SE
- 12.1.5.1. Company Overview
- 12.1.5.2. Products
- 12.1.5.3. Company Financials
- 12.1.5.4. SWOT Analysis
- 12.1.6 FMC Corporation
- 12.1.6.1. Company Overview
- 12.1.6.2. Products
- 12.1.6.3. Company Financials
- 12.1.6.4. SWOT Analysis
- 12.1.7 UPL Limite
- 12.1.7.1. Company Overview
- 12.1.7.2. Products
- 12.1.7.3. Company Financials
- 12.1.7.4. SWOT Analysis
- 12.1.8 Mitsui & Co Ltd (Certis Belchim)
- 12.1.8.1. Company Overview
- 12.1.8.2. Products
- 12.1.8.3. Company Financials
- 12.1.8.4. SWOT Analysis
- 12.1.9 Corteva Agriscience
- 12.1.9.1. Company Overview
- 12.1.9.2. Products
- 12.1.9.3. Company Financials
- 12.1.9.4. SWOT Analysis
- 12.1.10 Nufarm Ltd
- 12.1.10.1. Company Overview
- 12.1.10.2. Products
- 12.1.10.3. Company Financials
- 12.1.10.4. SWOT Analysis
- 12.1.1 American Vanguard Corporation
- 12.2. Market Entropy
- 12.2.1 Company's Key Areas Served
- 12.2.2 Recent Developments
- 12.3. Company Market Share Analysis 2025
- 12.3.1 Top 5 Companies Market Share Analysis
- 12.3.2 Top 3 Companies Market Share Analysis
- 12.4. List of Potential Customers
- 13. Research Methodology
List of Figures
- Figure 1: Global US Turf and Ornamental Protection Market Revenue Breakdown (billion, %) by Region 2025 & 2033
- Figure 2: North America US Turf and Ornamental Protection Market Revenue (billion), by Production Analysis 2025 & 2033
- Figure 3: North America US Turf and Ornamental Protection Market Revenue Share (%), by Production Analysis 2025 & 2033
- Figure 4: North America US Turf and Ornamental Protection Market Revenue (billion), by Consumption Analysis 2025 & 2033
- Figure 5: North America US Turf and Ornamental Protection Market Revenue Share (%), by Consumption Analysis 2025 & 2033
- Figure 6: North America US Turf and Ornamental Protection Market Revenue (billion), by Import Market Analysis (Value & Volume) 2025 & 2033
- Figure 7: North America US Turf and Ornamental Protection Market Revenue Share (%), by Import Market Analysis (Value & Volume) 2025 & 2033
- Figure 8: North America US Turf and Ornamental Protection Market Revenue (billion), by Export Market Analysis (Value & Volume) 2025 & 2033
- Figure 9: North America US Turf and Ornamental Protection Market Revenue Share (%), by Export Market Analysis (Value & Volume) 2025 & 2033
- Figure 10: North America US Turf and Ornamental Protection Market Revenue (billion), by Price Trend Analysis 2025 & 2033
- Figure 11: North America US Turf and Ornamental Protection Market Revenue Share (%), by Price Trend Analysis 2025 & 2033
- Figure 12: North America US Turf and Ornamental Protection Market Revenue (billion), by Country 2025 & 2033
- Figure 13: North America US Turf and Ornamental Protection Market Revenue Share (%), by Country 2025 & 2033
- Figure 14: South America US Turf and Ornamental Protection Market Revenue (billion), by Production Analysis 2025 & 2033
- Figure 15: South America US Turf and Ornamental Protection Market Revenue Share (%), by Production Analysis 2025 & 2033
- Figure 16: South America US Turf and Ornamental Protection Market Revenue (billion), by Consumption Analysis 2025 & 2033
- Figure 17: South America US Turf and Ornamental Protection Market Revenue Share (%), by Consumption Analysis 2025 & 2033
- Figure 18: South America US Turf and Ornamental Protection Market Revenue (billion), by Import Market Analysis (Value & Volume) 2025 & 2033
- Figure 19: South America US Turf and Ornamental Protection Market Revenue Share (%), by Import Market Analysis (Value & Volume) 2025 & 2033
- Figure 20: South America US Turf and Ornamental Protection Market Revenue (billion), by Export Market Analysis (Value & Volume) 2025 & 2033
- Figure 21: South America US Turf and Ornamental Protection Market Revenue Share (%), by Export Market Analysis (Value & Volume) 2025 & 2033
- Figure 22: South America US Turf and Ornamental Protection Market Revenue (billion), by Price Trend Analysis 2025 & 2033
- Figure 23: South America US Turf and Ornamental Protection Market Revenue Share (%), by Price Trend Analysis 2025 & 2033
- Figure 24: South America US Turf and Ornamental Protection Market Revenue (billion), by Country 2025 & 2033
- Figure 25: South America US Turf and Ornamental Protection Market Revenue Share (%), by Country 2025 & 2033
- Figure 26: Europe US Turf and Ornamental Protection Market Revenue (billion), by Production Analysis 2025 & 2033
- Figure 27: Europe US Turf and Ornamental Protection Market Revenue Share (%), by Production Analysis 2025 & 2033
- Figure 28: Europe US Turf and Ornamental Protection Market Revenue (billion), by Consumption Analysis 2025 & 2033
- Figure 29: Europe US Turf and Ornamental Protection Market Revenue Share (%), by Consumption Analysis 2025 & 2033
- Figure 30: Europe US Turf and Ornamental Protection Market Revenue (billion), by Import Market Analysis (Value & Volume) 2025 & 2033
- Figure 31: Europe US Turf and Ornamental Protection Market Revenue Share (%), by Import Market Analysis (Value & Volume) 2025 & 2033
- Figure 32: Europe US Turf and Ornamental Protection Market Revenue (billion), by Export Market Analysis (Value & Volume) 2025 & 2033
- Figure 33: Europe US Turf and Ornamental Protection Market Revenue Share (%), by Export Market Analysis (Value & Volume) 2025 & 2033
- Figure 34: Europe US Turf and Ornamental Protection Market Revenue (billion), by Price Trend Analysis 2025 & 2033
- Figure 35: Europe US Turf and Ornamental Protection Market Revenue Share (%), by Price Trend Analysis 2025 & 2033
- Figure 36: Europe US Turf and Ornamental Protection Market Revenue (billion), by Country 2025 & 2033
- Figure 37: Europe US Turf and Ornamental Protection Market Revenue Share (%), by Country 2025 & 2033
- Figure 38: Middle East & Africa US Turf and Ornamental Protection Market Revenue (billion), by Production Analysis 2025 & 2033
- Figure 39: Middle East & Africa US Turf and Ornamental Protection Market Revenue Share (%), by Production Analysis 2025 & 2033
- Figure 40: Middle East & Africa US Turf and Ornamental Protection Market Revenue (billion), by Consumption Analysis 2025 & 2033
- Figure 41: Middle East & Africa US Turf and Ornamental Protection Market Revenue Share (%), by Consumption Analysis 2025 & 2033
- Figure 42: Middle East & Africa US Turf and Ornamental Protection Market Revenue (billion), by Import Market Analysis (Value & Volume) 2025 & 2033
- Figure 43: Middle East & Africa US Turf and Ornamental Protection Market Revenue Share (%), by Import Market Analysis (Value & Volume) 2025 & 2033
- Figure 44: Middle East & Africa US Turf and Ornamental Protection Market Revenue (billion), by Export Market Analysis (Value & Volume) 2025 & 2033
- Figure 45: Middle East & Africa US Turf and Ornamental Protection Market Revenue Share (%), by Export Market Analysis (Value & Volume) 2025 & 2033
- Figure 46: Middle East & Africa US Turf and Ornamental Protection Market Revenue (billion), by Price Trend Analysis 2025 & 2033
- Figure 47: Middle East & Africa US Turf and Ornamental Protection Market Revenue Share (%), by Price Trend Analysis 2025 & 2033
- Figure 48: Middle East & Africa US Turf and Ornamental Protection Market Revenue (billion), by Country 2025 & 2033
- Figure 49: Middle East & Africa US Turf and Ornamental Protection Market Revenue Share (%), by Country 2025 & 2033
- Figure 50: Asia Pacific US Turf and Ornamental Protection Market Revenue (billion), by Production Analysis 2025 & 2033
- Figure 51: Asia Pacific US Turf and Ornamental Protection Market Revenue Share (%), by Production Analysis 2025 & 2033
- Figure 52: Asia Pacific US Turf and Ornamental Protection Market Revenue (billion), by Consumption Analysis 2025 & 2033
- Figure 53: Asia Pacific US Turf and Ornamental Protection Market Revenue Share (%), by Consumption Analysis 2025 & 2033
- Figure 54: Asia Pacific US Turf and Ornamental Protection Market Revenue (billion), by Import Market Analysis (Value & Volume) 2025 & 2033
- Figure 55: Asia Pacific US Turf and Ornamental Protection Market Revenue Share (%), by Import Market Analysis (Value & Volume) 2025 & 2033
- Figure 56: Asia Pacific US Turf and Ornamental Protection Market Revenue (billion), by Export Market Analysis (Value & Volume) 2025 & 2033
- Figure 57: Asia Pacific US Turf and Ornamental Protection Market Revenue Share (%), by Export Market Analysis (Value & Volume) 2025 & 2033
- Figure 58: Asia Pacific US Turf and Ornamental Protection Market Revenue (billion), by Price Trend Analysis 2025 & 2033
- Figure 59: Asia Pacific US Turf and Ornamental Protection Market Revenue Share (%), by Price Trend Analysis 2025 & 2033
- Figure 60: Asia Pacific US Turf and Ornamental Protection Market Revenue (billion), by Country 2025 & 2033
- Figure 61: Asia Pacific US Turf and Ornamental Protection Market Revenue Share (%), by Country 2025 & 2033
List of Tables
- Table 1: Global US Turf and Ornamental Protection Market Revenue billion Forecast, by Production Analysis 2020 & 2033
- Table 2: Global US Turf and Ornamental Protection Market Revenue billion Forecast, by Consumption Analysis 2020 & 2033
- Table 3: Global US Turf and Ornamental Protection Market Revenue billion Forecast, by Import Market Analysis (Value & Volume) 2020 & 2033
- Table 4: Global US Turf and Ornamental Protection Market Revenue billion Forecast, by Export Market Analysis (Value & Volume) 2020 & 2033
- Table 5: Global US Turf and Ornamental Protection Market Revenue billion Forecast, by Price Trend Analysis 2020 & 2033
- Table 6: Global US Turf and Ornamental Protection Market Revenue billion Forecast, by Region 2020 & 2033
- Table 7: Global US Turf and Ornamental Protection Market Revenue billion Forecast, by Production Analysis 2020 & 2033
- Table 8: Global US Turf and Ornamental Protection Market Revenue billion Forecast, by Consumption Analysis 2020 & 2033
- Table 9: Global US Turf and Ornamental Protection Market Revenue billion Forecast, by Import Market Analysis (Value & Volume) 2020 & 2033
- Table 10: Global US Turf and Ornamental Protection Market Revenue billion Forecast, by Export Market Analysis (Value & Volume) 2020 & 2033
- Table 11: Global US Turf and Ornamental Protection Market Revenue billion Forecast, by Price Trend Analysis 2020 & 2033
- Table 12: Global US Turf and Ornamental Protection Market Revenue billion Forecast, by Country 2020 & 2033
- Table 13: United States US Turf and Ornamental Protection Market Revenue (billion) Forecast, by Application 2020 & 2033
- Table 14: Canada US Turf and Ornamental Protection Market Revenue (billion) Forecast, by Application 2020 & 2033
- Table 15: Mexico US Turf and Ornamental Protection Market Revenue (billion) Forecast, by Application 2020 & 2033
- Table 16: Global US Turf and Ornamental Protection Market Revenue billion Forecast, by Production Analysis 2020 & 2033
- Table 17: Global US Turf and Ornamental Protection Market Revenue billion Forecast, by Consumption Analysis 2020 & 2033
- Table 18: Global US Turf and Ornamental Protection Market Revenue billion Forecast, by Import Market Analysis (Value & Volume) 2020 & 2033
- Table 19: Global US Turf and Ornamental Protection Market Revenue billion Forecast, by Export Market Analysis (Value & Volume) 2020 & 2033
- Table 20: Global US Turf and Ornamental Protection Market Revenue billion Forecast, by Price Trend Analysis 2020 & 2033
- Table 21: Global US Turf and Ornamental Protection Market Revenue billion Forecast, by Country 2020 & 2033
- Table 22: Brazil US Turf and Ornamental Protection Market Revenue (billion) Forecast, by Application 2020 & 2033
- Table 23: Argentina US Turf and Ornamental Protection Market Revenue (billion) Forecast, by Application 2020 & 2033
- Table 24: Rest of South America US Turf and Ornamental Protection Market Revenue (billion) Forecast, by Application 2020 & 2033
- Table 25: Global US Turf and Ornamental Protection Market Revenue billion Forecast, by Production Analysis 2020 & 2033
- Table 26: Global US Turf and Ornamental Protection Market Revenue billion Forecast, by Consumption Analysis 2020 & 2033
- Table 27: Global US Turf and Ornamental Protection Market Revenue billion Forecast, by Import Market Analysis (Value & Volume) 2020 & 2033
- Table 28: Global US Turf and Ornamental Protection Market Revenue billion Forecast, by Export Market Analysis (Value & Volume) 2020 & 2033
- Table 29: Global US Turf and Ornamental Protection Market Revenue billion Forecast, by Price Trend Analysis 2020 & 2033
- Table 30: Global US Turf and Ornamental Protection Market Revenue billion Forecast, by Country 2020 & 2033
- Table 31: United Kingdom US Turf and Ornamental Protection Market Revenue (billion) Forecast, by Application 2020 & 2033
- Table 32: Germany US Turf and Ornamental Protection Market Revenue (billion) Forecast, by Application 2020 & 2033
- Table 33: France US Turf and Ornamental Protection Market Revenue (billion) Forecast, by Application 2020 & 2033
- Table 34: Italy US Turf and Ornamental Protection Market Revenue (billion) Forecast, by Application 2020 & 2033
- Table 35: Spain US Turf and Ornamental Protection Market Revenue (billion) Forecast, by Application 2020 & 2033
- Table 36: Russia US Turf and Ornamental Protection Market Revenue (billion) Forecast, by Application 2020 & 2033
- Table 37: Benelux US Turf and Ornamental Protection Market Revenue (billion) Forecast, by Application 2020 & 2033
- Table 38: Nordics US Turf and Ornamental Protection Market Revenue (billion) Forecast, by Application 2020 & 2033
- Table 39: Rest of Europe US Turf and Ornamental Protection Market Revenue (billion) Forecast, by Application 2020 & 2033
- Table 40: Global US Turf and Ornamental Protection Market Revenue billion Forecast, by Production Analysis 2020 & 2033
- Table 41: Global US Turf and Ornamental Protection Market Revenue billion Forecast, by Consumption Analysis 2020 & 2033
- Table 42: Global US Turf and Ornamental Protection Market Revenue billion Forecast, by Import Market Analysis (Value & Volume) 2020 & 2033
- Table 43: Global US Turf and Ornamental Protection Market Revenue billion Forecast, by Export Market Analysis (Value & Volume) 2020 & 2033
- Table 44: Global US Turf and Ornamental Protection Market Revenue billion Forecast, by Price Trend Analysis 2020 & 2033
- Table 45: Global US Turf and Ornamental Protection Market Revenue billion Forecast, by Country 2020 & 2033
- Table 46: Turkey US Turf and Ornamental Protection Market Revenue (billion) Forecast, by Application 2020 & 2033
- Table 47: Israel US Turf and Ornamental Protection Market Revenue (billion) Forecast, by Application 2020 & 2033
- Table 48: GCC US Turf and Ornamental Protection Market Revenue (billion) Forecast, by Application 2020 & 2033
- Table 49: North Africa US Turf and Ornamental Protection Market Revenue (billion) Forecast, by Application 2020 & 2033
- Table 50: South Africa US Turf and Ornamental Protection Market Revenue (billion) Forecast, by Application 2020 & 2033
- Table 51: Rest of Middle East & Africa US Turf and Ornamental Protection Market Revenue (billion) Forecast, by Application 2020 & 2033
- Table 52: Global US Turf and Ornamental Protection Market Revenue billion Forecast, by Production Analysis 2020 & 2033
- Table 53: Global US Turf and Ornamental Protection Market Revenue billion Forecast, by Consumption Analysis 2020 & 2033
- Table 54: Global US Turf and Ornamental Protection Market Revenue billion Forecast, by Import Market Analysis (Value & Volume) 2020 & 2033
- Table 55: Global US Turf and Ornamental Protection Market Revenue billion Forecast, by Export Market Analysis (Value & Volume) 2020 & 2033
- Table 56: Global US Turf and Ornamental Protection Market Revenue billion Forecast, by Price Trend Analysis 2020 & 2033
- Table 57: Global US Turf and Ornamental Protection Market Revenue billion Forecast, by Country 2020 & 2033
- Table 58: China US Turf and Ornamental Protection Market Revenue (billion) Forecast, by Application 2020 & 2033
- Table 59: India US Turf and Ornamental Protection Market Revenue (billion) Forecast, by Application 2020 & 2033
- Table 60: Japan US Turf and Ornamental Protection Market Revenue (billion) Forecast, by Application 2020 & 2033
- Table 61: South Korea US Turf and Ornamental Protection Market Revenue (billion) Forecast, by Application 2020 & 2033
- Table 62: ASEAN US Turf and Ornamental Protection Market Revenue (billion) Forecast, by Application 2020 & 2033
- Table 63: Oceania US Turf and Ornamental Protection Market Revenue (billion) Forecast, by Application 2020 & 2033
- Table 64: Rest of Asia Pacific US Turf and Ornamental Protection Market Revenue (billion) Forecast, by Application 2020 & 2033
Frequently Asked Questions
1. What is the projected Compound Annual Growth Rate (CAGR) of the US Turf and Ornamental Protection Market?
The projected CAGR is approximately 3.1%.
2. Which companies are prominent players in the US Turf and Ornamental Protection Market?
Key companies in the market include American Vanguard Corporation, Gowan Company, Syngenta Group, Environmental Science US LLC (Envu), BASF SE, FMC Corporation, UPL Limite, Mitsui & Co Ltd (Certis Belchim), Corteva Agriscience, Nufarm Ltd.
3. What are the main segments of the US Turf and Ornamental Protection Market?
The market segments include Production Analysis, Consumption Analysis, Import Market Analysis (Value & Volume), Export Market Analysis (Value & Volume), Price Trend Analysis.
4. Can you provide details about the market size?
The market size is estimated to be USD 4.91 billion as of 2022.
5. What are some drivers contributing to market growth?
Seed Treatment As A Solution To Enhance Yield; Growing Awareness For Seed Treatment Among The Farmers; Rising Trend Of Organic Farming.
6. What are the notable trends driving market growth?
An increase in the number of floriculture producers drives the usage of crop protection chemicals.
7. Are there any restraints impacting market growth?
Limitations Across Farm-Level Seed Treatment; Rising Environmental Concerns.
8. Can you provide examples of recent developments in the market?
April 2023: Nufarm launched a new liquid formulation fungicide, Tourney EZ, exclusively for turf and ornamental crops based on customer demand, which further strengthens the company's role in turf and ornamental crop protection.November 2022: Lier Chemical Company Ltd and Nufarm Ltd Americas Inc. established a partnership to deliver glufosinate to the turf and ornamental (T&O) industry.March 2022: With the QuickPHlo-R (QPR) phosphine generator, which uses a special granular formulation in an enclosed application system, UPL Environmental Solutions expanded its fumigation product line.
9. What pricing options are available for accessing the report?
Pricing options include single-user, multi-user, and enterprise licenses priced at USD 3800, USD 4500, and USD 5800 respectively.
10. Is the market size provided in terms of value or volume?
The market size is provided in terms of value, measured in billion.
11. Are there any specific market keywords associated with the report?
Yes, the market keyword associated with the report is "US Turf and Ornamental Protection Market," which aids in identifying and referencing the specific market segment covered.
12. How do I determine which pricing option suits my needs best?
The pricing options vary based on user requirements and access needs. Individual users may opt for single-user licenses, while businesses requiring broader access may choose multi-user or enterprise licenses for cost-effective access to the report.
13. Are there any additional resources or data provided in the US Turf and Ornamental Protection Market report?
While the report offers comprehensive insights, it's advisable to review the specific contents or supplementary materials provided to ascertain if additional resources or data are available.
14. How can I stay updated on further developments or reports in the US Turf and Ornamental Protection Market?
To stay informed about further developments, trends, and reports in the US Turf and Ornamental Protection Market, consider subscribing to industry newsletters, following relevant companies and organizations, or regularly checking reputable industry news sources and publications.
Methodology
Step 1 - Identification of Relevant Samples Size from Population Database


Step 2 - Approaches for Defining Global Market Size (Value, Volume* & Price*)

Note*: In applicable scenarios
Step 3 - Data Sources
Primary Research
- Web Analytics
- Survey Reports
- Research Institute
- Latest Research Reports
- Opinion Leaders
Secondary Research
- Annual Reports
- White Paper
- Latest Press Release
- Industry Association
- Paid Database
- Investor Presentations

Step 4 - Data Triangulation
Involves using different sources of information in order to increase the validity of a study
These sources are likely to be stakeholders in a program - participants, other researchers, program staff, other community members, and so on.
Then we put all data in single framework & apply various statistical tools to find out the dynamic on the market.
During the analysis stage, feedback from the stakeholder groups would be compared to determine areas of agreement as well as areas of divergence