
Key Insights
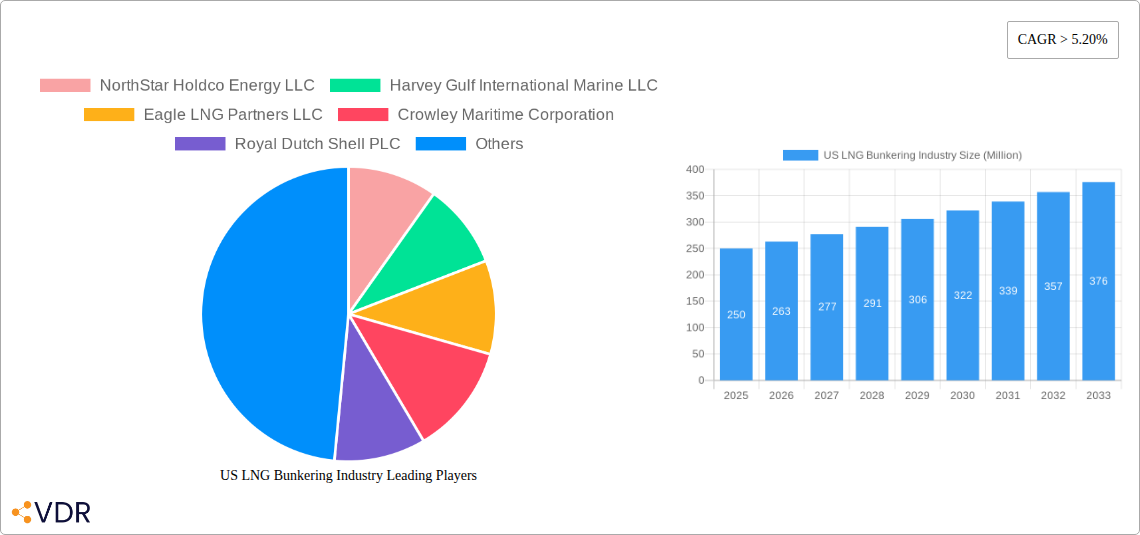
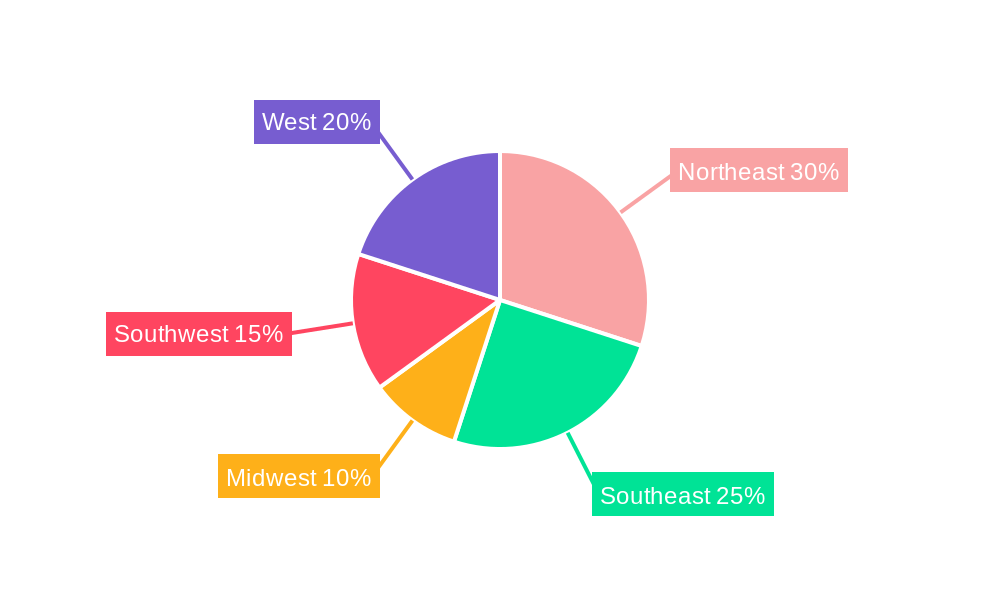
The US LNG bunkering market is experiencing robust growth, driven by increasing environmental regulations aimed at reducing greenhouse gas emissions from maritime transport and a rising demand for cleaner marine fuels. The market's Compound Annual Growth Rate (CAGR) exceeding 5.20% from 2019-2033 indicates significant expansion, fueled by the transition towards liquefied natural gas (LNG) as a preferred alternative to traditional heavy fuel oil. Key market segments include tanker fleets, container fleets, bulk and general cargo fleets, ferries and offshore support vessels (OSVs), with tanker fleets currently dominating due to their higher LNG consumption needs. The expansion is geographically concentrated across various US regions, with the Northeast, Southeast, and West Coast likely experiencing the most substantial growth given existing port infrastructure and proximity to LNG import terminals. Major players like NorthStar Holdco Energy LLC, Harvey Gulf International Marine LLC, and Crowley Maritime Corporation are actively shaping the market landscape through strategic investments in LNG bunkering infrastructure and services.
The continued growth of the US LNG bunkering market hinges on several factors. Further expansion of LNG import terminals and the development of a robust LNG bunkering infrastructure are critical for widespread adoption. Government incentives and supportive policies aimed at accelerating the transition to cleaner fuels will play a pivotal role. However, challenges remain, including the relatively higher initial investment costs associated with LNG bunkering compared to traditional fuels and the need for skilled workforce to operate and maintain LNG bunkering infrastructure. The competition among existing and emerging players will further shape the market dynamics in the coming years, leading to strategic partnerships and potentially consolidation within the sector. The forecast period of 2025-2033 presents a significant opportunity for growth, and the market size is projected to continue expanding based on the current trajectory of environmental regulations and market demand.
US LNG Bunkering Industry Market Report: 2019-2033
This comprehensive report provides an in-depth analysis of the US LNG bunkering industry, covering market dynamics, growth trends, key players, and future outlook. The study period spans from 2019 to 2033, with 2025 serving as the base and estimated year. The report offers valuable insights for industry professionals, investors, and stakeholders seeking to understand and capitalize on opportunities within this rapidly evolving market. This report focuses on the parent market of maritime fuel and the child market of LNG bunkering.
US LNG Bunkering Industry Market Dynamics & Structure
This section analyzes the competitive landscape of the US LNG bunkering industry, exploring market concentration, technological advancements, regulatory influences, and competitive dynamics. The analysis covers the period from 2019 to 2033, incorporating historical data, current market conditions, and future projections.
Market Concentration: The US LNG bunkering market exhibits a moderately concentrated structure with a few major players holding significant market share, estimated at xx% in 2025. However, increased participation from smaller players is expected in the forecast period.
Technological Innovation: Advancements in LNG storage and handling technologies, such as improved cryogenic tank designs and bunkering systems, are driving market growth. However, high initial investment costs pose a barrier to widespread adoption.
Regulatory Framework: Stringent environmental regulations aimed at reducing greenhouse gas emissions from ships are creating a positive impetus for LNG bunkering adoption. However, inconsistencies across regulatory frameworks across different ports present challenges.
Competitive Product Substitutes: Traditional marine fuels like heavy fuel oil (HFO) and marine diesel oil (MDO) remain significant competitors. However, their environmental impact and increasing price volatility are making LNG a more attractive alternative.
End-User Demographics: The demand for LNG bunkering is primarily driven by the tanker fleet, container fleet, and bulk and general cargo fleet segments. The shift towards LNG is influenced by stringent emission regulations and sustainability goals of shipping companies.
M&A Trends: The period 2019-2024 witnessed xx M&A deals, primarily focused on strengthening supply chains and expanding geographical reach. The projected deal volume for 2025-2033 is estimated at xx, driven by strategic alliances and investments in bunkering infrastructure.
US LNG Bunkering Industry Growth Trends & Insights
This section offers a comprehensive analysis of the US LNG bunkering market's growth trajectory, encompassing market size evolution, adoption rates, technological disruptions, and shifts in consumer behavior. Leveraging extensive market research data, the report identifies key growth drivers and challenges, providing in-depth insights to support informed decision-making. The CAGR for the US LNG bunkering market during 2025-2033 is projected to be xx%. Market penetration is estimated to reach xx% by 2033. The detailed analysis addresses the influence of factors such as technological advancements, rising environmental concerns, favorable government policies, and evolving consumer preferences.

Dominant Regions, Countries, or Segments in US LNG Bunkering Industry
This section identifies the leading regions, countries, and segments within the US LNG bunkering market driving growth. Detailed analysis and specific metrics showcase the dominance factors, including market share and growth potential.
Leading Segment: The Tanker Fleet segment is currently the dominant end-user of LNG bunkering services, accounting for an estimated xx% of the market in 2025. This dominance is largely attributable to the stringent environmental regulations impacting the sector and the inherent suitability of LNG as a fuel for large vessels.
Key Drivers:
- Stringent Emission Regulations: The implementation of stricter sulfur emission limits (e.g., IMO 2020) is significantly accelerating the adoption of LNG as a cleaner alternative.
- Port Infrastructure Development: Investments in LNG bunkering infrastructure at major ports are further bolstering market growth.
- Government Incentives: Various government incentives and subsidies aimed at promoting the adoption of cleaner fuels are positively impacting market dynamics.
US LNG Bunkering Industry Product Landscape
The US LNG bunkering market features a range of products designed to meet the diverse needs of end-users, including cryogenic LNG carriers, bunkering barges and vessels. These innovations focus on improving efficiency, safety, and environmental performance, such as reduced boil-off gas rates and improved transfer speeds. Ongoing technological advancements center around automation, remote monitoring, and data analytics to optimize operations.
Key Drivers, Barriers & Challenges in US LNG Bunkering Industry
Key Drivers: The primary drivers of growth in the US LNG bunkering industry include increasingly stringent environmental regulations (e.g., IMO 2020 and future emissions targets), the growing availability of LNG as a fuel source, and ongoing investment in LNG bunkering infrastructure. Government incentives and supportive policies also play a significant role.
Key Barriers and Challenges: High upfront capital costs associated with LNG infrastructure development, the limited availability of LNG bunkering infrastructure in certain regions, and the lack of standardization in bunkering procedures present considerable barriers. Additionally, safety concerns related to handling LNG and the relatively higher cost of LNG compared to traditional marine fuels pose significant challenges. The projected impact of these challenges on market growth is estimated at xx% reduction in projected growth by 2033.
Emerging Opportunities in US LNG Bunkering Industry
Emerging opportunities lie in expanding LNG bunkering infrastructure to smaller ports and developing innovative bunkering solutions for diverse vessel types. This includes exploring the use of smaller-scale LNG bunkering vessels and developing more efficient LNG supply chains. Furthermore, integrating digital technologies to optimize bunkering operations and improve safety presents significant opportunities.
Growth Accelerators in the US LNG Bunkering Industry
Long-term growth in the US LNG bunkering industry is expected to be propelled by technological innovations, such as the development of more efficient and cost-effective LNG bunkering technologies and systems. Strategic partnerships between LNG producers, shipping companies, and infrastructure developers will play a key role. Expansion into new geographic markets and further investments in LNG infrastructure will also be crucial.
Key Players Shaping the US LNG Bunkering Industry Market
- NorthStar Holdco Energy LLC
- Harvey Gulf International Marine LLC
- Eagle LNG Partners LLC
- Crowley Maritime Corporation
- Royal Dutch Shell PLC
- Conrad Shipyards LLC
- JAX LNG LLC
Notable Milestones in US LNG Bunkering Industry Sector
- 2020: Increased adoption of LNG bunkering in response to IMO 2020 regulations.
- 2022: Significant investments in LNG bunkering infrastructure in major US ports.
- 2023: Several strategic partnerships formed between LNG providers and shipping companies to expand LNG bunkering services. (Specific examples of partnerships would go here if available).
In-Depth US LNG Bunkering Industry Market Outlook
The US LNG bunkering industry is poised for significant growth in the coming years, driven by a confluence of factors, including stringent environmental regulations, growing availability of LNG as a fuel source, and ongoing investments in LNG bunkering infrastructure. Strategic opportunities exist for companies to invest in expanding LNG bunkering infrastructure, developing innovative bunkering solutions, and forming strategic partnerships to capture market share in this rapidly expanding sector. The market is projected to reach xx Million by 2033.
US LNG Bunkering Industry Segmentation
-
1. End-User
- 1.1. Tanker Fleet
- 1.2. Container Fleet
- 1.3. Bulk and General Cargo Fleet
- 1.4. Ferries and OSV
- 1.5. Others
US LNG Bunkering Industry Segmentation By Geography
-
1. North America
- 1.1. United States
- 1.2. Canada
- 1.3. Mexico
-
2. South America
- 2.1. Brazil
- 2.2. Argentina
- 2.3. Rest of South America
-
3. Europe
- 3.1. United Kingdom
- 3.2. Germany
- 3.3. France
- 3.4. Italy
- 3.5. Spain
- 3.6. Russia
- 3.7. Benelux
- 3.8. Nordics
- 3.9. Rest of Europe
-
4. Middle East & Africa
- 4.1. Turkey
- 4.2. Israel
- 4.3. GCC
- 4.4. North Africa
- 4.5. South Africa
- 4.6. Rest of Middle East & Africa
-
5. Asia Pacific
- 5.1. China
- 5.2. India
- 5.3. Japan
- 5.4. South Korea
- 5.5. ASEAN
- 5.6. Oceania
- 5.7. Rest of Asia Pacific
US LNG Bunkering Industry REPORT HIGHLIGHTS
| Aspects | Details |
|---|---|
| Study Period | 2019-2033 |
| Base Year | 2024 |
| Estimated Year | 2025 |
| Forecast Period | 2025-2033 |
| Historical Period | 2019-2024 |
| Growth Rate | CAGR of > 5.20% from 2019-2033 |
| Segmentation |
|
Table of Contents
- 1. Introduction
- 1.1. Research Scope
- 1.2. Market Segmentation
- 1.3. Research Methodology
- 1.4. Definitions and Assumptions
- 2. Executive Summary
- 2.1. Introduction
- 3. Market Dynamics
- 3.1. Introduction
- 3.2. Market Drivers
- 3.2.1. 4.; Increasing Production from Unconventional Sources4.; Growing Energy Demand in the Region
- 3.3. Market Restrains
- 3.3.1. 4.; Environmental Concerns
- 3.4. Market Trends
- 3.4.1. Container Fleet is Expected to Dominate in the Market
- 4. Market Factor Analysis
- 4.1. Porters Five Forces
- 4.2. Supply/Value Chain
- 4.3. PESTEL analysis
- 4.4. Market Entropy
- 4.5. Patent/Trademark Analysis
- 5. Global US LNG Bunkering Industry Analysis, Insights and Forecast, 2019-2031
- 5.1. Market Analysis, Insights and Forecast - by End-User
- 5.1.1. Tanker Fleet
- 5.1.2. Container Fleet
- 5.1.3. Bulk and General Cargo Fleet
- 5.1.4. Ferries and OSV
- 5.1.5. Others
- 5.2. Market Analysis, Insights and Forecast - by Region
- 5.2.1. North America
- 5.2.2. South America
- 5.2.3. Europe
- 5.2.4. Middle East & Africa
- 5.2.5. Asia Pacific
- 5.1. Market Analysis, Insights and Forecast - by End-User
- 6. North America US LNG Bunkering Industry Analysis, Insights and Forecast, 2019-2031
- 6.1. Market Analysis, Insights and Forecast - by End-User
- 6.1.1. Tanker Fleet
- 6.1.2. Container Fleet
- 6.1.3. Bulk and General Cargo Fleet
- 6.1.4. Ferries and OSV
- 6.1.5. Others
- 6.1. Market Analysis, Insights and Forecast - by End-User
- 7. South America US LNG Bunkering Industry Analysis, Insights and Forecast, 2019-2031
- 7.1. Market Analysis, Insights and Forecast - by End-User
- 7.1.1. Tanker Fleet
- 7.1.2. Container Fleet
- 7.1.3. Bulk and General Cargo Fleet
- 7.1.4. Ferries and OSV
- 7.1.5. Others
- 7.1. Market Analysis, Insights and Forecast - by End-User
- 8. Europe US LNG Bunkering Industry Analysis, Insights and Forecast, 2019-2031
- 8.1. Market Analysis, Insights and Forecast - by End-User
- 8.1.1. Tanker Fleet
- 8.1.2. Container Fleet
- 8.1.3. Bulk and General Cargo Fleet
- 8.1.4. Ferries and OSV
- 8.1.5. Others
- 8.1. Market Analysis, Insights and Forecast - by End-User
- 9. Middle East & Africa US LNG Bunkering Industry Analysis, Insights and Forecast, 2019-2031
- 9.1. Market Analysis, Insights and Forecast - by End-User
- 9.1.1. Tanker Fleet
- 9.1.2. Container Fleet
- 9.1.3. Bulk and General Cargo Fleet
- 9.1.4. Ferries and OSV
- 9.1.5. Others
- 9.1. Market Analysis, Insights and Forecast - by End-User
- 10. Asia Pacific US LNG Bunkering Industry Analysis, Insights and Forecast, 2019-2031
- 10.1. Market Analysis, Insights and Forecast - by End-User
- 10.1.1. Tanker Fleet
- 10.1.2. Container Fleet
- 10.1.3. Bulk and General Cargo Fleet
- 10.1.4. Ferries and OSV
- 10.1.5. Others
- 10.1. Market Analysis, Insights and Forecast - by End-User
- 11. Northeast US LNG Bunkering Industry Analysis, Insights and Forecast, 2019-2031
- 12. Southeast US LNG Bunkering Industry Analysis, Insights and Forecast, 2019-2031
- 13. Midwest US LNG Bunkering Industry Analysis, Insights and Forecast, 2019-2031
- 14. Southwest US LNG Bunkering Industry Analysis, Insights and Forecast, 2019-2031
- 15. West US LNG Bunkering Industry Analysis, Insights and Forecast, 2019-2031
- 16. Competitive Analysis
- 16.1. Global Market Share Analysis 2024
- 16.2. Company Profiles
- 16.2.1 NorthStar Holdco Energy LLC
- 16.2.1.1. Overview
- 16.2.1.2. Products
- 16.2.1.3. SWOT Analysis
- 16.2.1.4. Recent Developments
- 16.2.1.5. Financials (Based on Availability)
- 16.2.2 Harvey Gulf International Marine LLC
- 16.2.2.1. Overview
- 16.2.2.2. Products
- 16.2.2.3. SWOT Analysis
- 16.2.2.4. Recent Developments
- 16.2.2.5. Financials (Based on Availability)
- 16.2.3 Eagle LNG Partners LLC
- 16.2.3.1. Overview
- 16.2.3.2. Products
- 16.2.3.3. SWOT Analysis
- 16.2.3.4. Recent Developments
- 16.2.3.5. Financials (Based on Availability)
- 16.2.4 Crowley Maritime Corporation
- 16.2.4.1. Overview
- 16.2.4.2. Products
- 16.2.4.3. SWOT Analysis
- 16.2.4.4. Recent Developments
- 16.2.4.5. Financials (Based on Availability)
- 16.2.5 Royal Dutch Shell PLC
- 16.2.5.1. Overview
- 16.2.5.2. Products
- 16.2.5.3. SWOT Analysis
- 16.2.5.4. Recent Developments
- 16.2.5.5. Financials (Based on Availability)
- 16.2.6 Conrad Shipyards LLC
- 16.2.6.1. Overview
- 16.2.6.2. Products
- 16.2.6.3. SWOT Analysis
- 16.2.6.4. Recent Developments
- 16.2.6.5. Financials (Based on Availability)
- 16.2.7 JAX LNG LLC
- 16.2.7.1. Overview
- 16.2.7.2. Products
- 16.2.7.3. SWOT Analysis
- 16.2.7.4. Recent Developments
- 16.2.7.5. Financials (Based on Availability)
- 16.2.1 NorthStar Holdco Energy LLC
List of Figures
- Figure 1: Global US LNG Bunkering Industry Revenue Breakdown (Million, %) by Region 2024 & 2032
- Figure 2: United states US LNG Bunkering Industry Revenue (Million), by Country 2024 & 2032
- Figure 3: United states US LNG Bunkering Industry Revenue Share (%), by Country 2024 & 2032
- Figure 4: North America US LNG Bunkering Industry Revenue (Million), by End-User 2024 & 2032
- Figure 5: North America US LNG Bunkering Industry Revenue Share (%), by End-User 2024 & 2032
- Figure 6: North America US LNG Bunkering Industry Revenue (Million), by Country 2024 & 2032
- Figure 7: North America US LNG Bunkering Industry Revenue Share (%), by Country 2024 & 2032
- Figure 8: South America US LNG Bunkering Industry Revenue (Million), by End-User 2024 & 2032
- Figure 9: South America US LNG Bunkering Industry Revenue Share (%), by End-User 2024 & 2032
- Figure 10: South America US LNG Bunkering Industry Revenue (Million), by Country 2024 & 2032
- Figure 11: South America US LNG Bunkering Industry Revenue Share (%), by Country 2024 & 2032
- Figure 12: Europe US LNG Bunkering Industry Revenue (Million), by End-User 2024 & 2032
- Figure 13: Europe US LNG Bunkering Industry Revenue Share (%), by End-User 2024 & 2032
- Figure 14: Europe US LNG Bunkering Industry Revenue (Million), by Country 2024 & 2032
- Figure 15: Europe US LNG Bunkering Industry Revenue Share (%), by Country 2024 & 2032
- Figure 16: Middle East & Africa US LNG Bunkering Industry Revenue (Million), by End-User 2024 & 2032
- Figure 17: Middle East & Africa US LNG Bunkering Industry Revenue Share (%), by End-User 2024 & 2032
- Figure 18: Middle East & Africa US LNG Bunkering Industry Revenue (Million), by Country 2024 & 2032
- Figure 19: Middle East & Africa US LNG Bunkering Industry Revenue Share (%), by Country 2024 & 2032
- Figure 20: Asia Pacific US LNG Bunkering Industry Revenue (Million), by End-User 2024 & 2032
- Figure 21: Asia Pacific US LNG Bunkering Industry Revenue Share (%), by End-User 2024 & 2032
- Figure 22: Asia Pacific US LNG Bunkering Industry Revenue (Million), by Country 2024 & 2032
- Figure 23: Asia Pacific US LNG Bunkering Industry Revenue Share (%), by Country 2024 & 2032
List of Tables
- Table 1: Global US LNG Bunkering Industry Revenue Million Forecast, by Region 2019 & 2032
- Table 2: Global US LNG Bunkering Industry Revenue Million Forecast, by End-User 2019 & 2032
- Table 3: Global US LNG Bunkering Industry Revenue Million Forecast, by Region 2019 & 2032
- Table 4: Global US LNG Bunkering Industry Revenue Million Forecast, by Country 2019 & 2032
- Table 5: Northeast US LNG Bunkering Industry Revenue (Million) Forecast, by Application 2019 & 2032
- Table 6: Southeast US LNG Bunkering Industry Revenue (Million) Forecast, by Application 2019 & 2032
- Table 7: Midwest US LNG Bunkering Industry Revenue (Million) Forecast, by Application 2019 & 2032
- Table 8: Southwest US LNG Bunkering Industry Revenue (Million) Forecast, by Application 2019 & 2032
- Table 9: West US LNG Bunkering Industry Revenue (Million) Forecast, by Application 2019 & 2032
- Table 10: Global US LNG Bunkering Industry Revenue Million Forecast, by End-User 2019 & 2032
- Table 11: Global US LNG Bunkering Industry Revenue Million Forecast, by Country 2019 & 2032
- Table 12: United States US LNG Bunkering Industry Revenue (Million) Forecast, by Application 2019 & 2032
- Table 13: Canada US LNG Bunkering Industry Revenue (Million) Forecast, by Application 2019 & 2032
- Table 14: Mexico US LNG Bunkering Industry Revenue (Million) Forecast, by Application 2019 & 2032
- Table 15: Global US LNG Bunkering Industry Revenue Million Forecast, by End-User 2019 & 2032
- Table 16: Global US LNG Bunkering Industry Revenue Million Forecast, by Country 2019 & 2032
- Table 17: Brazil US LNG Bunkering Industry Revenue (Million) Forecast, by Application 2019 & 2032
- Table 18: Argentina US LNG Bunkering Industry Revenue (Million) Forecast, by Application 2019 & 2032
- Table 19: Rest of South America US LNG Bunkering Industry Revenue (Million) Forecast, by Application 2019 & 2032
- Table 20: Global US LNG Bunkering Industry Revenue Million Forecast, by End-User 2019 & 2032
- Table 21: Global US LNG Bunkering Industry Revenue Million Forecast, by Country 2019 & 2032
- Table 22: United Kingdom US LNG Bunkering Industry Revenue (Million) Forecast, by Application 2019 & 2032
- Table 23: Germany US LNG Bunkering Industry Revenue (Million) Forecast, by Application 2019 & 2032
- Table 24: France US LNG Bunkering Industry Revenue (Million) Forecast, by Application 2019 & 2032
- Table 25: Italy US LNG Bunkering Industry Revenue (Million) Forecast, by Application 2019 & 2032
- Table 26: Spain US LNG Bunkering Industry Revenue (Million) Forecast, by Application 2019 & 2032
- Table 27: Russia US LNG Bunkering Industry Revenue (Million) Forecast, by Application 2019 & 2032
- Table 28: Benelux US LNG Bunkering Industry Revenue (Million) Forecast, by Application 2019 & 2032
- Table 29: Nordics US LNG Bunkering Industry Revenue (Million) Forecast, by Application 2019 & 2032
- Table 30: Rest of Europe US LNG Bunkering Industry Revenue (Million) Forecast, by Application 2019 & 2032
- Table 31: Global US LNG Bunkering Industry Revenue Million Forecast, by End-User 2019 & 2032
- Table 32: Global US LNG Bunkering Industry Revenue Million Forecast, by Country 2019 & 2032
- Table 33: Turkey US LNG Bunkering Industry Revenue (Million) Forecast, by Application 2019 & 2032
- Table 34: Israel US LNG Bunkering Industry Revenue (Million) Forecast, by Application 2019 & 2032
- Table 35: GCC US LNG Bunkering Industry Revenue (Million) Forecast, by Application 2019 & 2032
- Table 36: North Africa US LNG Bunkering Industry Revenue (Million) Forecast, by Application 2019 & 2032
- Table 37: South Africa US LNG Bunkering Industry Revenue (Million) Forecast, by Application 2019 & 2032
- Table 38: Rest of Middle East & Africa US LNG Bunkering Industry Revenue (Million) Forecast, by Application 2019 & 2032
- Table 39: Global US LNG Bunkering Industry Revenue Million Forecast, by End-User 2019 & 2032
- Table 40: Global US LNG Bunkering Industry Revenue Million Forecast, by Country 2019 & 2032
- Table 41: China US LNG Bunkering Industry Revenue (Million) Forecast, by Application 2019 & 2032
- Table 42: India US LNG Bunkering Industry Revenue (Million) Forecast, by Application 2019 & 2032
- Table 43: Japan US LNG Bunkering Industry Revenue (Million) Forecast, by Application 2019 & 2032
- Table 44: South Korea US LNG Bunkering Industry Revenue (Million) Forecast, by Application 2019 & 2032
- Table 45: ASEAN US LNG Bunkering Industry Revenue (Million) Forecast, by Application 2019 & 2032
- Table 46: Oceania US LNG Bunkering Industry Revenue (Million) Forecast, by Application 2019 & 2032
- Table 47: Rest of Asia Pacific US LNG Bunkering Industry Revenue (Million) Forecast, by Application 2019 & 2032
Frequently Asked Questions
1. What is the projected Compound Annual Growth Rate (CAGR) of the US LNG Bunkering Industry?
The projected CAGR is approximately > 5.20%.
2. Which companies are prominent players in the US LNG Bunkering Industry?
Key companies in the market include NorthStar Holdco Energy LLC, Harvey Gulf International Marine LLC, Eagle LNG Partners LLC, Crowley Maritime Corporation, Royal Dutch Shell PLC, Conrad Shipyards LLC, JAX LNG LLC.
3. What are the main segments of the US LNG Bunkering Industry?
The market segments include End-User.
4. Can you provide details about the market size?
The market size is estimated to be USD XX Million as of 2022.
5. What are some drivers contributing to market growth?
4.; Increasing Production from Unconventional Sources4.; Growing Energy Demand in the Region.
6. What are the notable trends driving market growth?
Container Fleet is Expected to Dominate in the Market.
7. Are there any restraints impacting market growth?
4.; Environmental Concerns.
8. Can you provide examples of recent developments in the market?
N/A
9. What pricing options are available for accessing the report?
Pricing options include single-user, multi-user, and enterprise licenses priced at USD 3800, USD 4500, and USD 5800 respectively.
10. Is the market size provided in terms of value or volume?
The market size is provided in terms of value, measured in Million.
11. Are there any specific market keywords associated with the report?
Yes, the market keyword associated with the report is "US LNG Bunkering Industry," which aids in identifying and referencing the specific market segment covered.
12. How do I determine which pricing option suits my needs best?
The pricing options vary based on user requirements and access needs. Individual users may opt for single-user licenses, while businesses requiring broader access may choose multi-user or enterprise licenses for cost-effective access to the report.
13. Are there any additional resources or data provided in the US LNG Bunkering Industry report?
While the report offers comprehensive insights, it's advisable to review the specific contents or supplementary materials provided to ascertain if additional resources or data are available.
14. How can I stay updated on further developments or reports in the US LNG Bunkering Industry?
To stay informed about further developments, trends, and reports in the US LNG Bunkering Industry, consider subscribing to industry newsletters, following relevant companies and organizations, or regularly checking reputable industry news sources and publications.
Methodology
Step 1 - Identification of Relevant Samples Size from Population Database


Step 2 - Approaches for Defining Global Market Size (Value, Volume* & Price*)

Note*: In applicable scenarios
Step 3 - Data Sources
Primary Research
- Web Analytics
- Survey Reports
- Research Institute
- Latest Research Reports
- Opinion Leaders
Secondary Research
- Annual Reports
- White Paper
- Latest Press Release
- Industry Association
- Paid Database
- Investor Presentations

Step 4 - Data Triangulation
Involves using different sources of information in order to increase the validity of a study
These sources are likely to be stakeholders in a program - participants, other researchers, program staff, other community members, and so on.
Then we put all data in single framework & apply various statistical tools to find out the dynamic on the market.
During the analysis stage, feedback from the stakeholder groups would be compared to determine areas of agreement as well as areas of divergence


