
Key Insights
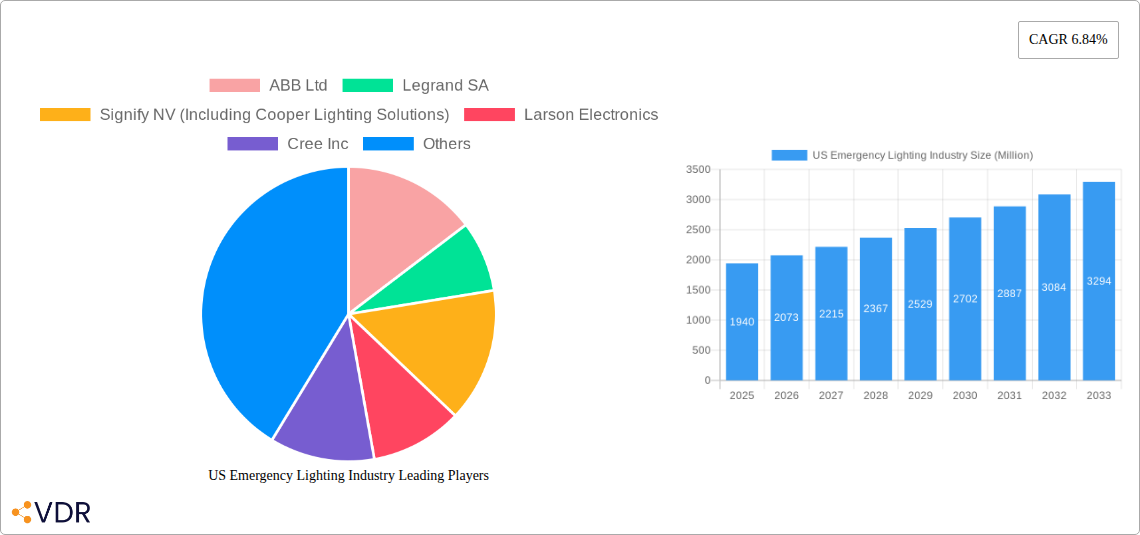
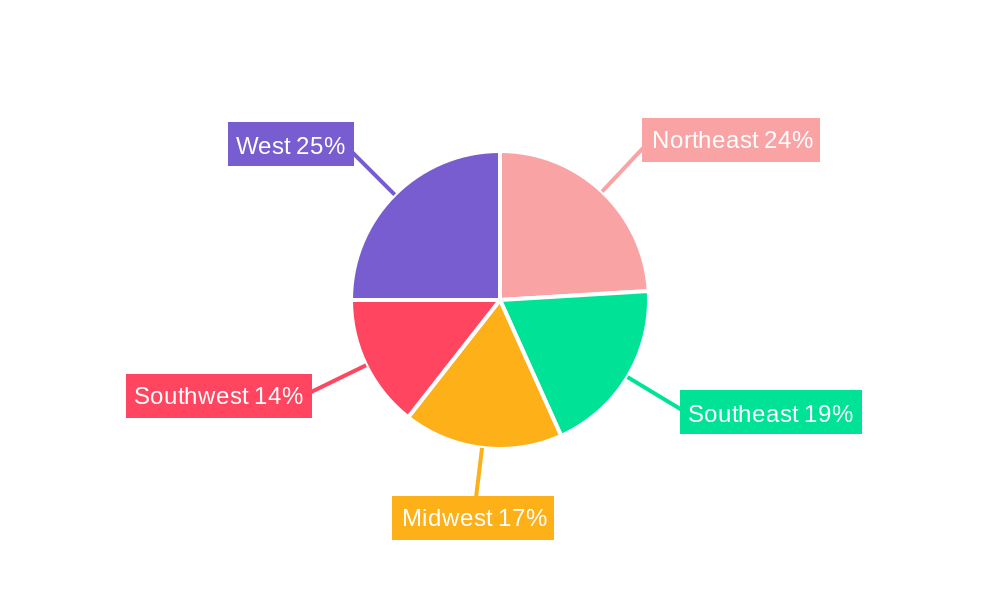
The US emergency lighting market, valued at $1.94 billion in 2025, is projected to experience robust growth, driven by stringent building codes and regulations mandating emergency lighting systems in commercial, industrial, and public spaces. Increased awareness of workplace safety and the rising adoption of smart lighting solutions, offering features like remote monitoring and predictive maintenance, further contribute to market expansion. The self-sustained segment, encompassing battery-powered units, is likely to dominate due to its reliability and independence from the central power grid, particularly crucial during power outages. Within end-user segments, the commercial sector holds a significant share, followed by industrial and healthcare facilities, reflecting the high density of occupants and critical operations requiring uninterrupted illumination. However, the market faces challenges including high initial investment costs associated with installing and maintaining emergency lighting systems, particularly in older buildings. Furthermore, technological advancements in energy-efficient lighting technologies are driving competition, necessitating continuous innovation to maintain market share. The forecast period of 2025-2033 anticipates a compound annual growth rate (CAGR) of 6.84%, indicating significant market expansion driven by factors like increasing infrastructure development and growing emphasis on safety standards across various sectors. Geographical distribution within the US suggests a higher concentration in densely populated regions like the Northeast and West Coast, owing to higher commercial and industrial activity.
The competitive landscape is marked by the presence of both established players like ABB Ltd, Legrand SA, and Signify NV, and smaller specialized companies focusing on niche applications. These companies are actively engaging in strategic partnerships, mergers, and acquisitions to expand their market presence and product portfolios. Product innovation, particularly in the areas of energy efficiency, smart features, and longer battery life, is key to success. The market's future trajectory is significantly influenced by technological advancements, regulatory changes, and the growing adoption of sustainable and environmentally friendly lighting solutions. The projected growth underscores the significant investment opportunities presented by the US emergency lighting market for businesses involved in manufacturing, distribution, and installation of these systems. Addressing challenges through innovative solutions and strategic partnerships will be crucial for capturing significant market share in the coming years.
US Emergency Lighting Industry Market Report: 2019-2033
This comprehensive report provides an in-depth analysis of the US emergency lighting industry, covering market dynamics, growth trends, key players, and future outlook. The study period spans from 2019 to 2033, with 2025 serving as the base and estimated year. This report is crucial for industry professionals, investors, and strategic decision-makers seeking a clear understanding of this vital sector. The total market size in 2025 is estimated at $XX Million.
US Emergency Lighting Industry Market Dynamics & Structure
The US emergency lighting market is a moderately concentrated industry with several major players holding significant market share. Technological innovation, driven by advancements in LED technology and smart lighting solutions, is a key driver. Stringent safety regulations and building codes significantly influence market dynamics, demanding compliance and driving adoption of advanced solutions. Competition from alternative lighting technologies remains limited due to the specialized nature of emergency lighting. The end-user landscape is diverse, encompassing commercial, industrial, educational, healthcare, and other sectors. Mergers and acquisitions (M&A) activity has been moderate, with key players strategically expanding their product portfolios and market reach.
- Market Concentration: Moderately concentrated, with the top 5 players holding an estimated XX% market share in 2025.
- Technological Innovation: LED technology, smart lighting, and IoT integration are key drivers.
- Regulatory Framework: Stringent safety standards and building codes necessitate compliance.
- Competitive Substitutes: Limited, due to the specialized nature of emergency lighting.
- End-User Demographics: Significant demand across commercial, industrial, healthcare, and educational sectors.
- M&A Trends: Moderate activity, focused on portfolio expansion and market penetration. XX major M&A deals occurred between 2019 and 2024.
US Emergency Lighting Industry Growth Trends & Insights
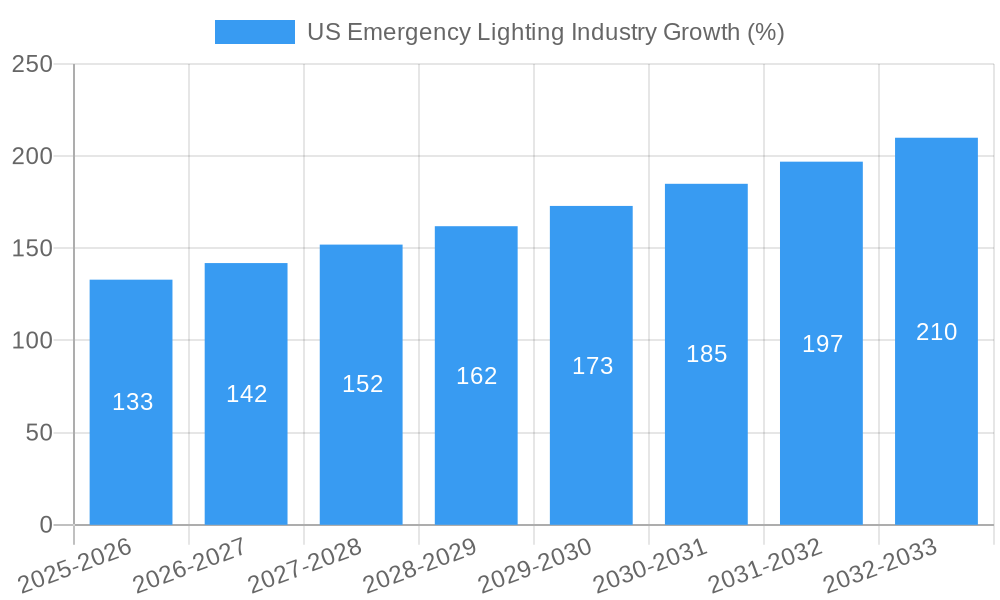
The US emergency lighting market experienced steady growth during the historical period (2019-2024), driven by increasing adoption rates across various end-user segments. The market's evolution is characterized by a shift towards energy-efficient LED-based solutions and smart lighting systems offering enhanced safety and control features. Technological disruptions, such as the integration of IoT capabilities and cloud-based monitoring, are fostering growth. Changing consumer behavior, emphasizing energy savings and improved safety, further fuels market expansion. The CAGR from 2019 to 2024 is estimated at XX%, with market penetration reaching approximately XX% in 2024. The forecasted CAGR from 2025 to 2033 is XX%.
Dominant Regions, Countries, or Segments in US Emergency Lighting Industry
The commercial sector leads the US emergency lighting market, accounting for an estimated XX% of market share in 2025, followed by the industrial sector at XX%. Within product types, self-sustained emergency lighting systems dominate, representing approximately XX% of the market due to their ease of installation and independence from central power supplies. Growth is driven by several key factors:
- Commercial Sector: Stringent safety regulations, high building density, and increasing awareness of safety standards.
- Industrial Sector: Focus on worker safety and compliance requirements, along with demand for robust and reliable systems in diverse environments.
- Self-Sustained Systems: Ease of installation, reliability, and independence from central power systems contribute to higher demand.
- Geographic Dominance: Major metropolitan areas and regions with robust construction activity exhibit higher market penetration.
US Emergency Lighting Industry Product Landscape
The US emergency lighting market offers a diverse range of products, from basic self-contained units to sophisticated, centrally managed systems with advanced features such as remote monitoring and intelligent control. LED technology is prevalent, offering significant energy savings and longer lifespans compared to traditional lighting technologies. Unique selling propositions include enhanced safety features, improved energy efficiency, and integrated smart functionalities. Technological advancements focus on improving battery life, integrating wireless communication, and enhancing system reliability.
Key Drivers, Barriers & Challenges in US Emergency Lighting Industry
Key Drivers: Stringent building codes and safety regulations, increasing awareness of workplace safety, advancements in LED technology, growing demand for energy-efficient solutions, and increasing adoption of smart lighting systems are primary drivers.
Challenges: High initial investment costs for advanced systems can pose a barrier, along with potential supply chain disruptions impacting component availability. Competition from established players and the need for continuous technological innovation also present ongoing challenges. The estimated impact of supply chain issues on market growth in 2025 is XX%.
Emerging Opportunities in US Emergency Lighting Industry
Emerging opportunities include the growing adoption of smart lighting technologies enabling remote monitoring and control, the expansion into specialized sectors like smart cities and data centers, and the development of innovative solutions addressing niche applications such as outdoor emergency lighting and hazardous location lighting. Untapped markets exist in smaller municipalities and remote areas with limited access to reliable power supplies.
Growth Accelerators in the US Emergency Lighting Industry Industry
Technological advancements in battery technology, particularly higher-capacity and longer-lasting batteries, significantly contribute to market growth. Strategic partnerships between manufacturers and system integrators facilitate market penetration and expand reach. Expansion into new markets, such as smart cities and critical infrastructure projects, will accelerate growth in the coming years.
Key Players Shaping the US Emergency Lighting Industry Market
- ABB Ltd
- Legrand SA
- Signify NV (Including Cooper Lighting Solutions)
- Larson Electronics
- Cree Inc
- Hubbell Incorporated
- Encore Lighting
- Emerson Electric Co
- Eaton Corporation PLC
- Acuity Brands Inc
- Myers Emergency Power Systems
- Digital Lumens Inc
Notable Milestones in US Emergency Lighting Industry Sector
- June 2021: Eaton acquired Cobham Mission Systems, expanding its aerospace and defense capabilities.
- June 2020: Emerson Appleton launched the Appleton Contender LED Luminaires, offering energy-efficient retrofit solutions for HID lighting systems.
In-Depth US Emergency Lighting Industry Market Outlook
The US emergency lighting market is poised for sustained growth over the forecast period (2025-2033), driven by continuous technological advancements, increasing demand for energy-efficient and smart lighting solutions, and stringent regulatory requirements. Strategic partnerships and market expansion into new segments will further accelerate growth. The market's long-term potential is significant, with opportunities for innovation and market leadership across various product categories and end-user sectors. The market is expected to reach $XX Million by 2033.
US Emergency Lighting Industry Segmentation
-
1. Type
- 1.1. Self-sustained
- 1.2. Centrally Supplied
-
2. End User
- 2.1. Commercial
- 2.2. Industrial
- 2.3. Educational
- 2.4. Healthcare
- 2.5. Other End Users
US Emergency Lighting Industry Segmentation By Geography
-
1. North America
- 1.1. United States
- 1.2. Canada
- 1.3. Mexico
-
2. South America
- 2.1. Brazil
- 2.2. Argentina
- 2.3. Rest of South America
-
3. Europe
- 3.1. United Kingdom
- 3.2. Germany
- 3.3. France
- 3.4. Italy
- 3.5. Spain
- 3.6. Russia
- 3.7. Benelux
- 3.8. Nordics
- 3.9. Rest of Europe
-
4. Middle East & Africa
- 4.1. Turkey
- 4.2. Israel
- 4.3. GCC
- 4.4. North Africa
- 4.5. South Africa
- 4.6. Rest of Middle East & Africa
-
5. Asia Pacific
- 5.1. China
- 5.2. India
- 5.3. Japan
- 5.4. South Korea
- 5.5. ASEAN
- 5.6. Oceania
- 5.7. Rest of Asia Pacific
US Emergency Lighting Industry REPORT HIGHLIGHTS
| Aspects | Details |
|---|---|
| Study Period | 2019-2033 |
| Base Year | 2024 |
| Estimated Year | 2025 |
| Forecast Period | 2025-2033 |
| Historical Period | 2019-2024 |
| Growth Rate | CAGR of 6.84% from 2019-2033 |
| Segmentation |
|
Table of Contents
- 1. Introduction
- 1.1. Research Scope
- 1.2. Market Segmentation
- 1.3. Research Methodology
- 1.4. Definitions and Assumptions
- 2. Executive Summary
- 2.1. Introduction
- 3. Market Dynamics
- 3.1. Introduction
- 3.2. Market Drivers
- 3.2.1. Increase in Need for Energy-efficient Lighting Systems and Favorable Government Regulations; Declining Prices of LED Products
- 3.3. Market Restrains
- 3.3.1. ; Lack of Awareness Regarding Installation Costs and Payback Periods
- 3.4. Market Trends
- 3.4.1. Development of Connected Systems and Internet of Things (IoT) and Declining Prices of LED to Drive the Market
- 4. Market Factor Analysis
- 4.1. Porters Five Forces
- 4.2. Supply/Value Chain
- 4.3. PESTEL analysis
- 4.4. Market Entropy
- 4.5. Patent/Trademark Analysis
- 5. Global US Emergency Lighting Industry Analysis, Insights and Forecast, 2019-2031
- 5.1. Market Analysis, Insights and Forecast - by Type
- 5.1.1. Self-sustained
- 5.1.2. Centrally Supplied
- 5.2. Market Analysis, Insights and Forecast - by End User
- 5.2.1. Commercial
- 5.2.2. Industrial
- 5.2.3. Educational
- 5.2.4. Healthcare
- 5.2.5. Other End Users
- 5.3. Market Analysis, Insights and Forecast - by Region
- 5.3.1. North America
- 5.3.2. South America
- 5.3.3. Europe
- 5.3.4. Middle East & Africa
- 5.3.5. Asia Pacific
- 5.1. Market Analysis, Insights and Forecast - by Type
- 6. North America US Emergency Lighting Industry Analysis, Insights and Forecast, 2019-2031
- 6.1. Market Analysis, Insights and Forecast - by Type
- 6.1.1. Self-sustained
- 6.1.2. Centrally Supplied
- 6.2. Market Analysis, Insights and Forecast - by End User
- 6.2.1. Commercial
- 6.2.2. Industrial
- 6.2.3. Educational
- 6.2.4. Healthcare
- 6.2.5. Other End Users
- 6.1. Market Analysis, Insights and Forecast - by Type
- 7. South America US Emergency Lighting Industry Analysis, Insights and Forecast, 2019-2031
- 7.1. Market Analysis, Insights and Forecast - by Type
- 7.1.1. Self-sustained
- 7.1.2. Centrally Supplied
- 7.2. Market Analysis, Insights and Forecast - by End User
- 7.2.1. Commercial
- 7.2.2. Industrial
- 7.2.3. Educational
- 7.2.4. Healthcare
- 7.2.5. Other End Users
- 7.1. Market Analysis, Insights and Forecast - by Type
- 8. Europe US Emergency Lighting Industry Analysis, Insights and Forecast, 2019-2031
- 8.1. Market Analysis, Insights and Forecast - by Type
- 8.1.1. Self-sustained
- 8.1.2. Centrally Supplied
- 8.2. Market Analysis, Insights and Forecast - by End User
- 8.2.1. Commercial
- 8.2.2. Industrial
- 8.2.3. Educational
- 8.2.4. Healthcare
- 8.2.5. Other End Users
- 8.1. Market Analysis, Insights and Forecast - by Type
- 9. Middle East & Africa US Emergency Lighting Industry Analysis, Insights and Forecast, 2019-2031
- 9.1. Market Analysis, Insights and Forecast - by Type
- 9.1.1. Self-sustained
- 9.1.2. Centrally Supplied
- 9.2. Market Analysis, Insights and Forecast - by End User
- 9.2.1. Commercial
- 9.2.2. Industrial
- 9.2.3. Educational
- 9.2.4. Healthcare
- 9.2.5. Other End Users
- 9.1. Market Analysis, Insights and Forecast - by Type
- 10. Asia Pacific US Emergency Lighting Industry Analysis, Insights and Forecast, 2019-2031
- 10.1. Market Analysis, Insights and Forecast - by Type
- 10.1.1. Self-sustained
- 10.1.2. Centrally Supplied
- 10.2. Market Analysis, Insights and Forecast - by End User
- 10.2.1. Commercial
- 10.2.2. Industrial
- 10.2.3. Educational
- 10.2.4. Healthcare
- 10.2.5. Other End Users
- 10.1. Market Analysis, Insights and Forecast - by Type
- 11. Northeast US Emergency Lighting Industry Analysis, Insights and Forecast, 2019-2031
- 12. Southeast US Emergency Lighting Industry Analysis, Insights and Forecast, 2019-2031
- 13. Midwest US Emergency Lighting Industry Analysis, Insights and Forecast, 2019-2031
- 14. Southwest US Emergency Lighting Industry Analysis, Insights and Forecast, 2019-2031
- 15. West US Emergency Lighting Industry Analysis, Insights and Forecast, 2019-2031
- 16. Competitive Analysis
- 16.1. Global Market Share Analysis 2024
- 16.2. Company Profiles
- 16.2.1 ABB Ltd
- 16.2.1.1. Overview
- 16.2.1.2. Products
- 16.2.1.3. SWOT Analysis
- 16.2.1.4. Recent Developments
- 16.2.1.5. Financials (Based on Availability)
- 16.2.2 Legrand SA
- 16.2.2.1. Overview
- 16.2.2.2. Products
- 16.2.2.3. SWOT Analysis
- 16.2.2.4. Recent Developments
- 16.2.2.5. Financials (Based on Availability)
- 16.2.3 Signify NV (Including Cooper Lighting Solutions)
- 16.2.3.1. Overview
- 16.2.3.2. Products
- 16.2.3.3. SWOT Analysis
- 16.2.3.4. Recent Developments
- 16.2.3.5. Financials (Based on Availability)
- 16.2.4 Larson Electronics
- 16.2.4.1. Overview
- 16.2.4.2. Products
- 16.2.4.3. SWOT Analysis
- 16.2.4.4. Recent Developments
- 16.2.4.5. Financials (Based on Availability)
- 16.2.5 Cree Inc
- 16.2.5.1. Overview
- 16.2.5.2. Products
- 16.2.5.3. SWOT Analysis
- 16.2.5.4. Recent Developments
- 16.2.5.5. Financials (Based on Availability)
- 16.2.6 Hubbell Incorporated
- 16.2.6.1. Overview
- 16.2.6.2. Products
- 16.2.6.3. SWOT Analysis
- 16.2.6.4. Recent Developments
- 16.2.6.5. Financials (Based on Availability)
- 16.2.7 Encore Lighting
- 16.2.7.1. Overview
- 16.2.7.2. Products
- 16.2.7.3. SWOT Analysis
- 16.2.7.4. Recent Developments
- 16.2.7.5. Financials (Based on Availability)
- 16.2.8 Emerson Electric Co
- 16.2.8.1. Overview
- 16.2.8.2. Products
- 16.2.8.3. SWOT Analysis
- 16.2.8.4. Recent Developments
- 16.2.8.5. Financials (Based on Availability)
- 16.2.9 Eaton Corporation PLC
- 16.2.9.1. Overview
- 16.2.9.2. Products
- 16.2.9.3. SWOT Analysis
- 16.2.9.4. Recent Developments
- 16.2.9.5. Financials (Based on Availability)
- 16.2.10 Acuity Brands Inc
- 16.2.10.1. Overview
- 16.2.10.2. Products
- 16.2.10.3. SWOT Analysis
- 16.2.10.4. Recent Developments
- 16.2.10.5. Financials (Based on Availability)
- 16.2.11 Myers Emergency Power Systems
- 16.2.11.1. Overview
- 16.2.11.2. Products
- 16.2.11.3. SWOT Analysis
- 16.2.11.4. Recent Developments
- 16.2.11.5. Financials (Based on Availability)
- 16.2.12 Digital Lumens Inc
- 16.2.12.1. Overview
- 16.2.12.2. Products
- 16.2.12.3. SWOT Analysis
- 16.2.12.4. Recent Developments
- 16.2.12.5. Financials (Based on Availability)
- 16.2.1 ABB Ltd
List of Figures
- Figure 1: Global US Emergency Lighting Industry Revenue Breakdown (Million, %) by Region 2024 & 2032
- Figure 2: Global US Emergency Lighting Industry Volume Breakdown (K Unit, %) by Region 2024 & 2032
- Figure 3: United states US Emergency Lighting Industry Revenue (Million), by Country 2024 & 2032
- Figure 4: United states US Emergency Lighting Industry Volume (K Unit), by Country 2024 & 2032
- Figure 5: United states US Emergency Lighting Industry Revenue Share (%), by Country 2024 & 2032
- Figure 6: United states US Emergency Lighting Industry Volume Share (%), by Country 2024 & 2032
- Figure 7: North America US Emergency Lighting Industry Revenue (Million), by Type 2024 & 2032
- Figure 8: North America US Emergency Lighting Industry Volume (K Unit), by Type 2024 & 2032
- Figure 9: North America US Emergency Lighting Industry Revenue Share (%), by Type 2024 & 2032
- Figure 10: North America US Emergency Lighting Industry Volume Share (%), by Type 2024 & 2032
- Figure 11: North America US Emergency Lighting Industry Revenue (Million), by End User 2024 & 2032
- Figure 12: North America US Emergency Lighting Industry Volume (K Unit), by End User 2024 & 2032
- Figure 13: North America US Emergency Lighting Industry Revenue Share (%), by End User 2024 & 2032
- Figure 14: North America US Emergency Lighting Industry Volume Share (%), by End User 2024 & 2032
- Figure 15: North America US Emergency Lighting Industry Revenue (Million), by Country 2024 & 2032
- Figure 16: North America US Emergency Lighting Industry Volume (K Unit), by Country 2024 & 2032
- Figure 17: North America US Emergency Lighting Industry Revenue Share (%), by Country 2024 & 2032
- Figure 18: North America US Emergency Lighting Industry Volume Share (%), by Country 2024 & 2032
- Figure 19: South America US Emergency Lighting Industry Revenue (Million), by Type 2024 & 2032
- Figure 20: South America US Emergency Lighting Industry Volume (K Unit), by Type 2024 & 2032
- Figure 21: South America US Emergency Lighting Industry Revenue Share (%), by Type 2024 & 2032
- Figure 22: South America US Emergency Lighting Industry Volume Share (%), by Type 2024 & 2032
- Figure 23: South America US Emergency Lighting Industry Revenue (Million), by End User 2024 & 2032
- Figure 24: South America US Emergency Lighting Industry Volume (K Unit), by End User 2024 & 2032
- Figure 25: South America US Emergency Lighting Industry Revenue Share (%), by End User 2024 & 2032
- Figure 26: South America US Emergency Lighting Industry Volume Share (%), by End User 2024 & 2032
- Figure 27: South America US Emergency Lighting Industry Revenue (Million), by Country 2024 & 2032
- Figure 28: South America US Emergency Lighting Industry Volume (K Unit), by Country 2024 & 2032
- Figure 29: South America US Emergency Lighting Industry Revenue Share (%), by Country 2024 & 2032
- Figure 30: South America US Emergency Lighting Industry Volume Share (%), by Country 2024 & 2032
- Figure 31: Europe US Emergency Lighting Industry Revenue (Million), by Type 2024 & 2032
- Figure 32: Europe US Emergency Lighting Industry Volume (K Unit), by Type 2024 & 2032
- Figure 33: Europe US Emergency Lighting Industry Revenue Share (%), by Type 2024 & 2032
- Figure 34: Europe US Emergency Lighting Industry Volume Share (%), by Type 2024 & 2032
- Figure 35: Europe US Emergency Lighting Industry Revenue (Million), by End User 2024 & 2032
- Figure 36: Europe US Emergency Lighting Industry Volume (K Unit), by End User 2024 & 2032
- Figure 37: Europe US Emergency Lighting Industry Revenue Share (%), by End User 2024 & 2032
- Figure 38: Europe US Emergency Lighting Industry Volume Share (%), by End User 2024 & 2032
- Figure 39: Europe US Emergency Lighting Industry Revenue (Million), by Country 2024 & 2032
- Figure 40: Europe US Emergency Lighting Industry Volume (K Unit), by Country 2024 & 2032
- Figure 41: Europe US Emergency Lighting Industry Revenue Share (%), by Country 2024 & 2032
- Figure 42: Europe US Emergency Lighting Industry Volume Share (%), by Country 2024 & 2032
- Figure 43: Middle East & Africa US Emergency Lighting Industry Revenue (Million), by Type 2024 & 2032
- Figure 44: Middle East & Africa US Emergency Lighting Industry Volume (K Unit), by Type 2024 & 2032
- Figure 45: Middle East & Africa US Emergency Lighting Industry Revenue Share (%), by Type 2024 & 2032
- Figure 46: Middle East & Africa US Emergency Lighting Industry Volume Share (%), by Type 2024 & 2032
- Figure 47: Middle East & Africa US Emergency Lighting Industry Revenue (Million), by End User 2024 & 2032
- Figure 48: Middle East & Africa US Emergency Lighting Industry Volume (K Unit), by End User 2024 & 2032
- Figure 49: Middle East & Africa US Emergency Lighting Industry Revenue Share (%), by End User 2024 & 2032
- Figure 50: Middle East & Africa US Emergency Lighting Industry Volume Share (%), by End User 2024 & 2032
- Figure 51: Middle East & Africa US Emergency Lighting Industry Revenue (Million), by Country 2024 & 2032
- Figure 52: Middle East & Africa US Emergency Lighting Industry Volume (K Unit), by Country 2024 & 2032
- Figure 53: Middle East & Africa US Emergency Lighting Industry Revenue Share (%), by Country 2024 & 2032
- Figure 54: Middle East & Africa US Emergency Lighting Industry Volume Share (%), by Country 2024 & 2032
- Figure 55: Asia Pacific US Emergency Lighting Industry Revenue (Million), by Type 2024 & 2032
- Figure 56: Asia Pacific US Emergency Lighting Industry Volume (K Unit), by Type 2024 & 2032
- Figure 57: Asia Pacific US Emergency Lighting Industry Revenue Share (%), by Type 2024 & 2032
- Figure 58: Asia Pacific US Emergency Lighting Industry Volume Share (%), by Type 2024 & 2032
- Figure 59: Asia Pacific US Emergency Lighting Industry Revenue (Million), by End User 2024 & 2032
- Figure 60: Asia Pacific US Emergency Lighting Industry Volume (K Unit), by End User 2024 & 2032
- Figure 61: Asia Pacific US Emergency Lighting Industry Revenue Share (%), by End User 2024 & 2032
- Figure 62: Asia Pacific US Emergency Lighting Industry Volume Share (%), by End User 2024 & 2032
- Figure 63: Asia Pacific US Emergency Lighting Industry Revenue (Million), by Country 2024 & 2032
- Figure 64: Asia Pacific US Emergency Lighting Industry Volume (K Unit), by Country 2024 & 2032
- Figure 65: Asia Pacific US Emergency Lighting Industry Revenue Share (%), by Country 2024 & 2032
- Figure 66: Asia Pacific US Emergency Lighting Industry Volume Share (%), by Country 2024 & 2032
List of Tables
- Table 1: Global US Emergency Lighting Industry Revenue Million Forecast, by Region 2019 & 2032
- Table 2: Global US Emergency Lighting Industry Volume K Unit Forecast, by Region 2019 & 2032
- Table 3: Global US Emergency Lighting Industry Revenue Million Forecast, by Type 2019 & 2032
- Table 4: Global US Emergency Lighting Industry Volume K Unit Forecast, by Type 2019 & 2032
- Table 5: Global US Emergency Lighting Industry Revenue Million Forecast, by End User 2019 & 2032
- Table 6: Global US Emergency Lighting Industry Volume K Unit Forecast, by End User 2019 & 2032
- Table 7: Global US Emergency Lighting Industry Revenue Million Forecast, by Region 2019 & 2032
- Table 8: Global US Emergency Lighting Industry Volume K Unit Forecast, by Region 2019 & 2032
- Table 9: Global US Emergency Lighting Industry Revenue Million Forecast, by Country 2019 & 2032
- Table 10: Global US Emergency Lighting Industry Volume K Unit Forecast, by Country 2019 & 2032
- Table 11: Northeast US Emergency Lighting Industry Revenue (Million) Forecast, by Application 2019 & 2032
- Table 12: Northeast US Emergency Lighting Industry Volume (K Unit) Forecast, by Application 2019 & 2032
- Table 13: Southeast US Emergency Lighting Industry Revenue (Million) Forecast, by Application 2019 & 2032
- Table 14: Southeast US Emergency Lighting Industry Volume (K Unit) Forecast, by Application 2019 & 2032
- Table 15: Midwest US Emergency Lighting Industry Revenue (Million) Forecast, by Application 2019 & 2032
- Table 16: Midwest US Emergency Lighting Industry Volume (K Unit) Forecast, by Application 2019 & 2032
- Table 17: Southwest US Emergency Lighting Industry Revenue (Million) Forecast, by Application 2019 & 2032
- Table 18: Southwest US Emergency Lighting Industry Volume (K Unit) Forecast, by Application 2019 & 2032
- Table 19: West US Emergency Lighting Industry Revenue (Million) Forecast, by Application 2019 & 2032
- Table 20: West US Emergency Lighting Industry Volume (K Unit) Forecast, by Application 2019 & 2032
- Table 21: Global US Emergency Lighting Industry Revenue Million Forecast, by Type 2019 & 2032
- Table 22: Global US Emergency Lighting Industry Volume K Unit Forecast, by Type 2019 & 2032
- Table 23: Global US Emergency Lighting Industry Revenue Million Forecast, by End User 2019 & 2032
- Table 24: Global US Emergency Lighting Industry Volume K Unit Forecast, by End User 2019 & 2032
- Table 25: Global US Emergency Lighting Industry Revenue Million Forecast, by Country 2019 & 2032
- Table 26: Global US Emergency Lighting Industry Volume K Unit Forecast, by Country 2019 & 2032
- Table 27: United States US Emergency Lighting Industry Revenue (Million) Forecast, by Application 2019 & 2032
- Table 28: United States US Emergency Lighting Industry Volume (K Unit) Forecast, by Application 2019 & 2032
- Table 29: Canada US Emergency Lighting Industry Revenue (Million) Forecast, by Application 2019 & 2032
- Table 30: Canada US Emergency Lighting Industry Volume (K Unit) Forecast, by Application 2019 & 2032
- Table 31: Mexico US Emergency Lighting Industry Revenue (Million) Forecast, by Application 2019 & 2032
- Table 32: Mexico US Emergency Lighting Industry Volume (K Unit) Forecast, by Application 2019 & 2032
- Table 33: Global US Emergency Lighting Industry Revenue Million Forecast, by Type 2019 & 2032
- Table 34: Global US Emergency Lighting Industry Volume K Unit Forecast, by Type 2019 & 2032
- Table 35: Global US Emergency Lighting Industry Revenue Million Forecast, by End User 2019 & 2032
- Table 36: Global US Emergency Lighting Industry Volume K Unit Forecast, by End User 2019 & 2032
- Table 37: Global US Emergency Lighting Industry Revenue Million Forecast, by Country 2019 & 2032
- Table 38: Global US Emergency Lighting Industry Volume K Unit Forecast, by Country 2019 & 2032
- Table 39: Brazil US Emergency Lighting Industry Revenue (Million) Forecast, by Application 2019 & 2032
- Table 40: Brazil US Emergency Lighting Industry Volume (K Unit) Forecast, by Application 2019 & 2032
- Table 41: Argentina US Emergency Lighting Industry Revenue (Million) Forecast, by Application 2019 & 2032
- Table 42: Argentina US Emergency Lighting Industry Volume (K Unit) Forecast, by Application 2019 & 2032
- Table 43: Rest of South America US Emergency Lighting Industry Revenue (Million) Forecast, by Application 2019 & 2032
- Table 44: Rest of South America US Emergency Lighting Industry Volume (K Unit) Forecast, by Application 2019 & 2032
- Table 45: Global US Emergency Lighting Industry Revenue Million Forecast, by Type 2019 & 2032
- Table 46: Global US Emergency Lighting Industry Volume K Unit Forecast, by Type 2019 & 2032
- Table 47: Global US Emergency Lighting Industry Revenue Million Forecast, by End User 2019 & 2032
- Table 48: Global US Emergency Lighting Industry Volume K Unit Forecast, by End User 2019 & 2032
- Table 49: Global US Emergency Lighting Industry Revenue Million Forecast, by Country 2019 & 2032
- Table 50: Global US Emergency Lighting Industry Volume K Unit Forecast, by Country 2019 & 2032
- Table 51: United Kingdom US Emergency Lighting Industry Revenue (Million) Forecast, by Application 2019 & 2032
- Table 52: United Kingdom US Emergency Lighting Industry Volume (K Unit) Forecast, by Application 2019 & 2032
- Table 53: Germany US Emergency Lighting Industry Revenue (Million) Forecast, by Application 2019 & 2032
- Table 54: Germany US Emergency Lighting Industry Volume (K Unit) Forecast, by Application 2019 & 2032
- Table 55: France US Emergency Lighting Industry Revenue (Million) Forecast, by Application 2019 & 2032
- Table 56: France US Emergency Lighting Industry Volume (K Unit) Forecast, by Application 2019 & 2032
- Table 57: Italy US Emergency Lighting Industry Revenue (Million) Forecast, by Application 2019 & 2032
- Table 58: Italy US Emergency Lighting Industry Volume (K Unit) Forecast, by Application 2019 & 2032
- Table 59: Spain US Emergency Lighting Industry Revenue (Million) Forecast, by Application 2019 & 2032
- Table 60: Spain US Emergency Lighting Industry Volume (K Unit) Forecast, by Application 2019 & 2032
- Table 61: Russia US Emergency Lighting Industry Revenue (Million) Forecast, by Application 2019 & 2032
- Table 62: Russia US Emergency Lighting Industry Volume (K Unit) Forecast, by Application 2019 & 2032
- Table 63: Benelux US Emergency Lighting Industry Revenue (Million) Forecast, by Application 2019 & 2032
- Table 64: Benelux US Emergency Lighting Industry Volume (K Unit) Forecast, by Application 2019 & 2032
- Table 65: Nordics US Emergency Lighting Industry Revenue (Million) Forecast, by Application 2019 & 2032
- Table 66: Nordics US Emergency Lighting Industry Volume (K Unit) Forecast, by Application 2019 & 2032
- Table 67: Rest of Europe US Emergency Lighting Industry Revenue (Million) Forecast, by Application 2019 & 2032
- Table 68: Rest of Europe US Emergency Lighting Industry Volume (K Unit) Forecast, by Application 2019 & 2032
- Table 69: Global US Emergency Lighting Industry Revenue Million Forecast, by Type 2019 & 2032
- Table 70: Global US Emergency Lighting Industry Volume K Unit Forecast, by Type 2019 & 2032
- Table 71: Global US Emergency Lighting Industry Revenue Million Forecast, by End User 2019 & 2032
- Table 72: Global US Emergency Lighting Industry Volume K Unit Forecast, by End User 2019 & 2032
- Table 73: Global US Emergency Lighting Industry Revenue Million Forecast, by Country 2019 & 2032
- Table 74: Global US Emergency Lighting Industry Volume K Unit Forecast, by Country 2019 & 2032
- Table 75: Turkey US Emergency Lighting Industry Revenue (Million) Forecast, by Application 2019 & 2032
- Table 76: Turkey US Emergency Lighting Industry Volume (K Unit) Forecast, by Application 2019 & 2032
- Table 77: Israel US Emergency Lighting Industry Revenue (Million) Forecast, by Application 2019 & 2032
- Table 78: Israel US Emergency Lighting Industry Volume (K Unit) Forecast, by Application 2019 & 2032
- Table 79: GCC US Emergency Lighting Industry Revenue (Million) Forecast, by Application 2019 & 2032
- Table 80: GCC US Emergency Lighting Industry Volume (K Unit) Forecast, by Application 2019 & 2032
- Table 81: North Africa US Emergency Lighting Industry Revenue (Million) Forecast, by Application 2019 & 2032
- Table 82: North Africa US Emergency Lighting Industry Volume (K Unit) Forecast, by Application 2019 & 2032
- Table 83: South Africa US Emergency Lighting Industry Revenue (Million) Forecast, by Application 2019 & 2032
- Table 84: South Africa US Emergency Lighting Industry Volume (K Unit) Forecast, by Application 2019 & 2032
- Table 85: Rest of Middle East & Africa US Emergency Lighting Industry Revenue (Million) Forecast, by Application 2019 & 2032
- Table 86: Rest of Middle East & Africa US Emergency Lighting Industry Volume (K Unit) Forecast, by Application 2019 & 2032
- Table 87: Global US Emergency Lighting Industry Revenue Million Forecast, by Type 2019 & 2032
- Table 88: Global US Emergency Lighting Industry Volume K Unit Forecast, by Type 2019 & 2032
- Table 89: Global US Emergency Lighting Industry Revenue Million Forecast, by End User 2019 & 2032
- Table 90: Global US Emergency Lighting Industry Volume K Unit Forecast, by End User 2019 & 2032
- Table 91: Global US Emergency Lighting Industry Revenue Million Forecast, by Country 2019 & 2032
- Table 92: Global US Emergency Lighting Industry Volume K Unit Forecast, by Country 2019 & 2032
- Table 93: China US Emergency Lighting Industry Revenue (Million) Forecast, by Application 2019 & 2032
- Table 94: China US Emergency Lighting Industry Volume (K Unit) Forecast, by Application 2019 & 2032
- Table 95: India US Emergency Lighting Industry Revenue (Million) Forecast, by Application 2019 & 2032
- Table 96: India US Emergency Lighting Industry Volume (K Unit) Forecast, by Application 2019 & 2032
- Table 97: Japan US Emergency Lighting Industry Revenue (Million) Forecast, by Application 2019 & 2032
- Table 98: Japan US Emergency Lighting Industry Volume (K Unit) Forecast, by Application 2019 & 2032
- Table 99: South Korea US Emergency Lighting Industry Revenue (Million) Forecast, by Application 2019 & 2032
- Table 100: South Korea US Emergency Lighting Industry Volume (K Unit) Forecast, by Application 2019 & 2032
- Table 101: ASEAN US Emergency Lighting Industry Revenue (Million) Forecast, by Application 2019 & 2032
- Table 102: ASEAN US Emergency Lighting Industry Volume (K Unit) Forecast, by Application 2019 & 2032
- Table 103: Oceania US Emergency Lighting Industry Revenue (Million) Forecast, by Application 2019 & 2032
- Table 104: Oceania US Emergency Lighting Industry Volume (K Unit) Forecast, by Application 2019 & 2032
- Table 105: Rest of Asia Pacific US Emergency Lighting Industry Revenue (Million) Forecast, by Application 2019 & 2032
- Table 106: Rest of Asia Pacific US Emergency Lighting Industry Volume (K Unit) Forecast, by Application 2019 & 2032
Frequently Asked Questions
1. What is the projected Compound Annual Growth Rate (CAGR) of the US Emergency Lighting Industry?
The projected CAGR is approximately 6.84%.
2. Which companies are prominent players in the US Emergency Lighting Industry?
Key companies in the market include ABB Ltd, Legrand SA, Signify NV (Including Cooper Lighting Solutions), Larson Electronics, Cree Inc, Hubbell Incorporated, Encore Lighting, Emerson Electric Co, Eaton Corporation PLC, Acuity Brands Inc, Myers Emergency Power Systems, Digital Lumens Inc.
3. What are the main segments of the US Emergency Lighting Industry?
The market segments include Type, End User.
4. Can you provide details about the market size?
The market size is estimated to be USD 1.94 Million as of 2022.
5. What are some drivers contributing to market growth?
Increase in Need for Energy-efficient Lighting Systems and Favorable Government Regulations; Declining Prices of LED Products.
6. What are the notable trends driving market growth?
Development of Connected Systems and Internet of Things (IoT) and Declining Prices of LED to Drive the Market.
7. Are there any restraints impacting market growth?
; Lack of Awareness Regarding Installation Costs and Payback Periods.
8. Can you provide examples of recent developments in the market?
June 2021 - Eaton acquired Cobham Mission Systems. Cobham is a manufacturer of air-to-air refueling systems, environmental systems, and actuation, primarily for defense markets. This acquisition will help to expand Eaton Aerospace's fuel systems offerings and other defense-related offerings.
9. What pricing options are available for accessing the report?
Pricing options include single-user, multi-user, and enterprise licenses priced at USD 3800, USD 4500, and USD 5800 respectively.
10. Is the market size provided in terms of value or volume?
The market size is provided in terms of value, measured in Million and volume, measured in K Unit.
11. Are there any specific market keywords associated with the report?
Yes, the market keyword associated with the report is "US Emergency Lighting Industry," which aids in identifying and referencing the specific market segment covered.
12. How do I determine which pricing option suits my needs best?
The pricing options vary based on user requirements and access needs. Individual users may opt for single-user licenses, while businesses requiring broader access may choose multi-user or enterprise licenses for cost-effective access to the report.
13. Are there any additional resources or data provided in the US Emergency Lighting Industry report?
While the report offers comprehensive insights, it's advisable to review the specific contents or supplementary materials provided to ascertain if additional resources or data are available.
14. How can I stay updated on further developments or reports in the US Emergency Lighting Industry?
To stay informed about further developments, trends, and reports in the US Emergency Lighting Industry, consider subscribing to industry newsletters, following relevant companies and organizations, or regularly checking reputable industry news sources and publications.
Methodology
Step 1 - Identification of Relevant Samples Size from Population Database


Step 2 - Approaches for Defining Global Market Size (Value, Volume* & Price*)

Note*: In applicable scenarios
Step 3 - Data Sources
Primary Research
- Web Analytics
- Survey Reports
- Research Institute
- Latest Research Reports
- Opinion Leaders
Secondary Research
- Annual Reports
- White Paper
- Latest Press Release
- Industry Association
- Paid Database
- Investor Presentations

Step 4 - Data Triangulation
Involves using different sources of information in order to increase the validity of a study
These sources are likely to be stakeholders in a program - participants, other researchers, program staff, other community members, and so on.
Then we put all data in single framework & apply various statistical tools to find out the dynamic on the market.
During the analysis stage, feedback from the stakeholder groups would be compared to determine areas of agreement as well as areas of divergence


