
Key Insights
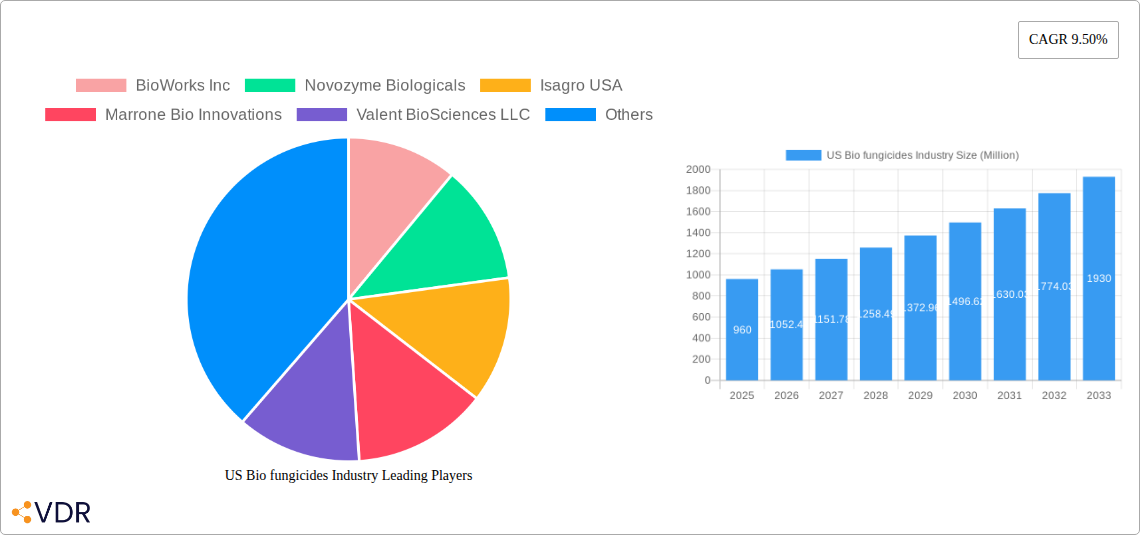
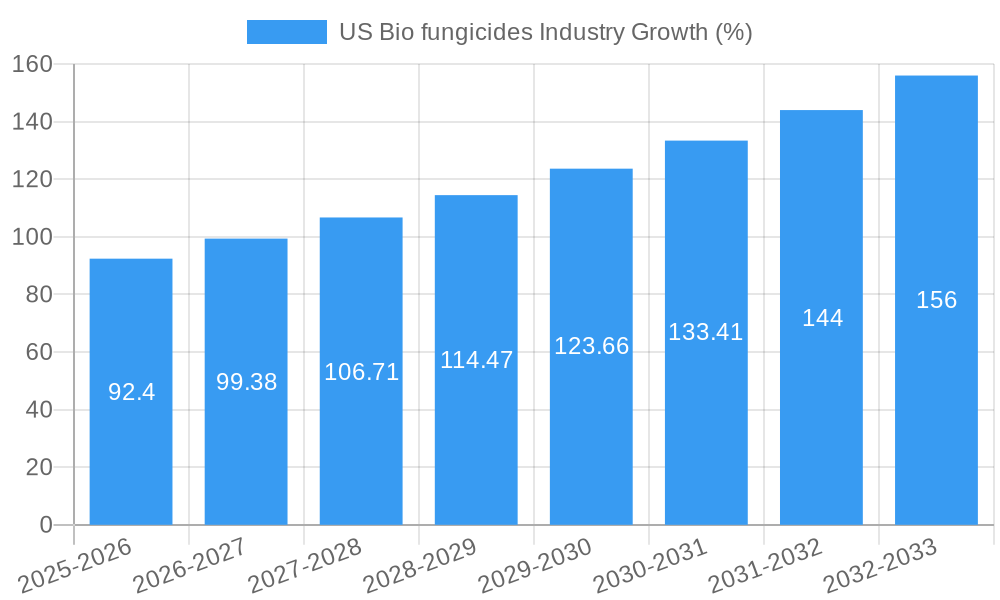
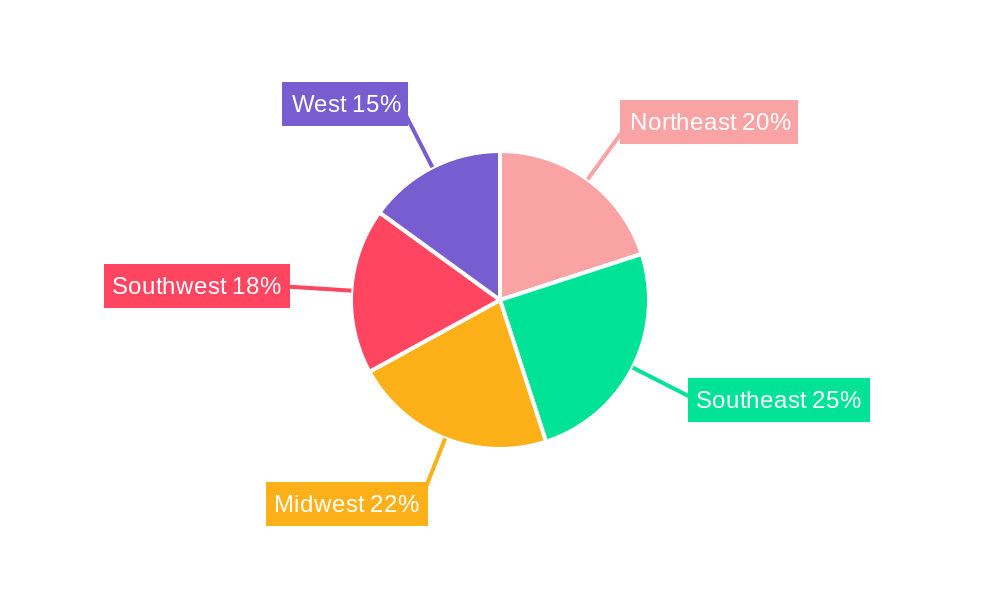
The US biofungicides market, valued at $960 million in 2025, is projected to experience robust growth, driven by increasing demand for sustainable and environmentally friendly agricultural practices. The rising prevalence of fungal diseases affecting major crops like grains and cereals, oilseeds, and fruits & vegetables necessitates effective and eco-conscious solutions. This is further fueled by stringent government regulations on chemical fungicides and growing consumer awareness regarding food safety and residue-free produce. The market segmentation reveals a significant demand across various crop types, with grains and cereals likely dominating due to their extensive acreage and susceptibility to fungal pathogens. Key players like BioWorks Inc, Novozyme Biologicals, and Syngenta AG are actively investing in research and development to introduce innovative biofungicide solutions, fostering market competition and driving innovation. The regional distribution shows significant market penetration across all US regions, reflecting the widespread adoption of biofungicides across diverse agricultural landscapes. The 9.50% CAGR projected through 2033 indicates a substantial expansion of the market, driven by factors such as technological advancements, increasing farmer adoption, and growing government support for sustainable agriculture.
The market's growth trajectory is anticipated to remain positive due to several factors. Continued research into novel biofungicide formulations, tailored for specific pathogens and crop types, will increase efficacy and market appeal. Government initiatives promoting sustainable agriculture and offering incentives for biopesticide adoption are expected to further propel market expansion. However, challenges remain, including the relatively higher cost of biofungicides compared to their chemical counterparts and the potential for inconsistent efficacy under varying environmental conditions. Overcoming these challenges through targeted research and development, improved supply chain management, and effective farmer education will be crucial for realizing the full market potential of biofungicides in the US.
US Biofungicides Industry Market Report: 2019-2033
This comprehensive report provides an in-depth analysis of the US biofungicides market, offering invaluable insights for industry professionals, investors, and stakeholders. The report covers the period 2019-2033, with a focus on the forecast period 2025-2033 and a base year of 2025. Market size is presented in million USD.
US Biofungicides Industry Market Dynamics & Structure
The US biofungicides market is experiencing significant growth driven by increasing consumer demand for sustainable agricultural practices and stricter regulations on chemical fungicides. Market concentration is moderate, with several key players holding significant shares, but also fostering healthy competition. Technological innovation, particularly in bio-pesticide formulation and delivery systems, plays a crucial role. Regulatory frameworks, such as the EPA's registration processes, influence market access and product development. Biofungicides face competition from traditional chemical fungicides, but their inherent advantages in terms of environmental impact and human health are driving market shift. End-user demographics, encompassing both large-scale commercial farms and smaller-scale operations, vary widely affecting market segmentation. M&A activity has been moderate, primarily focused on strengthening product portfolios and expanding market reach. Over the study period (2019-2024), approximately xx M&A deals were recorded, resulting in a xx% market share shift among the top five players.
- Market Concentration: Moderately concentrated, with top 5 players holding approximately xx% market share in 2024.
- Technological Innovation: Focus on improved efficacy, targeted delivery systems, and resistance management.
- Regulatory Framework: EPA regulations influence product approval and market access.
- Competitive Substitutes: Chemical fungicides remain dominant, but biofungicides offer a sustainable alternative.
- End-User Demographics: Diverse, ranging from large commercial farms to smaller-scale growers.
- M&A Trends: Moderate activity, driven by portfolio expansion and market share consolidation.
US Biofungicides Industry Growth Trends & Insights
The US biofungicides market demonstrates a robust growth trajectory, driven by factors including the growing awareness of environmental sustainability among consumers and increased government initiatives promoting organic farming. The market size expanded from xx million USD in 2019 to xx million USD in 2024, exhibiting a CAGR of xx%. This growth is expected to continue through 2033, reaching an estimated xx million USD. Technological disruptions such as CRISPR-Cas9 technology for improved strain development have accelerated biofungicide efficacy. Consumer behavior increasingly favors environmentally friendly products, boosting adoption rates within organic and conventional farming practices. Market penetration continues to improve, with a projected xx% market share by 2033 compared to xx% in 2024.
Dominant Regions, Countries, or Segments in US Biofungicides Industry
The Fruits and Vegetables segment is currently the largest and fastest-growing segment within the US biofungicides market, followed by Grains and Cereals. California, Florida, and Washington are key regions driving growth due to their significant agricultural output and favorable climate for various crops. The high value of fruits and vegetables and the increasing prevalence of fungal diseases contribute to the segment's dominance. The increasing preference for organic produce and stricter regulations on chemical fungicides are key drivers in this segment.
- Key Drivers in Fruits and Vegetables Segment:
- High value crops demanding effective disease control.
- Growing consumer demand for organic and sustainably produced fruits and vegetables.
- Stringent regulations on chemical fungicide usage.
- Favorable climate conditions in key growing regions (e.g., California, Florida).
- Market Share and Growth Potential: The Fruits and Vegetables segment holds approximately xx% of the market share and is projected to grow at a CAGR of xx% during the forecast period.
US Biofungicides Industry Product Landscape
Biofungicides encompass a diverse range of products including bacterial and fungal-based formulations, and enzyme-based solutions. These products are applied via various methods, including foliar sprays, soil treatments, and seed treatments. Recent innovations focus on enhancing efficacy through improved formulations and targeted delivery mechanisms, with a significant emphasis on reducing environmental impact. Unique selling propositions often center around the environmental friendliness and safety aspects, appealing to environmentally conscious consumers and adhering to stricter regulations.
Key Drivers, Barriers & Challenges in US Biofungicides Industry
Key Drivers:
- Growing consumer preference for organic and sustainably produced crops.
- Increasing awareness of the environmental and human health risks associated with chemical fungicides.
- Stringent government regulations on chemical pesticide usage.
- Technological advancements in biopesticide development and formulation.
Key Barriers and Challenges:
- Relatively higher cost compared to chemical fungicides.
- Efficacy concerns compared to chemical counterparts, requiring higher application rates for comparable results.
- Longer registration and approval processes for new biofungicide products.
- Limited availability of effective biofungicides against certain devastating diseases.
Emerging Opportunities in US Biofungicides Industry
Emerging opportunities exist in developing biofungicides targeting niche market segments such as specialty crops and organic farming. Innovative applications such as using biofungicides in integrated pest management (IPM) strategies present significant potential. The market is expanding into developing biofungicides for specific diseases or crop types, which represents another key growth opportunity.
Growth Accelerators in the US Biofungicides Industry
Long-term growth is propelled by several key factors. Technological breakthroughs in genetic engineering and formulation technologies are crucial for enhancing product efficacy and shelf-life. Strategic partnerships between biopesticide manufacturers and agricultural companies can drive market penetration and adoption. The expansion into international markets, particularly in regions with growing demand for sustainable agriculture, presents significant opportunities for growth.
Key Players Shaping the US Biofungicides Market
- BioWorks Inc
- Novozyme Biologicals
- Isagro USA
- Marrone Bio Innovations
- Valent BioSciences LLC
- Syngenta AG
- De Sangosse Lt
- Certis USA LLC
Notable Milestones in US Biofungicides Industry Sector
- 2020: EPA approves new biofungicide formulation for use on grapes.
- 2021: Marrone Bio Innovations launches new biofungicide targeting a specific fungal disease in wheat.
- 2022: Merger between two smaller biofungicide companies expands product portfolio and market reach.
- 2023: BioWorks Inc. secures a significant investment for expanding production capacity.
- 2024: Valent BioSciences LLC invests heavily in R&D focused on enhanced efficacy of biofungicides.
In-Depth US Biofungicides Industry Market Outlook
The future of the US biofungicides market is promising, with continued growth driven by increasing consumer demand for sustainable agriculture and stricter regulations on chemical fungicides. Strategic investments in R&D, coupled with expansion into new markets and innovative product development, will be pivotal in shaping the market landscape. Opportunities abound for companies focused on developing highly effective, environmentally friendly biofungicide solutions tailored to specific crop needs and disease control. The market is poised for significant growth, creating considerable potential for both established players and new entrants.
US Bio fungicides Industry Segmentation
- 1. Production Analysis
- 2. Consumption Analysis
- 3. Import Market Analysis (Value & Volume)
- 4. Export Market Analysis (Value & Volume)
- 5. Price Trend Analysis
US Bio fungicides Industry Segmentation By Geography
-
1. North America
- 1.1. United States
- 1.2. Canada
- 1.3. Mexico
-
2. South America
- 2.1. Brazil
- 2.2. Argentina
- 2.3. Rest of South America
-
3. Europe
- 3.1. United Kingdom
- 3.2. Germany
- 3.3. France
- 3.4. Italy
- 3.5. Spain
- 3.6. Russia
- 3.7. Benelux
- 3.8. Nordics
- 3.9. Rest of Europe
-
4. Middle East & Africa
- 4.1. Turkey
- 4.2. Israel
- 4.3. GCC
- 4.4. North Africa
- 4.5. South Africa
- 4.6. Rest of Middle East & Africa
-
5. Asia Pacific
- 5.1. China
- 5.2. India
- 5.3. Japan
- 5.4. South Korea
- 5.5. ASEAN
- 5.6. Oceania
- 5.7. Rest of Asia Pacific
US Bio fungicides Industry REPORT HIGHLIGHTS
| Aspects | Details |
|---|---|
| Study Period | 2019-2033 |
| Base Year | 2024 |
| Estimated Year | 2025 |
| Forecast Period | 2025-2033 |
| Historical Period | 2019-2024 |
| Growth Rate | CAGR of 9.50% from 2019-2033 |
| Segmentation |
|
Table of Contents
- 1. Introduction
- 1.1. Research Scope
- 1.2. Market Segmentation
- 1.3. Research Methodology
- 1.4. Definitions and Assumptions
- 2. Executive Summary
- 2.1. Introduction
- 3. Market Dynamics
- 3.1. Introduction
- 3.2. Market Drivers
- 3.2.1. Adoption of Organic and Eco-friendly Farming Practices; Declining Area of Arable Land and Rising Food Security Concerns
- 3.3. Market Restrains
- 3.3.1. High Demand for Conventional and Synthetic Products; Lack of Awareness and Other Factors Limiting the Adoption of Agricultural Inoculants
- 3.4. Market Trends
- 3.4.1. Fruits and Vegetables Fastest Market Growing Segment
- 4. Market Factor Analysis
- 4.1. Porters Five Forces
- 4.2. Supply/Value Chain
- 4.3. PESTEL analysis
- 4.4. Market Entropy
- 4.5. Patent/Trademark Analysis
- 5. Global US Bio fungicides Industry Analysis, Insights and Forecast, 2019-2031
- 5.1. Market Analysis, Insights and Forecast - by Production Analysis
- 5.2. Market Analysis, Insights and Forecast - by Consumption Analysis
- 5.3. Market Analysis, Insights and Forecast - by Import Market Analysis (Value & Volume)
- 5.4. Market Analysis, Insights and Forecast - by Export Market Analysis (Value & Volume)
- 5.5. Market Analysis, Insights and Forecast - by Price Trend Analysis
- 5.6. Market Analysis, Insights and Forecast - by Region
- 5.6.1. North America
- 5.6.2. South America
- 5.6.3. Europe
- 5.6.4. Middle East & Africa
- 5.6.5. Asia Pacific
- 5.1. Market Analysis, Insights and Forecast - by Production Analysis
- 6. North America US Bio fungicides Industry Analysis, Insights and Forecast, 2019-2031
- 6.1. Market Analysis, Insights and Forecast - by Production Analysis
- 6.2. Market Analysis, Insights and Forecast - by Consumption Analysis
- 6.3. Market Analysis, Insights and Forecast - by Import Market Analysis (Value & Volume)
- 6.4. Market Analysis, Insights and Forecast - by Export Market Analysis (Value & Volume)
- 6.5. Market Analysis, Insights and Forecast - by Price Trend Analysis
- 6.1. Market Analysis, Insights and Forecast - by Production Analysis
- 7. South America US Bio fungicides Industry Analysis, Insights and Forecast, 2019-2031
- 7.1. Market Analysis, Insights and Forecast - by Production Analysis
- 7.2. Market Analysis, Insights and Forecast - by Consumption Analysis
- 7.3. Market Analysis, Insights and Forecast - by Import Market Analysis (Value & Volume)
- 7.4. Market Analysis, Insights and Forecast - by Export Market Analysis (Value & Volume)
- 7.5. Market Analysis, Insights and Forecast - by Price Trend Analysis
- 7.1. Market Analysis, Insights and Forecast - by Production Analysis
- 8. Europe US Bio fungicides Industry Analysis, Insights and Forecast, 2019-2031
- 8.1. Market Analysis, Insights and Forecast - by Production Analysis
- 8.2. Market Analysis, Insights and Forecast - by Consumption Analysis
- 8.3. Market Analysis, Insights and Forecast - by Import Market Analysis (Value & Volume)
- 8.4. Market Analysis, Insights and Forecast - by Export Market Analysis (Value & Volume)
- 8.5. Market Analysis, Insights and Forecast - by Price Trend Analysis
- 8.1. Market Analysis, Insights and Forecast - by Production Analysis
- 9. Middle East & Africa US Bio fungicides Industry Analysis, Insights and Forecast, 2019-2031
- 9.1. Market Analysis, Insights and Forecast - by Production Analysis
- 9.2. Market Analysis, Insights and Forecast - by Consumption Analysis
- 9.3. Market Analysis, Insights and Forecast - by Import Market Analysis (Value & Volume)
- 9.4. Market Analysis, Insights and Forecast - by Export Market Analysis (Value & Volume)
- 9.5. Market Analysis, Insights and Forecast - by Price Trend Analysis
- 9.1. Market Analysis, Insights and Forecast - by Production Analysis
- 10. Asia Pacific US Bio fungicides Industry Analysis, Insights and Forecast, 2019-2031
- 10.1. Market Analysis, Insights and Forecast - by Production Analysis
- 10.2. Market Analysis, Insights and Forecast - by Consumption Analysis
- 10.3. Market Analysis, Insights and Forecast - by Import Market Analysis (Value & Volume)
- 10.4. Market Analysis, Insights and Forecast - by Export Market Analysis (Value & Volume)
- 10.5. Market Analysis, Insights and Forecast - by Price Trend Analysis
- 10.1. Market Analysis, Insights and Forecast - by Production Analysis
- 11. Northeast US Bio fungicides Industry Analysis, Insights and Forecast, 2019-2031
- 12. Southeast US Bio fungicides Industry Analysis, Insights and Forecast, 2019-2031
- 13. Midwest US Bio fungicides Industry Analysis, Insights and Forecast, 2019-2031
- 14. Southwest US Bio fungicides Industry Analysis, Insights and Forecast, 2019-2031
- 15. West US Bio fungicides Industry Analysis, Insights and Forecast, 2019-2031
- 16. Competitive Analysis
- 16.1. Global Market Share Analysis 2024
- 16.2. Company Profiles
- 16.2.1 BioWorks Inc
- 16.2.1.1. Overview
- 16.2.1.2. Products
- 16.2.1.3. SWOT Analysis
- 16.2.1.4. Recent Developments
- 16.2.1.5. Financials (Based on Availability)
- 16.2.2 Novozyme Biologicals
- 16.2.2.1. Overview
- 16.2.2.2. Products
- 16.2.2.3. SWOT Analysis
- 16.2.2.4. Recent Developments
- 16.2.2.5. Financials (Based on Availability)
- 16.2.3 Isagro USA
- 16.2.3.1. Overview
- 16.2.3.2. Products
- 16.2.3.3. SWOT Analysis
- 16.2.3.4. Recent Developments
- 16.2.3.5. Financials (Based on Availability)
- 16.2.4 Marrone Bio Innovations
- 16.2.4.1. Overview
- 16.2.4.2. Products
- 16.2.4.3. SWOT Analysis
- 16.2.4.4. Recent Developments
- 16.2.4.5. Financials (Based on Availability)
- 16.2.5 Valent BioSciences LLC
- 16.2.5.1. Overview
- 16.2.5.2. Products
- 16.2.5.3. SWOT Analysis
- 16.2.5.4. Recent Developments
- 16.2.5.5. Financials (Based on Availability)
- 16.2.6 Syngenta AG
- 16.2.6.1. Overview
- 16.2.6.2. Products
- 16.2.6.3. SWOT Analysis
- 16.2.6.4. Recent Developments
- 16.2.6.5. Financials (Based on Availability)
- 16.2.7 De Sangosse Lt
- 16.2.7.1. Overview
- 16.2.7.2. Products
- 16.2.7.3. SWOT Analysis
- 16.2.7.4. Recent Developments
- 16.2.7.5. Financials (Based on Availability)
- 16.2.8 Certis USA LLC
- 16.2.8.1. Overview
- 16.2.8.2. Products
- 16.2.8.3. SWOT Analysis
- 16.2.8.4. Recent Developments
- 16.2.8.5. Financials (Based on Availability)
- 16.2.1 BioWorks Inc
List of Figures
- Figure 1: Global US Bio fungicides Industry Revenue Breakdown (Million, %) by Region 2024 & 2032
- Figure 2: United states US Bio fungicides Industry Revenue (Million), by Country 2024 & 2032
- Figure 3: United states US Bio fungicides Industry Revenue Share (%), by Country 2024 & 2032
- Figure 4: North America US Bio fungicides Industry Revenue (Million), by Production Analysis 2024 & 2032
- Figure 5: North America US Bio fungicides Industry Revenue Share (%), by Production Analysis 2024 & 2032
- Figure 6: North America US Bio fungicides Industry Revenue (Million), by Consumption Analysis 2024 & 2032
- Figure 7: North America US Bio fungicides Industry Revenue Share (%), by Consumption Analysis 2024 & 2032
- Figure 8: North America US Bio fungicides Industry Revenue (Million), by Import Market Analysis (Value & Volume) 2024 & 2032
- Figure 9: North America US Bio fungicides Industry Revenue Share (%), by Import Market Analysis (Value & Volume) 2024 & 2032
- Figure 10: North America US Bio fungicides Industry Revenue (Million), by Export Market Analysis (Value & Volume) 2024 & 2032
- Figure 11: North America US Bio fungicides Industry Revenue Share (%), by Export Market Analysis (Value & Volume) 2024 & 2032
- Figure 12: North America US Bio fungicides Industry Revenue (Million), by Price Trend Analysis 2024 & 2032
- Figure 13: North America US Bio fungicides Industry Revenue Share (%), by Price Trend Analysis 2024 & 2032
- Figure 14: North America US Bio fungicides Industry Revenue (Million), by Country 2024 & 2032
- Figure 15: North America US Bio fungicides Industry Revenue Share (%), by Country 2024 & 2032
- Figure 16: South America US Bio fungicides Industry Revenue (Million), by Production Analysis 2024 & 2032
- Figure 17: South America US Bio fungicides Industry Revenue Share (%), by Production Analysis 2024 & 2032
- Figure 18: South America US Bio fungicides Industry Revenue (Million), by Consumption Analysis 2024 & 2032
- Figure 19: South America US Bio fungicides Industry Revenue Share (%), by Consumption Analysis 2024 & 2032
- Figure 20: South America US Bio fungicides Industry Revenue (Million), by Import Market Analysis (Value & Volume) 2024 & 2032
- Figure 21: South America US Bio fungicides Industry Revenue Share (%), by Import Market Analysis (Value & Volume) 2024 & 2032
- Figure 22: South America US Bio fungicides Industry Revenue (Million), by Export Market Analysis (Value & Volume) 2024 & 2032
- Figure 23: South America US Bio fungicides Industry Revenue Share (%), by Export Market Analysis (Value & Volume) 2024 & 2032
- Figure 24: South America US Bio fungicides Industry Revenue (Million), by Price Trend Analysis 2024 & 2032
- Figure 25: South America US Bio fungicides Industry Revenue Share (%), by Price Trend Analysis 2024 & 2032
- Figure 26: South America US Bio fungicides Industry Revenue (Million), by Country 2024 & 2032
- Figure 27: South America US Bio fungicides Industry Revenue Share (%), by Country 2024 & 2032
- Figure 28: Europe US Bio fungicides Industry Revenue (Million), by Production Analysis 2024 & 2032
- Figure 29: Europe US Bio fungicides Industry Revenue Share (%), by Production Analysis 2024 & 2032
- Figure 30: Europe US Bio fungicides Industry Revenue (Million), by Consumption Analysis 2024 & 2032
- Figure 31: Europe US Bio fungicides Industry Revenue Share (%), by Consumption Analysis 2024 & 2032
- Figure 32: Europe US Bio fungicides Industry Revenue (Million), by Import Market Analysis (Value & Volume) 2024 & 2032
- Figure 33: Europe US Bio fungicides Industry Revenue Share (%), by Import Market Analysis (Value & Volume) 2024 & 2032
- Figure 34: Europe US Bio fungicides Industry Revenue (Million), by Export Market Analysis (Value & Volume) 2024 & 2032
- Figure 35: Europe US Bio fungicides Industry Revenue Share (%), by Export Market Analysis (Value & Volume) 2024 & 2032
- Figure 36: Europe US Bio fungicides Industry Revenue (Million), by Price Trend Analysis 2024 & 2032
- Figure 37: Europe US Bio fungicides Industry Revenue Share (%), by Price Trend Analysis 2024 & 2032
- Figure 38: Europe US Bio fungicides Industry Revenue (Million), by Country 2024 & 2032
- Figure 39: Europe US Bio fungicides Industry Revenue Share (%), by Country 2024 & 2032
- Figure 40: Middle East & Africa US Bio fungicides Industry Revenue (Million), by Production Analysis 2024 & 2032
- Figure 41: Middle East & Africa US Bio fungicides Industry Revenue Share (%), by Production Analysis 2024 & 2032
- Figure 42: Middle East & Africa US Bio fungicides Industry Revenue (Million), by Consumption Analysis 2024 & 2032
- Figure 43: Middle East & Africa US Bio fungicides Industry Revenue Share (%), by Consumption Analysis 2024 & 2032
- Figure 44: Middle East & Africa US Bio fungicides Industry Revenue (Million), by Import Market Analysis (Value & Volume) 2024 & 2032
- Figure 45: Middle East & Africa US Bio fungicides Industry Revenue Share (%), by Import Market Analysis (Value & Volume) 2024 & 2032
- Figure 46: Middle East & Africa US Bio fungicides Industry Revenue (Million), by Export Market Analysis (Value & Volume) 2024 & 2032
- Figure 47: Middle East & Africa US Bio fungicides Industry Revenue Share (%), by Export Market Analysis (Value & Volume) 2024 & 2032
- Figure 48: Middle East & Africa US Bio fungicides Industry Revenue (Million), by Price Trend Analysis 2024 & 2032
- Figure 49: Middle East & Africa US Bio fungicides Industry Revenue Share (%), by Price Trend Analysis 2024 & 2032
- Figure 50: Middle East & Africa US Bio fungicides Industry Revenue (Million), by Country 2024 & 2032
- Figure 51: Middle East & Africa US Bio fungicides Industry Revenue Share (%), by Country 2024 & 2032
- Figure 52: Asia Pacific US Bio fungicides Industry Revenue (Million), by Production Analysis 2024 & 2032
- Figure 53: Asia Pacific US Bio fungicides Industry Revenue Share (%), by Production Analysis 2024 & 2032
- Figure 54: Asia Pacific US Bio fungicides Industry Revenue (Million), by Consumption Analysis 2024 & 2032
- Figure 55: Asia Pacific US Bio fungicides Industry Revenue Share (%), by Consumption Analysis 2024 & 2032
- Figure 56: Asia Pacific US Bio fungicides Industry Revenue (Million), by Import Market Analysis (Value & Volume) 2024 & 2032
- Figure 57: Asia Pacific US Bio fungicides Industry Revenue Share (%), by Import Market Analysis (Value & Volume) 2024 & 2032
- Figure 58: Asia Pacific US Bio fungicides Industry Revenue (Million), by Export Market Analysis (Value & Volume) 2024 & 2032
- Figure 59: Asia Pacific US Bio fungicides Industry Revenue Share (%), by Export Market Analysis (Value & Volume) 2024 & 2032
- Figure 60: Asia Pacific US Bio fungicides Industry Revenue (Million), by Price Trend Analysis 2024 & 2032
- Figure 61: Asia Pacific US Bio fungicides Industry Revenue Share (%), by Price Trend Analysis 2024 & 2032
- Figure 62: Asia Pacific US Bio fungicides Industry Revenue (Million), by Country 2024 & 2032
- Figure 63: Asia Pacific US Bio fungicides Industry Revenue Share (%), by Country 2024 & 2032
List of Tables
- Table 1: Global US Bio fungicides Industry Revenue Million Forecast, by Region 2019 & 2032
- Table 2: Global US Bio fungicides Industry Revenue Million Forecast, by Production Analysis 2019 & 2032
- Table 3: Global US Bio fungicides Industry Revenue Million Forecast, by Consumption Analysis 2019 & 2032
- Table 4: Global US Bio fungicides Industry Revenue Million Forecast, by Import Market Analysis (Value & Volume) 2019 & 2032
- Table 5: Global US Bio fungicides Industry Revenue Million Forecast, by Export Market Analysis (Value & Volume) 2019 & 2032
- Table 6: Global US Bio fungicides Industry Revenue Million Forecast, by Price Trend Analysis 2019 & 2032
- Table 7: Global US Bio fungicides Industry Revenue Million Forecast, by Region 2019 & 2032
- Table 8: Global US Bio fungicides Industry Revenue Million Forecast, by Country 2019 & 2032
- Table 9: Northeast US Bio fungicides Industry Revenue (Million) Forecast, by Application 2019 & 2032
- Table 10: Southeast US Bio fungicides Industry Revenue (Million) Forecast, by Application 2019 & 2032
- Table 11: Midwest US Bio fungicides Industry Revenue (Million) Forecast, by Application 2019 & 2032
- Table 12: Southwest US Bio fungicides Industry Revenue (Million) Forecast, by Application 2019 & 2032
- Table 13: West US Bio fungicides Industry Revenue (Million) Forecast, by Application 2019 & 2032
- Table 14: Global US Bio fungicides Industry Revenue Million Forecast, by Production Analysis 2019 & 2032
- Table 15: Global US Bio fungicides Industry Revenue Million Forecast, by Consumption Analysis 2019 & 2032
- Table 16: Global US Bio fungicides Industry Revenue Million Forecast, by Import Market Analysis (Value & Volume) 2019 & 2032
- Table 17: Global US Bio fungicides Industry Revenue Million Forecast, by Export Market Analysis (Value & Volume) 2019 & 2032
- Table 18: Global US Bio fungicides Industry Revenue Million Forecast, by Price Trend Analysis 2019 & 2032
- Table 19: Global US Bio fungicides Industry Revenue Million Forecast, by Country 2019 & 2032
- Table 20: United States US Bio fungicides Industry Revenue (Million) Forecast, by Application 2019 & 2032
- Table 21: Canada US Bio fungicides Industry Revenue (Million) Forecast, by Application 2019 & 2032
- Table 22: Mexico US Bio fungicides Industry Revenue (Million) Forecast, by Application 2019 & 2032
- Table 23: Global US Bio fungicides Industry Revenue Million Forecast, by Production Analysis 2019 & 2032
- Table 24: Global US Bio fungicides Industry Revenue Million Forecast, by Consumption Analysis 2019 & 2032
- Table 25: Global US Bio fungicides Industry Revenue Million Forecast, by Import Market Analysis (Value & Volume) 2019 & 2032
- Table 26: Global US Bio fungicides Industry Revenue Million Forecast, by Export Market Analysis (Value & Volume) 2019 & 2032
- Table 27: Global US Bio fungicides Industry Revenue Million Forecast, by Price Trend Analysis 2019 & 2032
- Table 28: Global US Bio fungicides Industry Revenue Million Forecast, by Country 2019 & 2032
- Table 29: Brazil US Bio fungicides Industry Revenue (Million) Forecast, by Application 2019 & 2032
- Table 30: Argentina US Bio fungicides Industry Revenue (Million) Forecast, by Application 2019 & 2032
- Table 31: Rest of South America US Bio fungicides Industry Revenue (Million) Forecast, by Application 2019 & 2032
- Table 32: Global US Bio fungicides Industry Revenue Million Forecast, by Production Analysis 2019 & 2032
- Table 33: Global US Bio fungicides Industry Revenue Million Forecast, by Consumption Analysis 2019 & 2032
- Table 34: Global US Bio fungicides Industry Revenue Million Forecast, by Import Market Analysis (Value & Volume) 2019 & 2032
- Table 35: Global US Bio fungicides Industry Revenue Million Forecast, by Export Market Analysis (Value & Volume) 2019 & 2032
- Table 36: Global US Bio fungicides Industry Revenue Million Forecast, by Price Trend Analysis 2019 & 2032
- Table 37: Global US Bio fungicides Industry Revenue Million Forecast, by Country 2019 & 2032
- Table 38: United Kingdom US Bio fungicides Industry Revenue (Million) Forecast, by Application 2019 & 2032
- Table 39: Germany US Bio fungicides Industry Revenue (Million) Forecast, by Application 2019 & 2032
- Table 40: France US Bio fungicides Industry Revenue (Million) Forecast, by Application 2019 & 2032
- Table 41: Italy US Bio fungicides Industry Revenue (Million) Forecast, by Application 2019 & 2032
- Table 42: Spain US Bio fungicides Industry Revenue (Million) Forecast, by Application 2019 & 2032
- Table 43: Russia US Bio fungicides Industry Revenue (Million) Forecast, by Application 2019 & 2032
- Table 44: Benelux US Bio fungicides Industry Revenue (Million) Forecast, by Application 2019 & 2032
- Table 45: Nordics US Bio fungicides Industry Revenue (Million) Forecast, by Application 2019 & 2032
- Table 46: Rest of Europe US Bio fungicides Industry Revenue (Million) Forecast, by Application 2019 & 2032
- Table 47: Global US Bio fungicides Industry Revenue Million Forecast, by Production Analysis 2019 & 2032
- Table 48: Global US Bio fungicides Industry Revenue Million Forecast, by Consumption Analysis 2019 & 2032
- Table 49: Global US Bio fungicides Industry Revenue Million Forecast, by Import Market Analysis (Value & Volume) 2019 & 2032
- Table 50: Global US Bio fungicides Industry Revenue Million Forecast, by Export Market Analysis (Value & Volume) 2019 & 2032
- Table 51: Global US Bio fungicides Industry Revenue Million Forecast, by Price Trend Analysis 2019 & 2032
- Table 52: Global US Bio fungicides Industry Revenue Million Forecast, by Country 2019 & 2032
- Table 53: Turkey US Bio fungicides Industry Revenue (Million) Forecast, by Application 2019 & 2032
- Table 54: Israel US Bio fungicides Industry Revenue (Million) Forecast, by Application 2019 & 2032
- Table 55: GCC US Bio fungicides Industry Revenue (Million) Forecast, by Application 2019 & 2032
- Table 56: North Africa US Bio fungicides Industry Revenue (Million) Forecast, by Application 2019 & 2032
- Table 57: South Africa US Bio fungicides Industry Revenue (Million) Forecast, by Application 2019 & 2032
- Table 58: Rest of Middle East & Africa US Bio fungicides Industry Revenue (Million) Forecast, by Application 2019 & 2032
- Table 59: Global US Bio fungicides Industry Revenue Million Forecast, by Production Analysis 2019 & 2032
- Table 60: Global US Bio fungicides Industry Revenue Million Forecast, by Consumption Analysis 2019 & 2032
- Table 61: Global US Bio fungicides Industry Revenue Million Forecast, by Import Market Analysis (Value & Volume) 2019 & 2032
- Table 62: Global US Bio fungicides Industry Revenue Million Forecast, by Export Market Analysis (Value & Volume) 2019 & 2032
- Table 63: Global US Bio fungicides Industry Revenue Million Forecast, by Price Trend Analysis 2019 & 2032
- Table 64: Global US Bio fungicides Industry Revenue Million Forecast, by Country 2019 & 2032
- Table 65: China US Bio fungicides Industry Revenue (Million) Forecast, by Application 2019 & 2032
- Table 66: India US Bio fungicides Industry Revenue (Million) Forecast, by Application 2019 & 2032
- Table 67: Japan US Bio fungicides Industry Revenue (Million) Forecast, by Application 2019 & 2032
- Table 68: South Korea US Bio fungicides Industry Revenue (Million) Forecast, by Application 2019 & 2032
- Table 69: ASEAN US Bio fungicides Industry Revenue (Million) Forecast, by Application 2019 & 2032
- Table 70: Oceania US Bio fungicides Industry Revenue (Million) Forecast, by Application 2019 & 2032
- Table 71: Rest of Asia Pacific US Bio fungicides Industry Revenue (Million) Forecast, by Application 2019 & 2032
Frequently Asked Questions
1. What is the projected Compound Annual Growth Rate (CAGR) of the US Bio fungicides Industry?
The projected CAGR is approximately 9.50%.
2. Which companies are prominent players in the US Bio fungicides Industry?
Key companies in the market include BioWorks Inc, Novozyme Biologicals, Isagro USA, Marrone Bio Innovations, Valent BioSciences LLC, Syngenta AG, De Sangosse Lt, Certis USA LLC.
3. What are the main segments of the US Bio fungicides Industry?
The market segments include Production Analysis, Consumption Analysis, Import Market Analysis (Value & Volume), Export Market Analysis (Value & Volume), Price Trend Analysis.
4. Can you provide details about the market size?
The market size is estimated to be USD 0.96 Million as of 2022.
5. What are some drivers contributing to market growth?
Adoption of Organic and Eco-friendly Farming Practices; Declining Area of Arable Land and Rising Food Security Concerns.
6. What are the notable trends driving market growth?
Fruits and Vegetables Fastest Market Growing Segment.
7. Are there any restraints impacting market growth?
High Demand for Conventional and Synthetic Products; Lack of Awareness and Other Factors Limiting the Adoption of Agricultural Inoculants.
8. Can you provide examples of recent developments in the market?
N/A
9. What pricing options are available for accessing the report?
Pricing options include single-user, multi-user, and enterprise licenses priced at USD 3800, USD 4500, and USD 5800 respectively.
10. Is the market size provided in terms of value or volume?
The market size is provided in terms of value, measured in Million.
11. Are there any specific market keywords associated with the report?
Yes, the market keyword associated with the report is "US Bio fungicides Industry," which aids in identifying and referencing the specific market segment covered.
12. How do I determine which pricing option suits my needs best?
The pricing options vary based on user requirements and access needs. Individual users may opt for single-user licenses, while businesses requiring broader access may choose multi-user or enterprise licenses for cost-effective access to the report.
13. Are there any additional resources or data provided in the US Bio fungicides Industry report?
While the report offers comprehensive insights, it's advisable to review the specific contents or supplementary materials provided to ascertain if additional resources or data are available.
14. How can I stay updated on further developments or reports in the US Bio fungicides Industry?
To stay informed about further developments, trends, and reports in the US Bio fungicides Industry, consider subscribing to industry newsletters, following relevant companies and organizations, or regularly checking reputable industry news sources and publications.
Methodology
Step 1 - Identification of Relevant Samples Size from Population Database


Step 2 - Approaches for Defining Global Market Size (Value, Volume* & Price*)

Note*: In applicable scenarios
Step 3 - Data Sources
Primary Research
- Web Analytics
- Survey Reports
- Research Institute
- Latest Research Reports
- Opinion Leaders
Secondary Research
- Annual Reports
- White Paper
- Latest Press Release
- Industry Association
- Paid Database
- Investor Presentations

Step 4 - Data Triangulation
Involves using different sources of information in order to increase the validity of a study
These sources are likely to be stakeholders in a program - participants, other researchers, program staff, other community members, and so on.
Then we put all data in single framework & apply various statistical tools to find out the dynamic on the market.
During the analysis stage, feedback from the stakeholder groups would be compared to determine areas of agreement as well as areas of divergence


