

Key Insights
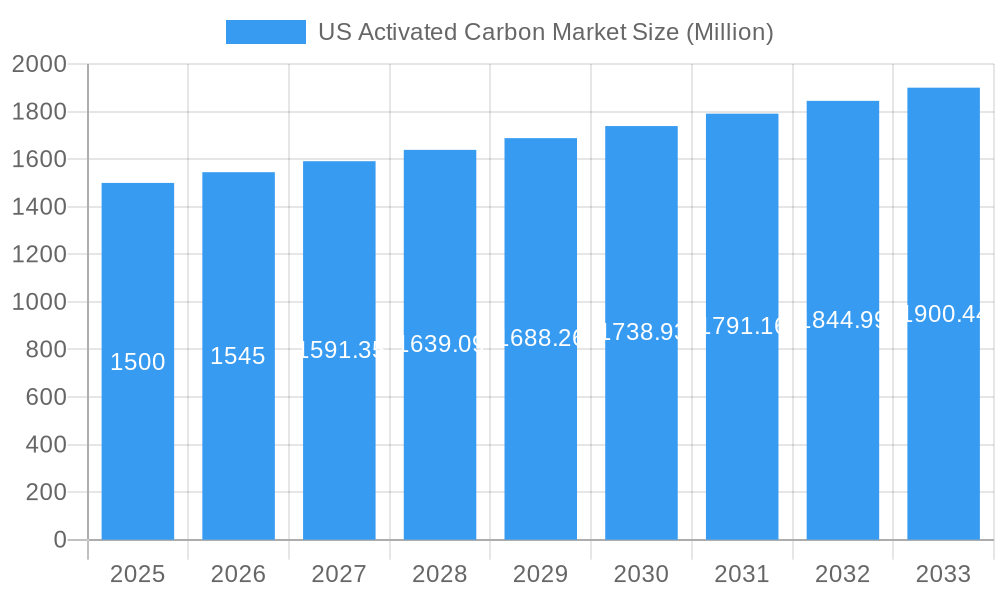
The US activated carbon market, exhibiting a CAGR exceeding 3.00% from 2019 to 2024, is poised for continued growth through 2033. Driven by stringent environmental regulations promoting water and air purification, the market is segmented by product type (powdered, granular, extruded/pelletized), application (gas purification, water purification, metal extraction, medicine), and end-user industry (water treatment, food & beverage, healthcare, automotive, industrial processing). The increasing demand for clean water and air, coupled with growth in industries like healthcare and food & beverage, fuels this expansion. Significant investments in water treatment infrastructure and rising awareness of environmental sustainability further bolster market growth. While fluctuating raw material prices and potential supply chain disruptions present challenges, the long-term outlook remains positive, with innovative applications in emerging sectors, such as energy storage and industrial emissions control, promising further market expansion. Major players like Cabot Corporation, Calgon Carbon Corporation, and Kuraray Co., Ltd. are actively contributing to market growth through technological advancements and strategic expansions. The dominance of established players indicates a moderately consolidated market, but opportunities exist for new entrants with innovative product offerings and strong market penetration strategies, particularly in niche applications.
US Activated Carbon Market Market Size (In Billion)
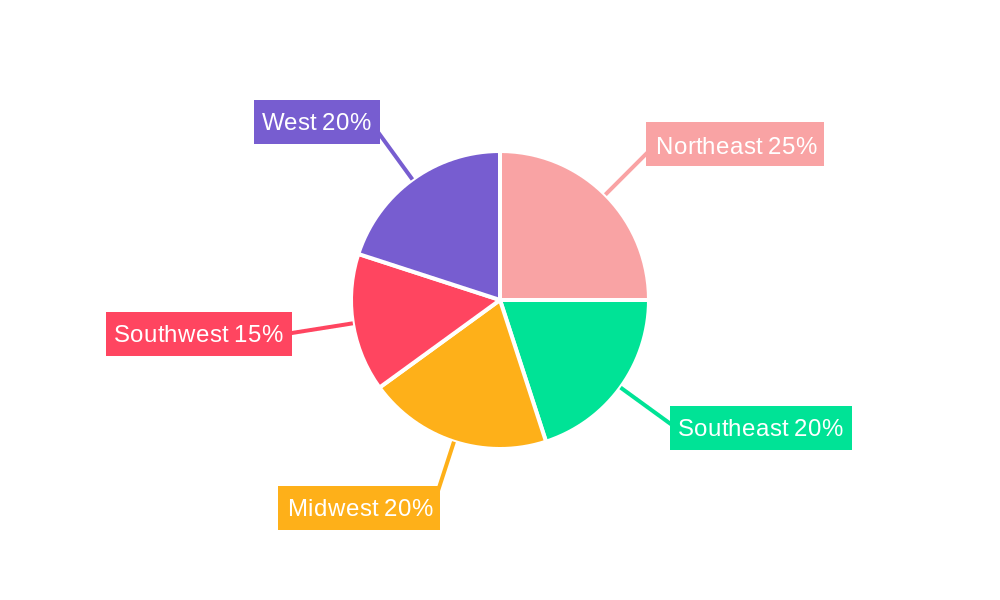
The Northeast and West regions of the US are expected to lead market growth due to higher industrial activity and stringent environmental regulations. The Midwest and Southeast are anticipated to see steady growth, fueled by expanding water treatment infrastructure. The granular activated carbon segment holds a significant market share, primarily due to its wide application in water and wastewater treatment. The water purification application segment is expected to be the largest, driven by the growing demand for clean drinking water and wastewater treatment solutions. Competition is intense, with both established multinational corporations and smaller specialized players vying for market share. The market’s growth trajectory is influenced by factors like government policies promoting sustainable practices, technological innovation in activated carbon production and application, and the increasing awareness among end-users about the benefits of activated carbon.
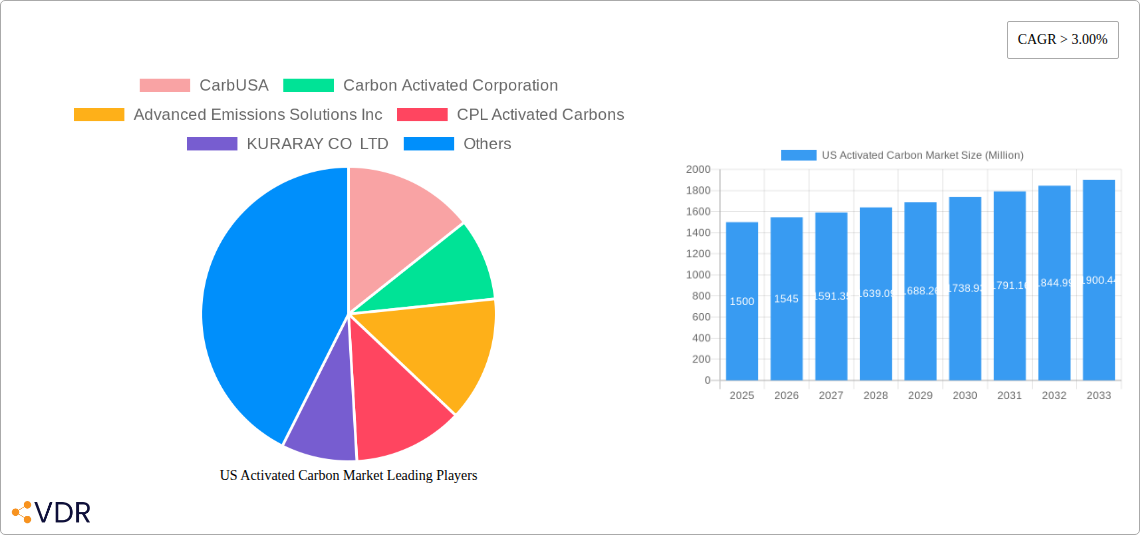
US Activated Carbon Market Company Market Share
US Activated Carbon Market Report: A Comprehensive Analysis (2019-2033)
This comprehensive report provides an in-depth analysis of the US Activated Carbon Market, encompassing market dynamics, growth trends, regional segmentation, product landscape, key players, and future outlook. The report covers the period 2019-2033, with a focus on the forecast period 2025-2033 and a base year of 2025. Market values are presented in millions of units.
US Activated Carbon Market Market Dynamics & Structure
The US activated carbon market is characterized by a moderately concentrated landscape with key players such as CarbUSA, Carbon Activated Corporation, Advanced Emissions Solutions Inc, CPL Activated Carbons, KURARAY CO LTD, JACOBI CARBONS GROUP, Evoqua Water Technologies LLC, Cabot Corporation, Prominent Systems Inc, Calgon Carbon Corporation, Ingevity, KUREHA CORPORATION, Veolia, Donau Chemie AG, Albemarle Corporation, and PURAGEN ACTIVATED CARBONS competing for market share. The market structure is influenced by technological advancements, stringent environmental regulations, and the increasing demand across various applications.
- Market Concentration: The market exhibits moderate concentration, with the top 5 players holding approximately xx% of the market share in 2025.
- Technological Innovation: Continuous innovation in activated carbon production methods, focusing on enhanced adsorption capacity and cost-effectiveness, is a key driver.
- Regulatory Framework: Stringent environmental regulations regarding water and air pollution are driving demand for activated carbon-based solutions.
- Competitive Substitutes: Alternative technologies, such as membrane filtration and ion exchange, pose competitive pressure but activated carbon remains highly favored due to its cost-effectiveness and high adsorption capacity.
- End-User Demographics: The market is driven by a diverse range of end-user industries, including water treatment, food & beverage, healthcare, and industrial processing.
- M&A Trends: The past five years have witnessed xx M&A deals in the US activated carbon market, primarily driven by strategic expansions and technological acquisitions.
US Activated Carbon Market Growth Trends & Insights
The US activated carbon market is experiencing robust growth, driven by increasing industrialization, stringent environmental regulations, and rising demand from various end-user industries. The market size reached xx million units in 2025 and is projected to grow at a CAGR of xx% during the forecast period (2025-2033), reaching xx million units by 2033. This growth is fueled by factors such as rising awareness regarding water and air pollution, increasing adoption of activated carbon in various applications, and technological advancements resulting in improved product performance and efficiency. Market penetration in key segments like water purification and gas purification continues to increase, driven by favorable economic conditions and supportive government policies. Technological disruptions in the form of novel production techniques and enhanced materials are further boosting market growth. Shifting consumer preferences toward environmentally friendly solutions are also playing a vital role in market expansion.
Dominant Regions, Countries, or Segments in US Activated Carbon Market
The water treatment end-user industry dominates the US activated carbon market, accounting for xx% of the total market share in 2025, followed by the industrial processing sector at xx%. Among product types, granular activated carbon (GAC) holds the largest market share, owing to its wide applicability and cost-effectiveness. Geographically, the West Coast region demonstrates the fastest growth rate due to substantial investments in water infrastructure and industrial expansions.
Key Drivers:
- Stringent EPA regulations on water and air quality.
- Growing industrialization and urbanization.
- Investments in water and wastewater treatment infrastructure.
- Rising awareness regarding environmental sustainability.
Dominance Factors:
- High demand from water treatment plants and industrial facilities.
- Cost-effectiveness and high adsorption capacity of activated carbon.
- Technological advancements leading to superior product performance.
US Activated Carbon Market Product Landscape
The US activated carbon market offers a wide range of products, including powdered activated carbon (PAC), granular activated carbon (GAC), and extruded or pelletized activated carbon. Recent innovations focus on enhanced surface area, pore size distribution, and adsorption capacity to improve overall performance in various applications. Unique selling propositions include customized solutions tailored to specific applications, cost-effectiveness, and environmentally friendly production processes. Technological advancements are focused on the development of sustainable and efficient production methods, as well as innovative applications, such as in energy storage and air purification.
Key Drivers, Barriers & Challenges in US Activated Carbon Market
Key Drivers: The increasing demand for clean water and air, driven by stringent environmental regulations and rising awareness of pollution, is a major driver. Technological advancements leading to enhanced product performance and cost-effectiveness further propel market growth. Government initiatives and incentives promoting sustainable solutions also play a significant role.
Key Challenges: Fluctuations in raw material prices, the potential for substitute technologies, and the complexities involved in managing supply chains are major challenges. Regulatory hurdles and stringent environmental standards present further complexities. Intense competition from established and new players also puts pressure on profit margins.
Emerging Opportunities in US Activated Carbon Market
Emerging opportunities lie in innovative applications, such as advanced water purification technologies, air pollution control in emerging economies, and the development of activated carbon composites for energy storage. Untapped markets in developing countries, particularly in Asia and Africa, also represent significant growth potential. The growing focus on sustainability and environmentally friendly solutions creates opportunities for activated carbon manufacturers to showcase their contributions to a cleaner environment.
Growth Accelerators in the US Activated Carbon Market Industry
Strategic partnerships between activated carbon manufacturers and end-user industries are accelerating market growth. Technological breakthroughs in material science and production processes are further enhancing product quality and efficiency. Market expansion strategies, such as geographic diversification and product diversification, also contribute to long-term growth.
Key Players Shaping the US Activated Carbon Market Market
- CarbUSA
- Carbon Activated Corporation
- Advanced Emissions Solutions Inc
- CPL Activated Carbons
- KURARAY CO LTD
- JACOBI CARBONS GROUP
- Evoqua Water Technologies LLC
- Cabot Corporation
- Prominent Systems Inc
- Calgon Carbon Corporation
- Ingevity
- KUREHA CORPORATION
- Veolia
- Donau Chemie AG
- Albemarle Corporation
- PURAGEN ACTIVATED CARBONS
Notable Milestones in US Activated Carbon Market Sector
- 2021: Introduction of a novel activated carbon production method by Cabot Corporation, significantly reducing production costs.
- 2022: Merger between two major players, resulting in increased market share and expanded product portfolio.
- 2023: Launch of a new high-performance activated carbon for water purification by Kuraray.
- 2024: Significant investment in research and development by Albemarle Corporation focusing on sustainable production techniques.
In-Depth US Activated Carbon Market Market Outlook
The US activated carbon market is poised for substantial growth in the coming years, driven by continued advancements in technology, increasing environmental awareness, and robust demand from diverse end-user industries. Strategic investments in research and development, coupled with strategic partnerships and market expansion initiatives, will further strengthen market growth. The growing focus on sustainability and regulatory compliance will continue to propel demand for high-quality activated carbon solutions, presenting lucrative opportunities for market players.
US Activated Carbon Market Segmentation
-
1. Product Type
- 1.1. Powdered Activated Carbon
- 1.2. Granular Activated Carbon
- 1.3. Extruded or Pelletized Activated Carbon
-
2. Application
- 2.1. Gas Purification
- 2.2. Water Purification
- 2.3. Metal Extraction
- 2.4. Medicine
- 2.5. Other Applications
-
3. End-user Industry
- 3.1. Water Treatment
- 3.2. Food & Beverage
- 3.3. Healthcare
- 3.4. Automotive
- 3.5. Industrial Processing
- 3.6. Other End-user Industries
US Activated Carbon Market Segmentation By Geography
-
1. North America
- 1.1. United States
- 1.2. Canada
- 1.3. Mexico
-
2. South America
- 2.1. Brazil
- 2.2. Argentina
- 2.3. Rest of South America
-
3. Europe
- 3.1. United Kingdom
- 3.2. Germany
- 3.3. France
- 3.4. Italy
- 3.5. Spain
- 3.6. Russia
- 3.7. Benelux
- 3.8. Nordics
- 3.9. Rest of Europe
-
4. Middle East & Africa
- 4.1. Turkey
- 4.2. Israel
- 4.3. GCC
- 4.4. North Africa
- 4.5. South Africa
- 4.6. Rest of Middle East & Africa
-
5. Asia Pacific
- 5.1. China
- 5.2. India
- 5.3. Japan
- 5.4. South Korea
- 5.5. ASEAN
- 5.6. Oceania
- 5.7. Rest of Asia Pacific
US Activated Carbon Market Regional Market Share
Geographic Coverage of US Activated Carbon Market
US Activated Carbon Market REPORT HIGHLIGHTS
| Aspects | Details |
|---|---|
| Study Period | 2020-2034 |
| Base Year | 2025 |
| Estimated Year | 2026 |
| Forecast Period | 2026-2034 |
| Historical Period | 2020-2025 |
| Growth Rate | CAGR of 8.8% from 2020-2034 |
| Segmentation |
|
Table of Contents
- 1. Introduction
- 1.1. Research Scope
- 1.2. Market Segmentation
- 1.3. Research Objective
- 1.4. Definitions and Assumptions
- 2. Executive Summary
- 2.1. Market Snapshot
- 3. Market Dynamics
- 3.1. Market Drivers
- 3.2. Market Restrains
- 3.3. Market Trends
- 3.4. Market Opportunities
- 4. Market Factor Analysis
- 4.1. Porters Five Forces
- 4.1.1. Bargaining Power of Suppliers
- 4.1.2. Bargaining Power of Buyers
- 4.1.3. Threat of New Entrants
- 4.1.4. Threat of Substitutes
- 4.1.5. Competitive Rivalry
- 4.2. PESTEL analysis
- 4.3. BCG Analysis
- 4.3.1. Stars (High Growth, High Market Share)
- 4.3.2. Cash Cows (Low Growth, High Market Share)
- 4.3.3. Question Mark (High Growth, Low Market Share)
- 4.3.4. Dogs (Low Growth, Low Market Share)
- 4.4. Ansoff Matrix Analysis
- 4.5. Supply Chain Analysis
- 4.6. Regulatory Landscape
- 4.7. Current Market Potential and Opportunity Assessment (TAM–SAM–SOM Framework)
- 4.8. VDR Analyst Note
- 4.1. Porters Five Forces
- 5. Market Analysis, Insights and Forecast 2021-2033
- 5.1. Market Analysis, Insights and Forecast - by Product Type
- 5.1.1. Powdered Activated Carbon
- 5.1.2. Granular Activated Carbon
- 5.1.3. Extruded or Pelletized Activated Carbon
- 5.2. Market Analysis, Insights and Forecast - by Application
- 5.2.1. Gas Purification
- 5.2.2. Water Purification
- 5.2.3. Metal Extraction
- 5.2.4. Medicine
- 5.2.5. Other Applications
- 5.3. Market Analysis, Insights and Forecast - by End-user Industry
- 5.3.1. Water Treatment
- 5.3.2. Food & Beverage
- 5.3.3. Healthcare
- 5.3.4. Automotive
- 5.3.5. Industrial Processing
- 5.3.6. Other End-user Industries
- 5.4. Market Analysis, Insights and Forecast - by Region
- 5.4.1. North America
- 5.4.2. South America
- 5.4.3. Europe
- 5.4.4. Middle East & Africa
- 5.4.5. Asia Pacific
- 5.1. Market Analysis, Insights and Forecast - by Product Type
- 6. Global US Activated Carbon Market Analysis, Insights and Forecast, 2021-2033
- 6.1. Market Analysis, Insights and Forecast - by Product Type
- 6.1.1. Powdered Activated Carbon
- 6.1.2. Granular Activated Carbon
- 6.1.3. Extruded or Pelletized Activated Carbon
- 6.2. Market Analysis, Insights and Forecast - by Application
- 6.2.1. Gas Purification
- 6.2.2. Water Purification
- 6.2.3. Metal Extraction
- 6.2.4. Medicine
- 6.2.5. Other Applications
- 6.3. Market Analysis, Insights and Forecast - by End-user Industry
- 6.3.1. Water Treatment
- 6.3.2. Food & Beverage
- 6.3.3. Healthcare
- 6.3.4. Automotive
- 6.3.5. Industrial Processing
- 6.3.6. Other End-user Industries
- 6.1. Market Analysis, Insights and Forecast - by Product Type
- 7. North America US Activated Carbon Market Analysis, Insights and Forecast, 2021-2033
- 7.1. Market Analysis, Insights and Forecast - by Product Type
- 7.1.1. Powdered Activated Carbon
- 7.1.2. Granular Activated Carbon
- 7.1.3. Extruded or Pelletized Activated Carbon
- 7.2. Market Analysis, Insights and Forecast - by Application
- 7.2.1. Gas Purification
- 7.2.2. Water Purification
- 7.2.3. Metal Extraction
- 7.2.4. Medicine
- 7.2.5. Other Applications
- 7.3. Market Analysis, Insights and Forecast - by End-user Industry
- 7.3.1. Water Treatment
- 7.3.2. Food & Beverage
- 7.3.3. Healthcare
- 7.3.4. Automotive
- 7.3.5. Industrial Processing
- 7.3.6. Other End-user Industries
- 7.1. Market Analysis, Insights and Forecast - by Product Type
- 8. South America US Activated Carbon Market Analysis, Insights and Forecast, 2021-2033
- 8.1. Market Analysis, Insights and Forecast - by Product Type
- 8.1.1. Powdered Activated Carbon
- 8.1.2. Granular Activated Carbon
- 8.1.3. Extruded or Pelletized Activated Carbon
- 8.2. Market Analysis, Insights and Forecast - by Application
- 8.2.1. Gas Purification
- 8.2.2. Water Purification
- 8.2.3. Metal Extraction
- 8.2.4. Medicine
- 8.2.5. Other Applications
- 8.3. Market Analysis, Insights and Forecast - by End-user Industry
- 8.3.1. Water Treatment
- 8.3.2. Food & Beverage
- 8.3.3. Healthcare
- 8.3.4. Automotive
- 8.3.5. Industrial Processing
- 8.3.6. Other End-user Industries
- 8.1. Market Analysis, Insights and Forecast - by Product Type
- 9. Europe US Activated Carbon Market Analysis, Insights and Forecast, 2021-2033
- 9.1. Market Analysis, Insights and Forecast - by Product Type
- 9.1.1. Powdered Activated Carbon
- 9.1.2. Granular Activated Carbon
- 9.1.3. Extruded or Pelletized Activated Carbon
- 9.2. Market Analysis, Insights and Forecast - by Application
- 9.2.1. Gas Purification
- 9.2.2. Water Purification
- 9.2.3. Metal Extraction
- 9.2.4. Medicine
- 9.2.5. Other Applications
- 9.3. Market Analysis, Insights and Forecast - by End-user Industry
- 9.3.1. Water Treatment
- 9.3.2. Food & Beverage
- 9.3.3. Healthcare
- 9.3.4. Automotive
- 9.3.5. Industrial Processing
- 9.3.6. Other End-user Industries
- 9.1. Market Analysis, Insights and Forecast - by Product Type
- 10. Middle East & Africa US Activated Carbon Market Analysis, Insights and Forecast, 2021-2033
- 10.1. Market Analysis, Insights and Forecast - by Product Type
- 10.1.1. Powdered Activated Carbon
- 10.1.2. Granular Activated Carbon
- 10.1.3. Extruded or Pelletized Activated Carbon
- 10.2. Market Analysis, Insights and Forecast - by Application
- 10.2.1. Gas Purification
- 10.2.2. Water Purification
- 10.2.3. Metal Extraction
- 10.2.4. Medicine
- 10.2.5. Other Applications
- 10.3. Market Analysis, Insights and Forecast - by End-user Industry
- 10.3.1. Water Treatment
- 10.3.2. Food & Beverage
- 10.3.3. Healthcare
- 10.3.4. Automotive
- 10.3.5. Industrial Processing
- 10.3.6. Other End-user Industries
- 10.1. Market Analysis, Insights and Forecast - by Product Type
- 11. Asia Pacific US Activated Carbon Market Analysis, Insights and Forecast, 2021-2033
- 11.1. Market Analysis, Insights and Forecast - by Product Type
- 11.1.1. Powdered Activated Carbon
- 11.1.2. Granular Activated Carbon
- 11.1.3. Extruded or Pelletized Activated Carbon
- 11.2. Market Analysis, Insights and Forecast - by Application
- 11.2.1. Gas Purification
- 11.2.2. Water Purification
- 11.2.3. Metal Extraction
- 11.2.4. Medicine
- 11.2.5. Other Applications
- 11.3. Market Analysis, Insights and Forecast - by End-user Industry
- 11.3.1. Water Treatment
- 11.3.2. Food & Beverage
- 11.3.3. Healthcare
- 11.3.4. Automotive
- 11.3.5. Industrial Processing
- 11.3.6. Other End-user Industries
- 11.1. Market Analysis, Insights and Forecast - by Product Type
- 12. Competitive Analysis
- 12.1. Company Profiles
- 12.1.1 CarbUSA
- 12.1.1.1. Company Overview
- 12.1.1.2. Products
- 12.1.1.3. Company Financials
- 12.1.1.4. SWOT Analysis
- 12.1.2 Carbon Activated Corporation
- 12.1.2.1. Company Overview
- 12.1.2.2. Products
- 12.1.2.3. Company Financials
- 12.1.2.4. SWOT Analysis
- 12.1.3 Advanced Emissions Solutions Inc
- 12.1.3.1. Company Overview
- 12.1.3.2. Products
- 12.1.3.3. Company Financials
- 12.1.3.4. SWOT Analysis
- 12.1.4 CPL Activated Carbons
- 12.1.4.1. Company Overview
- 12.1.4.2. Products
- 12.1.4.3. Company Financials
- 12.1.4.4. SWOT Analysis
- 12.1.5 KURARAY CO LTD
- 12.1.5.1. Company Overview
- 12.1.5.2. Products
- 12.1.5.3. Company Financials
- 12.1.5.4. SWOT Analysis
- 12.1.6 JACOBI CARBONS GROUP
- 12.1.6.1. Company Overview
- 12.1.6.2. Products
- 12.1.6.3. Company Financials
- 12.1.6.4. SWOT Analysis
- 12.1.7 Evoqua Water Technologies LLC
- 12.1.7.1. Company Overview
- 12.1.7.2. Products
- 12.1.7.3. Company Financials
- 12.1.7.4. SWOT Analysis
- 12.1.8 Cabot Corporation
- 12.1.8.1. Company Overview
- 12.1.8.2. Products
- 12.1.8.3. Company Financials
- 12.1.8.4. SWOT Analysis
- 12.1.9 Prominent Systems Inc
- 12.1.9.1. Company Overview
- 12.1.9.2. Products
- 12.1.9.3. Company Financials
- 12.1.9.4. SWOT Analysis
- 12.1.10 Calgon Carbon Corporation
- 12.1.10.1. Company Overview
- 12.1.10.2. Products
- 12.1.10.3. Company Financials
- 12.1.10.4. SWOT Analysis
- 12.1.11 Ingevity
- 12.1.11.1. Company Overview
- 12.1.11.2. Products
- 12.1.11.3. Company Financials
- 12.1.11.4. SWOT Analysis
- 12.1.12 KUREHA CORPORATION
- 12.1.12.1. Company Overview
- 12.1.12.2. Products
- 12.1.12.3. Company Financials
- 12.1.12.4. SWOT Analysis
- 12.1.13 Veolia*List Not Exhaustive
- 12.1.13.1. Company Overview
- 12.1.13.2. Products
- 12.1.13.3. Company Financials
- 12.1.13.4. SWOT Analysis
- 12.1.14 Donau Chemie AG
- 12.1.14.1. Company Overview
- 12.1.14.2. Products
- 12.1.14.3. Company Financials
- 12.1.14.4. SWOT Analysis
- 12.1.15 Albemarle Corporation
- 12.1.15.1. Company Overview
- 12.1.15.2. Products
- 12.1.15.3. Company Financials
- 12.1.15.4. SWOT Analysis
- 12.1.16 PURAGEN ACTIVATED CARBONS
- 12.1.16.1. Company Overview
- 12.1.16.2. Products
- 12.1.16.3. Company Financials
- 12.1.16.4. SWOT Analysis
- 12.1.1 CarbUSA
- 12.2. Market Entropy
- 12.2.1 Company's Key Areas Served
- 12.2.2 Recent Developments
- 12.3. Company Market Share Analysis 2025
- 12.3.1 Top 5 Companies Market Share Analysis
- 12.3.2 Top 3 Companies Market Share Analysis
- 12.4. List of Potential Customers
- 13. Research Methodology
List of Figures
- Figure 1: Global US Activated Carbon Market Revenue Breakdown (million, %) by Region 2025 & 2033
- Figure 2: North America US Activated Carbon Market Revenue (million), by Product Type 2025 & 2033
- Figure 3: North America US Activated Carbon Market Revenue Share (%), by Product Type 2025 & 2033
- Figure 4: North America US Activated Carbon Market Revenue (million), by Application 2025 & 2033
- Figure 5: North America US Activated Carbon Market Revenue Share (%), by Application 2025 & 2033
- Figure 6: North America US Activated Carbon Market Revenue (million), by End-user Industry 2025 & 2033
- Figure 7: North America US Activated Carbon Market Revenue Share (%), by End-user Industry 2025 & 2033
- Figure 8: North America US Activated Carbon Market Revenue (million), by Country 2025 & 2033
- Figure 9: North America US Activated Carbon Market Revenue Share (%), by Country 2025 & 2033
- Figure 10: South America US Activated Carbon Market Revenue (million), by Product Type 2025 & 2033
- Figure 11: South America US Activated Carbon Market Revenue Share (%), by Product Type 2025 & 2033
- Figure 12: South America US Activated Carbon Market Revenue (million), by Application 2025 & 2033
- Figure 13: South America US Activated Carbon Market Revenue Share (%), by Application 2025 & 2033
- Figure 14: South America US Activated Carbon Market Revenue (million), by End-user Industry 2025 & 2033
- Figure 15: South America US Activated Carbon Market Revenue Share (%), by End-user Industry 2025 & 2033
- Figure 16: South America US Activated Carbon Market Revenue (million), by Country 2025 & 2033
- Figure 17: South America US Activated Carbon Market Revenue Share (%), by Country 2025 & 2033
- Figure 18: Europe US Activated Carbon Market Revenue (million), by Product Type 2025 & 2033
- Figure 19: Europe US Activated Carbon Market Revenue Share (%), by Product Type 2025 & 2033
- Figure 20: Europe US Activated Carbon Market Revenue (million), by Application 2025 & 2033
- Figure 21: Europe US Activated Carbon Market Revenue Share (%), by Application 2025 & 2033
- Figure 22: Europe US Activated Carbon Market Revenue (million), by End-user Industry 2025 & 2033
- Figure 23: Europe US Activated Carbon Market Revenue Share (%), by End-user Industry 2025 & 2033
- Figure 24: Europe US Activated Carbon Market Revenue (million), by Country 2025 & 2033
- Figure 25: Europe US Activated Carbon Market Revenue Share (%), by Country 2025 & 2033
- Figure 26: Middle East & Africa US Activated Carbon Market Revenue (million), by Product Type 2025 & 2033
- Figure 27: Middle East & Africa US Activated Carbon Market Revenue Share (%), by Product Type 2025 & 2033
- Figure 28: Middle East & Africa US Activated Carbon Market Revenue (million), by Application 2025 & 2033
- Figure 29: Middle East & Africa US Activated Carbon Market Revenue Share (%), by Application 2025 & 2033
- Figure 30: Middle East & Africa US Activated Carbon Market Revenue (million), by End-user Industry 2025 & 2033
- Figure 31: Middle East & Africa US Activated Carbon Market Revenue Share (%), by End-user Industry 2025 & 2033
- Figure 32: Middle East & Africa US Activated Carbon Market Revenue (million), by Country 2025 & 2033
- Figure 33: Middle East & Africa US Activated Carbon Market Revenue Share (%), by Country 2025 & 2033
- Figure 34: Asia Pacific US Activated Carbon Market Revenue (million), by Product Type 2025 & 2033
- Figure 35: Asia Pacific US Activated Carbon Market Revenue Share (%), by Product Type 2025 & 2033
- Figure 36: Asia Pacific US Activated Carbon Market Revenue (million), by Application 2025 & 2033
- Figure 37: Asia Pacific US Activated Carbon Market Revenue Share (%), by Application 2025 & 2033
- Figure 38: Asia Pacific US Activated Carbon Market Revenue (million), by End-user Industry 2025 & 2033
- Figure 39: Asia Pacific US Activated Carbon Market Revenue Share (%), by End-user Industry 2025 & 2033
- Figure 40: Asia Pacific US Activated Carbon Market Revenue (million), by Country 2025 & 2033
- Figure 41: Asia Pacific US Activated Carbon Market Revenue Share (%), by Country 2025 & 2033
List of Tables
- Table 1: Global US Activated Carbon Market Revenue million Forecast, by Product Type 2020 & 2033
- Table 2: Global US Activated Carbon Market Revenue million Forecast, by Application 2020 & 2033
- Table 3: Global US Activated Carbon Market Revenue million Forecast, by End-user Industry 2020 & 2033
- Table 4: Global US Activated Carbon Market Revenue million Forecast, by Region 2020 & 2033
- Table 5: Global US Activated Carbon Market Revenue million Forecast, by Product Type 2020 & 2033
- Table 6: Global US Activated Carbon Market Revenue million Forecast, by Application 2020 & 2033
- Table 7: Global US Activated Carbon Market Revenue million Forecast, by End-user Industry 2020 & 2033
- Table 8: Global US Activated Carbon Market Revenue million Forecast, by Country 2020 & 2033
- Table 9: United States US Activated Carbon Market Revenue (million) Forecast, by Application 2020 & 2033
- Table 10: Canada US Activated Carbon Market Revenue (million) Forecast, by Application 2020 & 2033
- Table 11: Mexico US Activated Carbon Market Revenue (million) Forecast, by Application 2020 & 2033
- Table 12: Global US Activated Carbon Market Revenue million Forecast, by Product Type 2020 & 2033
- Table 13: Global US Activated Carbon Market Revenue million Forecast, by Application 2020 & 2033
- Table 14: Global US Activated Carbon Market Revenue million Forecast, by End-user Industry 2020 & 2033
- Table 15: Global US Activated Carbon Market Revenue million Forecast, by Country 2020 & 2033
- Table 16: Brazil US Activated Carbon Market Revenue (million) Forecast, by Application 2020 & 2033
- Table 17: Argentina US Activated Carbon Market Revenue (million) Forecast, by Application 2020 & 2033
- Table 18: Rest of South America US Activated Carbon Market Revenue (million) Forecast, by Application 2020 & 2033
- Table 19: Global US Activated Carbon Market Revenue million Forecast, by Product Type 2020 & 2033
- Table 20: Global US Activated Carbon Market Revenue million Forecast, by Application 2020 & 2033
- Table 21: Global US Activated Carbon Market Revenue million Forecast, by End-user Industry 2020 & 2033
- Table 22: Global US Activated Carbon Market Revenue million Forecast, by Country 2020 & 2033
- Table 23: United Kingdom US Activated Carbon Market Revenue (million) Forecast, by Application 2020 & 2033
- Table 24: Germany US Activated Carbon Market Revenue (million) Forecast, by Application 2020 & 2033
- Table 25: France US Activated Carbon Market Revenue (million) Forecast, by Application 2020 & 2033
- Table 26: Italy US Activated Carbon Market Revenue (million) Forecast, by Application 2020 & 2033
- Table 27: Spain US Activated Carbon Market Revenue (million) Forecast, by Application 2020 & 2033
- Table 28: Russia US Activated Carbon Market Revenue (million) Forecast, by Application 2020 & 2033
- Table 29: Benelux US Activated Carbon Market Revenue (million) Forecast, by Application 2020 & 2033
- Table 30: Nordics US Activated Carbon Market Revenue (million) Forecast, by Application 2020 & 2033
- Table 31: Rest of Europe US Activated Carbon Market Revenue (million) Forecast, by Application 2020 & 2033
- Table 32: Global US Activated Carbon Market Revenue million Forecast, by Product Type 2020 & 2033
- Table 33: Global US Activated Carbon Market Revenue million Forecast, by Application 2020 & 2033
- Table 34: Global US Activated Carbon Market Revenue million Forecast, by End-user Industry 2020 & 2033
- Table 35: Global US Activated Carbon Market Revenue million Forecast, by Country 2020 & 2033
- Table 36: Turkey US Activated Carbon Market Revenue (million) Forecast, by Application 2020 & 2033
- Table 37: Israel US Activated Carbon Market Revenue (million) Forecast, by Application 2020 & 2033
- Table 38: GCC US Activated Carbon Market Revenue (million) Forecast, by Application 2020 & 2033
- Table 39: North Africa US Activated Carbon Market Revenue (million) Forecast, by Application 2020 & 2033
- Table 40: South Africa US Activated Carbon Market Revenue (million) Forecast, by Application 2020 & 2033
- Table 41: Rest of Middle East & Africa US Activated Carbon Market Revenue (million) Forecast, by Application 2020 & 2033
- Table 42: Global US Activated Carbon Market Revenue million Forecast, by Product Type 2020 & 2033
- Table 43: Global US Activated Carbon Market Revenue million Forecast, by Application 2020 & 2033
- Table 44: Global US Activated Carbon Market Revenue million Forecast, by End-user Industry 2020 & 2033
- Table 45: Global US Activated Carbon Market Revenue million Forecast, by Country 2020 & 2033
- Table 46: China US Activated Carbon Market Revenue (million) Forecast, by Application 2020 & 2033
- Table 47: India US Activated Carbon Market Revenue (million) Forecast, by Application 2020 & 2033
- Table 48: Japan US Activated Carbon Market Revenue (million) Forecast, by Application 2020 & 2033
- Table 49: South Korea US Activated Carbon Market Revenue (million) Forecast, by Application 2020 & 2033
- Table 50: ASEAN US Activated Carbon Market Revenue (million) Forecast, by Application 2020 & 2033
- Table 51: Oceania US Activated Carbon Market Revenue (million) Forecast, by Application 2020 & 2033
- Table 52: Rest of Asia Pacific US Activated Carbon Market Revenue (million) Forecast, by Application 2020 & 2033
Frequently Asked Questions
1. What is the projected Compound Annual Growth Rate (CAGR) of the US Activated Carbon Market?
The projected CAGR is approximately 8.8%.
2. Which companies are prominent players in the US Activated Carbon Market?
Key companies in the market include CarbUSA, Carbon Activated Corporation, Advanced Emissions Solutions Inc, CPL Activated Carbons, KURARAY CO LTD, JACOBI CARBONS GROUP, Evoqua Water Technologies LLC, Cabot Corporation, Prominent Systems Inc, Calgon Carbon Corporation, Ingevity, KUREHA CORPORATION, Veolia*List Not Exhaustive, Donau Chemie AG, Albemarle Corporation, PURAGEN ACTIVATED CARBONS.
3. What are the main segments of the US Activated Carbon Market?
The market segments include Product Type, Application, End-user Industry.
4. Can you provide details about the market size?
The market size is estimated to be USD 1214.47 million as of 2022.
5. What are some drivers contributing to market growth?
; Conformance to Stringent Environmental Regulations In Water Treatment Applications; Augmenting Prominence for Air Pollution Control (Especially Mercury Removal).
6. What are the notable trends driving market growth?
Emerging Applications in the Medical and Pharmaceutical Sector.
7. Are there any restraints impacting market growth?
; Narrower Markets Due to Increased Costs of Some Grades of Activated Carbon; Threat of Substitutes Like Silica Gel and Supersand.
8. Can you provide examples of recent developments in the market?
N/A
9. What pricing options are available for accessing the report?
Pricing options include single-user, multi-user, and enterprise licenses priced at USD 3800, USD 4500, and USD 5800 respectively.
10. Is the market size provided in terms of value or volume?
The market size is provided in terms of value, measured in million.
11. Are there any specific market keywords associated with the report?
Yes, the market keyword associated with the report is "US Activated Carbon Market," which aids in identifying and referencing the specific market segment covered.
12. How do I determine which pricing option suits my needs best?
The pricing options vary based on user requirements and access needs. Individual users may opt for single-user licenses, while businesses requiring broader access may choose multi-user or enterprise licenses for cost-effective access to the report.
13. Are there any additional resources or data provided in the US Activated Carbon Market report?
While the report offers comprehensive insights, it's advisable to review the specific contents or supplementary materials provided to ascertain if additional resources or data are available.
14. How can I stay updated on further developments or reports in the US Activated Carbon Market?
To stay informed about further developments, trends, and reports in the US Activated Carbon Market, consider subscribing to industry newsletters, following relevant companies and organizations, or regularly checking reputable industry news sources and publications.
Methodology
Step 1 - Identification of Relevant Samples Size from Population Database


Step 2 - Approaches for Defining Global Market Size (Value, Volume* & Price*)

Note*: In applicable scenarios
Step 3 - Data Sources
Primary Research
- Web Analytics
- Survey Reports
- Research Institute
- Latest Research Reports
- Opinion Leaders
Secondary Research
- Annual Reports
- White Paper
- Latest Press Release
- Industry Association
- Paid Database
- Investor Presentations

Step 4 - Data Triangulation
Involves using different sources of information in order to increase the validity of a study
These sources are likely to be stakeholders in a program - participants, other researchers, program staff, other community members, and so on.
Then we put all data in single framework & apply various statistical tools to find out the dynamic on the market.
During the analysis stage, feedback from the stakeholder groups would be compared to determine areas of agreement as well as areas of divergence