

Key Insights
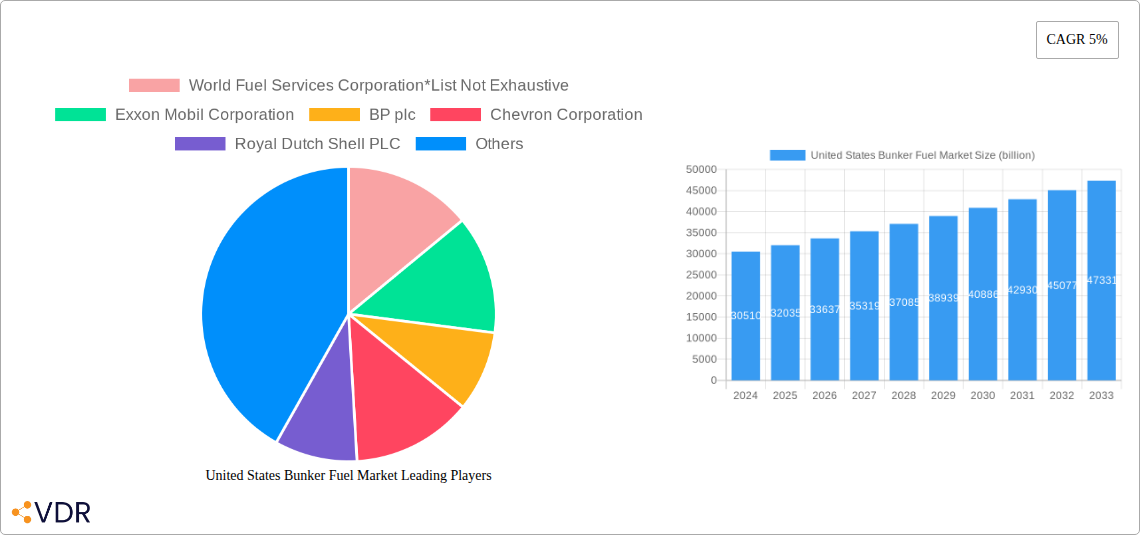
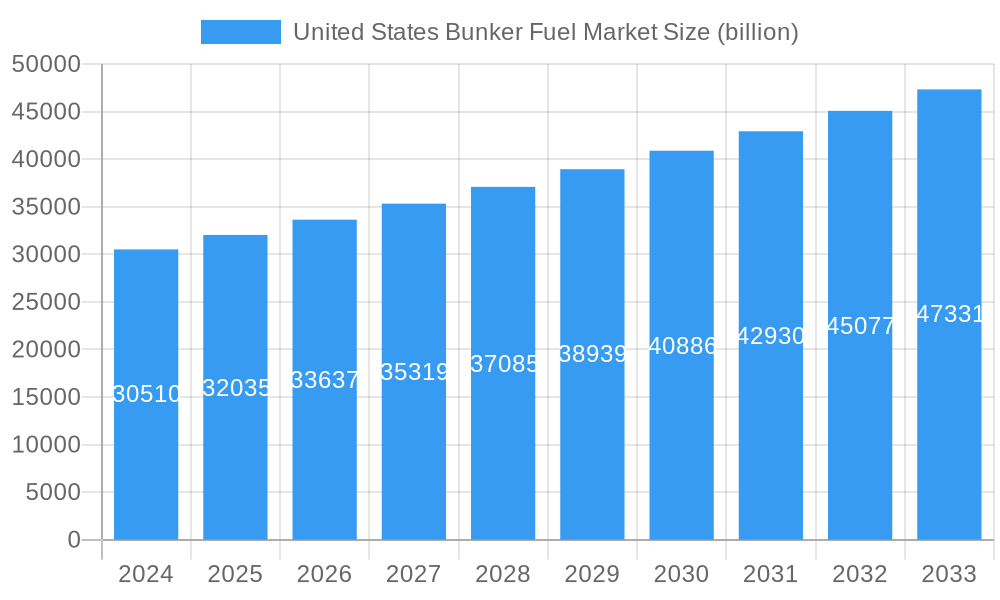
The United States bunker fuel market is projected to reach $30.51 billion in 2024, demonstrating robust growth with a Compound Annual Growth Rate (CAGR) of approximately 5%. This expansion is fueled by several critical drivers, including the increasing demand for maritime transportation of goods, the ongoing need to upgrade and maintain aging vessel fleets, and the strategic imperative for the U.S. to maintain a strong presence in global trade routes. The stringent regulations surrounding emissions are also playing a significant role, pushing for the adoption of cleaner fuel types and more efficient technologies. Key trends shaping the market include the escalating adoption of Liquefied Natural Gas (LNG) as a more environmentally friendly alternative to traditional high-sulfur fuels, alongside advancements in VLSFO and MGO production. The growing complexity of the supply chain and the focus on supply chain resilience further underscore the importance of reliable bunker fuel availability.
United States Bunker Fuel Market Market Size (In Billion)
Despite the positive outlook, certain restraints could temper the market's full potential. Volatility in crude oil prices, which directly impacts bunker fuel costs, presents a significant challenge for both suppliers and end-users. Geopolitical uncertainties and trade disputes can disrupt shipping routes and consequently affect bunker fuel demand. Furthermore, the substantial capital investment required for the development of new bunkering infrastructure, particularly for alternative fuels like LNG, and the ongoing operational costs associated with compliance to evolving environmental regulations, are considerable hurdles. The market segments are diverse, with significant contributions expected from the tanker and container fleet segments, driven by global trade patterns. The United States, as a major economic hub with extensive coastlines and vital waterways, is poised to remain a dominant region for bunker fuel consumption and production.
United States Bunker Fuel Market Company Market Share
United States Bunker Fuel Market: Comprehensive Market Analysis & Future Outlook (2019–2033)
This in-depth report provides a definitive analysis of the United States Bunker Fuel Market, offering critical insights into market dynamics, growth trends, regional dominance, product landscape, key players, and future opportunities. Spanning a study period from 2019 to 2033, with a base and estimated year of 2025, this report is essential for stakeholders seeking to navigate and capitalize on this vital sector of the maritime and energy industries. We present all values in billions of USD, utilizing a base year of 2025 for all current estimations and forecast projections.
United States Bunker Fuel Market Market Dynamics & Structure
The United States bunker fuel market is characterized by a moderately concentrated structure, with several key players vying for market share. Technological innovation is a significant driver, particularly in the development and adoption of low-sulfur fuels and alternative marine fuels like Liquefied Natural Gas (LNG), propelled by stringent IMO 2020 regulations and subsequent environmental mandates. These regulations have reshaped the competitive landscape, favoring fuel types like Very-low Sulfur Fuel Oil (VLSFO) and Marine Gas Oil (MGO) over High Sulfur Fuel Oil (HSFO). End-user demographics are primarily driven by the global shipping industry's reliance on the US coastline for trade and logistics, encompassing Tanker Fleets, Container Fleets, Bulk Carriers, and General Cargo Carriers. Mergers and acquisitions (M&A) have played a role in consolidating market presence, although significant independent players remain.
- Market Concentration: Dominated by a few large integrated oil and gas companies and specialized fuel suppliers, but with room for agile niche players.
- Technological Innovation Drivers: IMO 2020 sulfur cap, increasing demand for cleaner fuels, advancements in LNG bunkering infrastructure, and research into future marine fuels (e.g., ammonia, methanol).
- Regulatory Frameworks: Key drivers include the International Maritime Organization (IMO) regulations, Environmental Protection Agency (EPA) standards, and state-specific emissions controls.
- Competitive Product Substitutes: The shift towards VLSFO and MGO has significantly reduced HSFO's competitiveness. LNG is emerging as a viable alternative, albeit with infrastructure challenges.
- End-User Demographics: Shipping companies operating in US waters, including major container lines, tanker operators, and bulk cargo carriers.
- M&A Trends: Strategic acquisitions by larger entities to expand bunkering networks and secure market share in key ports.
United States Bunker Fuel Market Growth Trends & Insights
The United States bunker fuel market is poised for sustained growth, driven by the robust activity of its maritime trade and the ongoing transition towards cleaner energy solutions. The market size is projected to expand significantly from USD 25.4 billion in 2024 to an estimated USD 33.1 billion by 2033, exhibiting a Compound Annual Growth Rate (CAGR) of approximately 3.0%. This expansion is fueled by increasing global trade volumes and the continuous need for reliable fuel supply to the diverse vessel types that call on US ports.
The adoption rates of lower-sulfur fuels have been accelerated by regulatory pressures and the growing environmental consciousness of shipping companies. The shift from HSFO to VLSFO and MGO is a dominant trend, with VLSFO expected to capture a substantial market share due to its cost-effectiveness and compliance with stringent sulfur emission limits. MGO, while cleaner, generally commands a premium.
Technological disruptions are manifesting in the development of new bunkering infrastructure, particularly for LNG, which offers significant environmental benefits in terms of reduced sulfur oxides (SOx), nitrogen oxides (NOx), and greenhouse gas (GHG) emissions. Investments in LNG bunkering facilities at major US ports are a key indicator of this technological shift. Consumer behavior is evolving, with charterers and ship owners increasingly prioritizing fuels that meet environmental, social, and governance (ESG) criteria, influencing purchasing decisions and creating demand for sustainable bunkering solutions.
The market penetration of alternative fuels like LNG is still in its nascent stages but is expected to grow as shore power capabilities expand and the price competitiveness of LNG improves. The overall market evolution is thus a complex interplay of regulatory mandates, technological advancements, economic viability, and shifting end-user preferences, all contributing to a dynamic and growing United States bunker fuel landscape.
Dominant Regions, Countries, or Segments in United States Bunker Fuel Market
Within the United States bunker fuel market, Very-low Sulfur Fuel Oil (VLSFO) has emerged as the dominant fuel type, driven by the global implementation of the International Maritime Organization's (IMO) 2020 sulfur cap. This regulatory shift has dramatically altered the fuel landscape, mandating a reduction in sulfur content in marine fuels to 0.50% from the previous 3.50%. Consequently, VLSFO has become the go-to compliant fuel for a vast majority of the global shipping fleet operating in U.S. waters. The market for VLSFO is projected to reach an estimated USD 18.5 billion by 2025, representing over 70% of the total bunker fuel market.
Marine Gas Oil (MGO), with its even lower sulfur content (typically 0.10%), also plays a crucial role, especially for vessels operating in Emission Control Areas (ECAs) or those prioritizing maximum emission reduction. While more expensive than VLSFO, MGO's superior environmental profile ensures its continued demand, particularly from environmentally conscious operators. MGO's market share is estimated at USD 5.2 billion by 2025.
High Sulfur Fuel Oil (HSFO), once the dominant bunker fuel, has seen a significant decline in demand due to non-compliance with IMO 2020 regulations. Its market share has dwindled, though it still finds limited use in specific segments or for vessels equipped with exhaust gas cleaning systems (scrubbers). The market for HSFO is projected to be around USD 1.0 billion by 2025.
Liquefied Natural Gas (LNG) is the most significant emerging fuel type, recognized for its potential to drastically reduce sulfur and nitrogen oxide emissions, as well as greenhouse gases. While currently a smaller segment, its growth trajectory is steep, fueled by increasing availability of LNG bunkering infrastructure at major U.S. ports and the growing fleet of LNG-powered vessels. The LNG bunker fuel market is estimated to reach USD 1.2 billion by 2025, with substantial growth expected in the forecast period.
Among vessel types, the Tanker Fleet represents a substantial portion of bunker fuel consumption due to the sheer volume of crude oil and refined products transported. Their constant operational cycle and large fuel requirements make them a cornerstone of the market. Container Fleets are also major consumers, driven by global trade volumes. Bulk Carriers and General Cargo Carriers contribute significantly as well, though their consumption patterns can be more variable. The dominance of VLSFO across all these vessel types underscores its current market leadership. Key drivers for this dominance include the necessity of regulatory compliance, established supply chains for VLSFO, and its relative cost-effectiveness compared to alternative fuels, even with the ongoing infrastructure development for LNG.
United States Bunker Fuel Market Product Landscape
The United States bunker fuel market is witnessing a significant evolution in its product landscape, driven by stringent environmental regulations and the pursuit of more sustainable maritime operations. The primary focus has shifted from traditional High Sulfur Fuel Oil (HSFO) to cleaner alternatives such as Very-low Sulfur Fuel Oil (VLSFO) and Marine Gas Oil (MGO). VLSFO, with a sulfur content of 0.50% or less, has become the predominant fuel, offering a balance between compliance and cost-effectiveness. MGO, offering even lower sulfur emissions, is utilized in sensitive areas or by vessels prioritizing enhanced environmental performance. Furthermore, Liquefied Natural Gas (LNG) is rapidly gaining traction as a cleaner-burning fuel, promising substantial reductions in SOx, NOx, and greenhouse gas emissions. The performance metrics of these fuels, including energy density, combustion efficiency, and emissions profiles, are critical factors influencing their adoption, with ongoing research aimed at optimizing these characteristics for various vessel types and operational conditions.
Key Drivers, Barriers & Challenges in United States Bunker Fuel Market
Key Drivers:
- Environmental Regulations: IMO 2020 and evolving EPA standards are the primary catalysts, mandating lower sulfur content and pushing demand for compliant fuels like VLSFO and MGO.
- Global Trade Growth: The continuous expansion of international trade necessitates robust maritime transport, directly correlating with bunker fuel demand.
- Technological Advancements: Development of LNG bunkering infrastructure and research into alternative fuels like methanol and ammonia present long-term growth opportunities.
- Economic Viability of VLSFO: VLSFO offers a cost-effective solution for compliance, making it the default choice for many operators.
Barriers & Challenges:
- Infrastructure Development for LNG: The widespread availability of LNG bunkering facilities across all US ports remains a significant challenge, limiting its adoption.
- Price Volatility of Crude Oil and Refined Products: Fluctuations in global oil prices directly impact bunker fuel costs, creating uncertainty for operators and impacting profit margins.
- Cost of Alternative Fuels: While cleaner, fuels like LNG and potential future alternatives are often more expensive than traditional fuels, posing an economic barrier for some.
- Regulatory Uncertainty: While regulations are driving change, potential future policy shifts or inconsistencies can create apprehension among market participants.
- Supply Chain Disruptions: Geopolitical events, natural disasters, or port congestion can disrupt the reliable supply of bunker fuels, impacting operational continuity.
- Technical Challenges with New Fuels: The handling, storage, and operational integration of new fuels like LNG require specialized expertise and equipment, posing technical hurdles.
Emerging Opportunities in United States Bunker Fuel Market
Emerging opportunities in the United States bunker fuel market are primarily centered around the growing demand for cleaner energy solutions and the expansion of alternative fuel infrastructure. The increasing number of LNG-powered vessels calling on US ports presents a significant opportunity for expansion in LNG bunkering services. Furthermore, investments in research and development for ammonia and methanol as viable marine fuels could unlock future market potential. The development of port-side power supply (cold ironing) at major US ports also offers an opportunity to reduce emissions for berthed vessels, potentially impacting overall bunker fuel demand in specific scenarios. The drive towards a decarbonized shipping industry also opens avenues for sustainable marine biofuels and synthetic fuels.
Growth Accelerators in the United States Bunker Fuel Market Industry
Several key catalysts are accelerating the growth of the United States bunker fuel market. Technological breakthroughs in fuel efficiency for existing vessel types and the development of new, more sustainable engine technologies are reducing overall fuel consumption per voyage, but the sheer volume of maritime activity compensates for this. Strategic partnerships between fuel suppliers, port authorities, and shipping companies are crucial for establishing and expanding bunkering networks, especially for alternative fuels like LNG. Market expansion strategies, including exploring new bunkering hubs and offering diversified fuel portfolios, are also vital. The increasing regulatory push towards decarbonization globally and within the US continues to be a primary growth accelerator, compelling the industry to adopt cleaner alternatives and innovate.
Key Players Shaping the United States Bunker Fuel Market Market
- World Fuel Services Corporation
- Exxon Mobil Corporation
- BP plc
- Chevron Corporation
- Royal Dutch Shell PLC
- Clipper Oil Company
- NuStar Energy L P
- Total S A
Notable Milestones in United States Bunker Fuel Market Sector
- 2019: Implementation of IMO 2020 regulations mandating a global sulfur cap of 0.50% for marine fuels.
- 2020: Increased adoption and infrastructure development for Very-low Sulfur Fuel Oil (VLSFO) across major US ports.
- 2021: First dedicated LNG bunkering barge launched in the U.S., facilitating easier LNG refueling for vessels.
- 2022: Several major shipping lines announce commitments to utilize LNG and other alternative fuels for their fleets operating in US waters.
- 2023: Growing interest and early-stage investments in research and development for ammonia and methanol as future marine fuels.
- 2024: Continued expansion of LNG bunkering facilities at key East Coast and Gulf Coast ports, enhancing supply chain reliability.
In-Depth United States Bunker Fuel Market Market Outlook
The United States bunker fuel market outlook is characterized by robust growth and a significant transition towards cleaner energy solutions. The continued expansion of global trade and the imperative to comply with stringent environmental regulations will fuel demand for compliant fuels. The increasing availability and adoption of LNG as a marine fuel, supported by ongoing infrastructure development, represent a major growth accelerator. While traditional fuels will remain relevant, the long-term trend points towards a diversification of the fuel mix, with ongoing research into ammonia, methanol, and sustainable biofuels promising further innovation. Strategic investments in bunkering infrastructure, coupled with collaborative efforts between industry stakeholders and regulatory bodies, will be crucial in shaping a sustainable and efficient future for the US bunker fuel market.
United States Bunker Fuel Market Segmentation
-
1. Fuel Type
- 1.1. High Sulfur Fuel Oil (HSFO)
- 1.2. Very-low Sulfur Fuel Oil (VLSFO)
- 1.3. Marine Gas Oil (MGO)
- 1.4. Liquefied Natural Gas (LNG)
- 1.5. Others
-
2. Vessel Type
- 2.1. Tanker Fleet
- 2.2. Container Fleet
- 2.3. Bulk Carrier
- 2.4. General Cargo Carriers
- 2.5. Others
United States Bunker Fuel Market Segmentation By Geography
- 1. United States
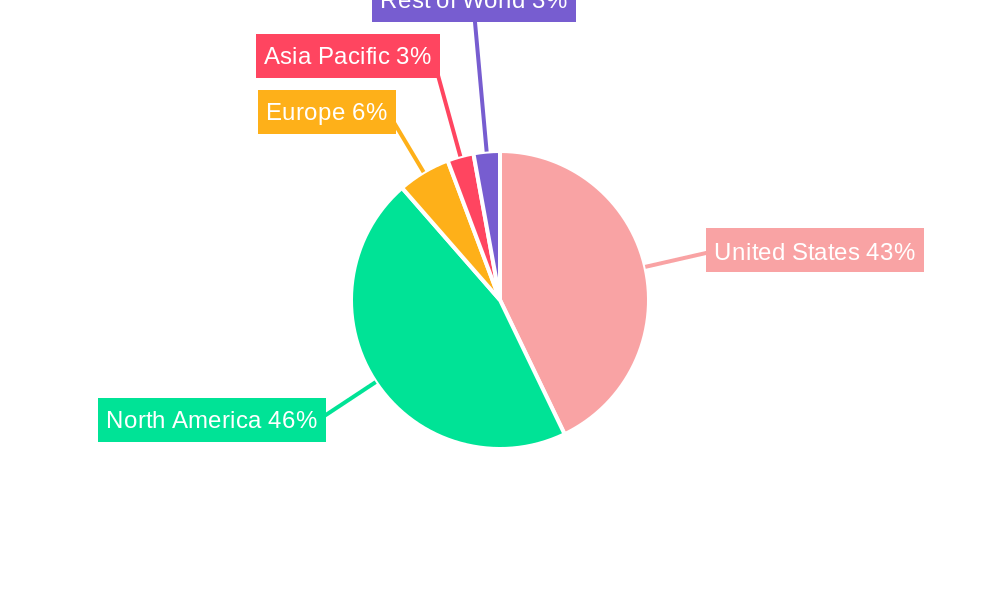
United States Bunker Fuel Market Regional Market Share
Geographic Coverage of United States Bunker Fuel Market
United States Bunker Fuel Market REPORT HIGHLIGHTS
| Aspects | Details |
|---|---|
| Study Period | 2020-2034 |
| Base Year | 2025 |
| Estimated Year | 2026 |
| Forecast Period | 2026-2034 |
| Historical Period | 2020-2025 |
| Growth Rate | CAGR of 5% from 2020-2034 |
| Segmentation |
|
Table of Contents
- 1. Introduction
- 1.1. Research Scope
- 1.2. Market Segmentation
- 1.3. Research Objective
- 1.4. Definitions and Assumptions
- 2. Executive Summary
- 2.1. Market Snapshot
- 3. Market Dynamics
- 3.1. Market Drivers
- 3.2. Market Restrains
- 3.3. Market Trends
- 3.4. Market Opportunities
- 4. Market Factor Analysis
- 4.1. Porters Five Forces
- 4.1.1. Bargaining Power of Suppliers
- 4.1.2. Bargaining Power of Buyers
- 4.1.3. Threat of New Entrants
- 4.1.4. Threat of Substitutes
- 4.1.5. Competitive Rivalry
- 4.2. PESTEL analysis
- 4.3. BCG Analysis
- 4.3.1. Stars (High Growth, High Market Share)
- 4.3.2. Cash Cows (Low Growth, High Market Share)
- 4.3.3. Question Mark (High Growth, Low Market Share)
- 4.3.4. Dogs (Low Growth, Low Market Share)
- 4.4. Ansoff Matrix Analysis
- 4.5. Supply Chain Analysis
- 4.6. Regulatory Landscape
- 4.7. Current Market Potential and Opportunity Assessment (TAM–SAM–SOM Framework)
- 4.8. VDR Analyst Note
- 4.1. Porters Five Forces
- 5. Market Analysis, Insights and Forecast 2021-2033
- 5.1. Market Analysis, Insights and Forecast - by Fuel Type
- 5.1.1. High Sulfur Fuel Oil (HSFO)
- 5.1.2. Very-low Sulfur Fuel Oil (VLSFO)
- 5.1.3. Marine Gas Oil (MGO)
- 5.1.4. Liquefied Natural Gas (LNG)
- 5.1.5. Others
- 5.2. Market Analysis, Insights and Forecast - by Vessel Type
- 5.2.1. Tanker Fleet
- 5.2.2. Container Fleet
- 5.2.3. Bulk Carrier
- 5.2.4. General Cargo Carriers
- 5.2.5. Others
- 5.3. Market Analysis, Insights and Forecast - by Region
- 5.3.1. United States
- 5.1. Market Analysis, Insights and Forecast - by Fuel Type
- 6. United States Bunker Fuel Market Analysis, Insights and Forecast, 2021-2033
- 6.1. Market Analysis, Insights and Forecast - by Fuel Type
- 6.1.1. High Sulfur Fuel Oil (HSFO)
- 6.1.2. Very-low Sulfur Fuel Oil (VLSFO)
- 6.1.3. Marine Gas Oil (MGO)
- 6.1.4. Liquefied Natural Gas (LNG)
- 6.1.5. Others
- 6.2. Market Analysis, Insights and Forecast - by Vessel Type
- 6.2.1. Tanker Fleet
- 6.2.2. Container Fleet
- 6.2.3. Bulk Carrier
- 6.2.4. General Cargo Carriers
- 6.2.5. Others
- 6.1. Market Analysis, Insights and Forecast - by Fuel Type
- 7. Competitive Analysis
- 7.1. Company Profiles
- 7.1.1 World Fuel Services Corporation*List Not Exhaustive
- 7.1.1.1. Company Overview
- 7.1.1.2. Products
- 7.1.1.3. Company Financials
- 7.1.1.4. SWOT Analysis
- 7.1.2 Exxon Mobil Corporation
- 7.1.2.1. Company Overview
- 7.1.2.2. Products
- 7.1.2.3. Company Financials
- 7.1.2.4. SWOT Analysis
- 7.1.3 BP plc
- 7.1.3.1. Company Overview
- 7.1.3.2. Products
- 7.1.3.3. Company Financials
- 7.1.3.4. SWOT Analysis
- 7.1.4 Chevron Corporation
- 7.1.4.1. Company Overview
- 7.1.4.2. Products
- 7.1.4.3. Company Financials
- 7.1.4.4. SWOT Analysis
- 7.1.5 Royal Dutch Shell PLC
- 7.1.5.1. Company Overview
- 7.1.5.2. Products
- 7.1.5.3. Company Financials
- 7.1.5.4. SWOT Analysis
- 7.1.6 Clipper Oil Company
- 7.1.6.1. Company Overview
- 7.1.6.2. Products
- 7.1.6.3. Company Financials
- 7.1.6.4. SWOT Analysis
- 7.1.7 NuStar Energy L P
- 7.1.7.1. Company Overview
- 7.1.7.2. Products
- 7.1.7.3. Company Financials
- 7.1.7.4. SWOT Analysis
- 7.1.8 Total S A
- 7.1.8.1. Company Overview
- 7.1.8.2. Products
- 7.1.8.3. Company Financials
- 7.1.8.4. SWOT Analysis
- 7.1.1 World Fuel Services Corporation*List Not Exhaustive
- 7.2. Market Entropy
- 7.2.1 Company's Key Areas Served
- 7.2.2 Recent Developments
- 7.3. Company Market Share Analysis 2025
- 7.3.1 Top 5 Companies Market Share Analysis
- 7.3.2 Top 3 Companies Market Share Analysis
- 7.4. List of Potential Customers
- 8. Research Methodology
List of Figures
- Figure 1: United States Bunker Fuel Market Revenue Breakdown (billion, %) by Product 2025 & 2033
- Figure 2: United States Bunker Fuel Market Share (%) by Company 2025
List of Tables
- Table 1: United States Bunker Fuel Market Revenue billion Forecast, by Fuel Type 2020 & 2033
- Table 2: United States Bunker Fuel Market Volume metric tonnes Forecast, by Fuel Type 2020 & 2033
- Table 3: United States Bunker Fuel Market Revenue billion Forecast, by Vessel Type 2020 & 2033
- Table 4: United States Bunker Fuel Market Volume metric tonnes Forecast, by Vessel Type 2020 & 2033
- Table 5: United States Bunker Fuel Market Revenue billion Forecast, by Region 2020 & 2033
- Table 6: United States Bunker Fuel Market Volume metric tonnes Forecast, by Region 2020 & 2033
- Table 7: United States Bunker Fuel Market Revenue billion Forecast, by Fuel Type 2020 & 2033
- Table 8: United States Bunker Fuel Market Volume metric tonnes Forecast, by Fuel Type 2020 & 2033
- Table 9: United States Bunker Fuel Market Revenue billion Forecast, by Vessel Type 2020 & 2033
- Table 10: United States Bunker Fuel Market Volume metric tonnes Forecast, by Vessel Type 2020 & 2033
- Table 11: United States Bunker Fuel Market Revenue billion Forecast, by Country 2020 & 2033
- Table 12: United States Bunker Fuel Market Volume metric tonnes Forecast, by Country 2020 & 2033
Frequently Asked Questions
1. What is the projected Compound Annual Growth Rate (CAGR) of the United States Bunker Fuel Market?
The projected CAGR is approximately 5%.
2. Which companies are prominent players in the United States Bunker Fuel Market?
Key companies in the market include World Fuel Services Corporation*List Not Exhaustive, Exxon Mobil Corporation, BP plc, Chevron Corporation, Royal Dutch Shell PLC, Clipper Oil Company, NuStar Energy L P, Total S A.
3. What are the main segments of the United States Bunker Fuel Market?
The market segments include Fuel Type, Vessel Type.
4. Can you provide details about the market size?
The market size is estimated to be USD 30.51 billion as of 2022.
5. What are some drivers contributing to market growth?
Government Policies for the Adoption of Energy-efficient Lighting Systems; Adoption of IoT with Lighting Systems.
6. What are the notable trends driving market growth?
Very-Low Sulfur Fuel Oil (VLSFO) Segment is Expected to Witness Significant Growth.
7. Are there any restraints impacting market growth?
The global shift toward renewable sources for electricity generation.
8. Can you provide examples of recent developments in the market?
N/A
9. What pricing options are available for accessing the report?
Pricing options include single-user, multi-user, and enterprise licenses priced at USD 3800, USD 4500, and USD 5800 respectively.
10. Is the market size provided in terms of value or volume?
The market size is provided in terms of value, measured in billion and volume, measured in metric tonnes.
11. Are there any specific market keywords associated with the report?
Yes, the market keyword associated with the report is "United States Bunker Fuel Market," which aids in identifying and referencing the specific market segment covered.
12. How do I determine which pricing option suits my needs best?
The pricing options vary based on user requirements and access needs. Individual users may opt for single-user licenses, while businesses requiring broader access may choose multi-user or enterprise licenses for cost-effective access to the report.
13. Are there any additional resources or data provided in the United States Bunker Fuel Market report?
While the report offers comprehensive insights, it's advisable to review the specific contents or supplementary materials provided to ascertain if additional resources or data are available.
14. How can I stay updated on further developments or reports in the United States Bunker Fuel Market?
To stay informed about further developments, trends, and reports in the United States Bunker Fuel Market, consider subscribing to industry newsletters, following relevant companies and organizations, or regularly checking reputable industry news sources and publications.
Methodology
Step 1 - Identification of Relevant Samples Size from Population Database


Step 2 - Approaches for Defining Global Market Size (Value, Volume* & Price*)

Note*: In applicable scenarios
Step 3 - Data Sources
Primary Research
- Web Analytics
- Survey Reports
- Research Institute
- Latest Research Reports
- Opinion Leaders
Secondary Research
- Annual Reports
- White Paper
- Latest Press Release
- Industry Association
- Paid Database
- Investor Presentations

Step 4 - Data Triangulation
Involves using different sources of information in order to increase the validity of a study
These sources are likely to be stakeholders in a program - participants, other researchers, program staff, other community members, and so on.
Then we put all data in single framework & apply various statistical tools to find out the dynamic on the market.
During the analysis stage, feedback from the stakeholder groups would be compared to determine areas of agreement as well as areas of divergence