

Key Insights
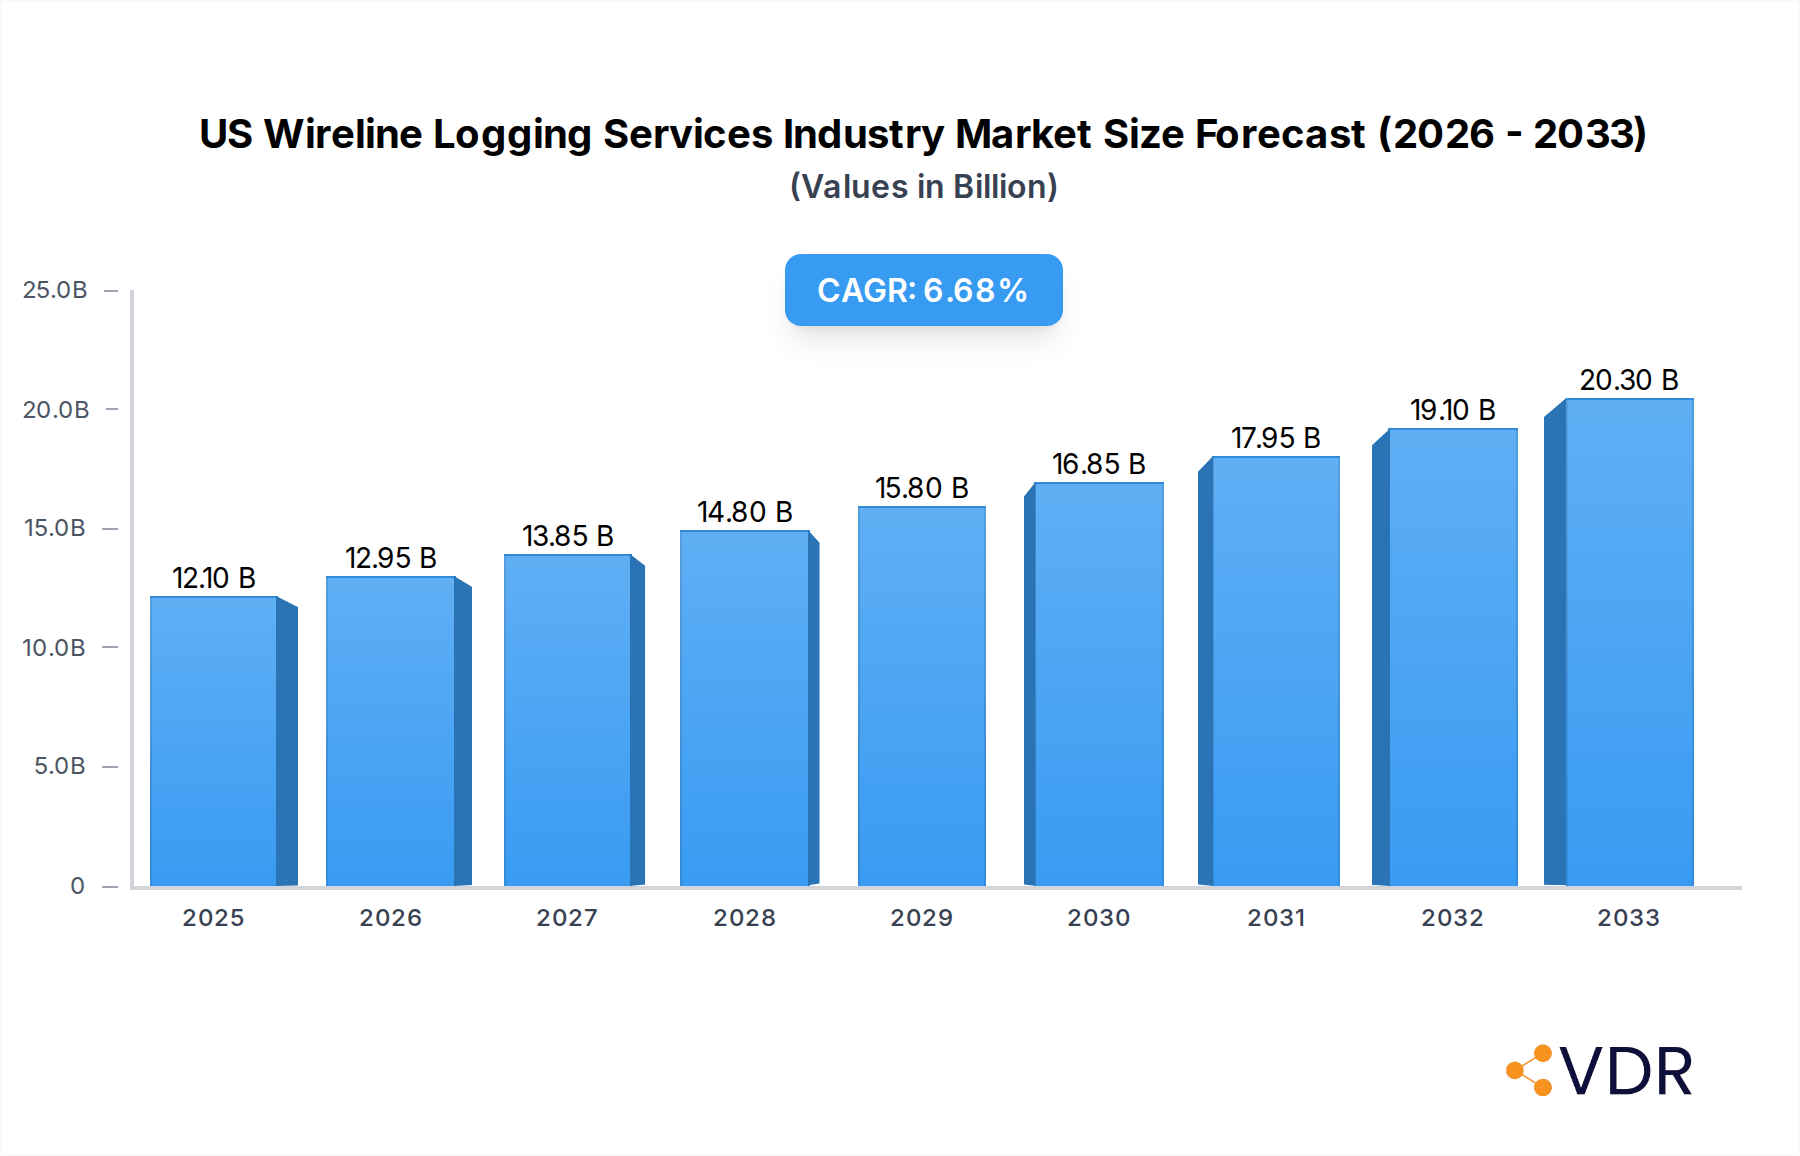
The US Wireline Logging Services market is poised for significant expansion, estimated at $12.1 billion in 2025 and projected to grow at a Compound Annual Growth Rate (CAGR) of 7.1% through 2033. This robust growth is fueled by the increasing demand for efficient and effective subsurface data acquisition to optimize oil and gas exploration and production activities. Key drivers include the need for enhanced oil recovery (EOR) techniques, the development of unconventional resources requiring advanced logging solutions, and the continuous pursuit of operational efficiency and cost reduction in the energy sector. Furthermore, technological advancements in wireline logging tools, such as improved sensor technology, real-time data transmission, and advanced analytics, are playing a crucial role in driving market adoption and innovation. The market is witnessing a growing emphasis on integrated services, combining various logging techniques to provide comprehensive wellbore evaluations.

US Wireline Logging Services Industry Market Size (In Billion)
The market segmentation reveals a diverse landscape with significant opportunities across different deployment and type categories. Onshore deployment dominates the market, reflecting the extensive existing infrastructure and ongoing drilling activities. However, offshore logging services are expected to witness substantial growth, driven by deepwater exploration and the exploitation of marginal fields. In terms of type, electric line logging, offering higher bandwidth and accuracy, is a primary segment. Slick line services, while simpler, remain crucial for routine operations and interventions. The demand for both open hole and cased hole logging services is strong, as they provide critical data for reservoir characterization, production monitoring, and integrity assessment throughout a well's lifecycle. Leading companies in the US wireline logging services sector, including Schlumberger, Halliburton, and Baker Hughes, are investing heavily in research and development to offer innovative solutions and maintain a competitive edge in this dynamic market.
US Wireline Logging Services Industry Company Market Share
The US wireline logging services industry, a crucial segment of oil and gas exploration and production, exhibits a moderately concentrated market structure, with major players like Schlumberger Limited, Halliburton Company, and Baker Hughes Company dominating a significant portion of the market share. Technological innovation is a primary driver, fueled by the continuous need for more accurate subsurface data and enhanced recovery techniques. Advancements in real-time data acquisition, artificial intelligence-driven analysis, and specialized logging tools for unconventional reservoirs are reshaping operational efficiency and data interpretation. Regulatory frameworks, particularly concerning environmental standards and data security, also influence operational strategies and investment priorities. Competitive product substitutes, while limited in direct wireline application, emerge from alternative data acquisition methods like LWD (Logging While Drilling) and sophisticated seismic imaging techniques, prompting wireline service providers to constantly innovate and offer integrated solutions. End-user demographics are largely comprised of major oil and gas exploration and production companies, both independent and integrated, with a growing interest from specialized firms in niche reservoir characterization. Mergers and acquisitions (M&A) trends are notably active, driven by the pursuit of vertical integration, expanded service portfolios, and economies of scale. In 2024, M&A activity saw an estimated xx deal volumes as companies consolidate to weather market volatility and enhance their competitive edge. Innovation barriers include the high capital expenditure required for cutting-edge technology development and deployment, coupled with the cyclical nature of the oil and gas industry, which can impact R&D investment.
US Wireline Logging Services Industry Growth Trends & Insights
The US wireline logging services market is poised for substantial expansion, projected to grow from an estimated $xx billion in 2024 to $xx billion by 2033, exhibiting a Compound Annual Growth Rate (CAGR) of xx% during the forecast period. This robust growth trajectory is underpinned by a complex interplay of factors, including the increasing demand for energy, the imperative to optimize existing oil and gas reserves, and the ongoing exploration of both conventional and unconventional hydrocarbon resources. The adoption rate of advanced wireline logging technologies is accelerating, driven by the proven return on investment in terms of improved reservoir understanding, optimized well productivity, and reduced operational risks. Technological disruptions, such as the integration of machine learning and artificial intelligence for real-time data analysis and predictive modeling, are transforming the industry. These innovations enable more precise formation evaluation, enhanced oil recovery (EOR) strategies, and improved wellbore integrity monitoring. Furthermore, shifts in consumer behavior, manifesting as a growing global energy demand that necessitates maximizing domestic production, are indirectly influencing the wireline logging services sector. Market penetration is deepening, particularly in the onshore segment, as operators focus on maximizing output from mature fields and developing marginal reserves. The emphasis on data-driven decision-making throughout the entire well lifecycle, from exploration to abandonment, is a key driver of increased wireline logging service utilization. This includes the deployment of specialized logging suites for complex geological formations, deepwater exploration, and unconventional plays like shale oil and gas. The continuous refinement of logging tools and techniques to provide higher resolution data and more comprehensive formation characterization is also contributing to market growth, as operators seek to minimize uncertainty and maximize hydrocarbon recovery efficiency.
Dominant Regions, Countries, or Segments in US Wireline Logging Services Industry
The Onshore deployment segment unequivocally dominates the US wireline logging services industry, significantly outperforming its Offshore counterpart. This dominance is driven by the vast expanse of onshore oil and gas producing regions across the United States, including the Permian Basin, the Eagle Ford Shale, the Marcellus Shale, and the Bakken Formation. These regions represent the heart of domestic hydrocarbon production and are characterized by extensive infrastructure, established operational expertise, and a continuous need for efficient well intervention and data acquisition.
Key Drivers for Onshore Dominance:
- Extensive Proven Reserves and Ongoing Exploration: The US possesses vast proven reserves of oil and natural gas, with a substantial portion concentrated in onshore geological formations. Continuous exploration and development activities in these mature basins necessitate regular wireline logging services for reservoir characterization, production optimization, and well integrity management.
- Technological Advancements Tailored for Onshore: Innovations in wireline logging, such as high-resolution formation evaluation tools, advanced imaging technologies, and specialized services for unconventional reservoirs (shale gas and tight oil), are specifically designed to address the complexities of onshore geological environments.
- Economic Viability and Infrastructure: Onshore operations generally offer more favorable economics compared to offshore ventures due to lower upfront capital expenditure, established transportation networks, and readily available skilled labor. This makes onshore projects a priority for exploration and production (E&P) companies.
- Deployment Ease and Frequency: The logistical ease of deploying wireline units and personnel onshore leads to a higher frequency of logging operations compared to the more complex and time-consuming offshore deployments. This allows for more continuous monitoring and intervention.
- Dominance in Electric Line Services: Within the onshore segment, Electric Line logging services represent the most significant and widely utilized type. Electric line offers superior data quality, faster deployment, and broader application range compared to slickline for many formation evaluation and well intervention tasks. This segment is integral to comprehensive reservoir studies, completion evaluations, and production logging in both open and cased holes.
- Open Hole and Cased Hole Applications: Both Open Hole and Cased Hole logging applications are critical in the onshore segment. Open hole logging is essential during the initial drilling phase for detailed formation characterization, while cased hole logging is vital for monitoring well performance, identifying production issues, and performing interventions throughout the life of the well. The sheer volume of wells drilled and maintained onshore ensures robust demand for both.
The Electric Line type of service also holds a dominant position within the overall US wireline logging market due to its comprehensive data acquisition capabilities and versatility across various well conditions and objectives. Similarly, Open Hole applications, crucial for initial reservoir assessment, represent a foundational segment, while Cased Hole applications are gaining prominence due to the emphasis on maximizing recovery from existing wells and managing mature fields.
US Wireline Logging Services Industry Product Landscape
The US wireline logging services industry is characterized by a dynamic product landscape focused on delivering high-fidelity subsurface data and sophisticated analysis. Innovations center on advanced sensor technologies, miniaturization for deployment in challenging wellbore conditions, and integrated software solutions for real-time interpretation. Products include specialized logging tools for formation evaluation (e.g., resistivity, porosity, density, and spectral gamma ray logging), well integrity assessment (e.g., cement bond logging, ultrasonic imaging), production monitoring (e.g., flow meters, pressure and temperature sensors), and reservoir characterization (e.g., advanced imaging and seismic while logging tools). Unique selling propositions often lie in the speed of data acquisition, accuracy of measurements, ability to operate under extreme temperatures and pressures, and the integration of AI-powered analytics for predictive maintenance and optimized production. Technological advancements are continually enhancing the resolution of data, reducing operational downtime, and providing more comprehensive insights into reservoir behavior.
Key Drivers, Barriers & Challenges in US Wireline Logging Services Industry
Key Drivers:
- Growing Global Energy Demand: The persistent need for oil and gas continues to drive exploration and production activities, directly fueling demand for wireline logging services to assess and optimize hydrocarbon recovery.
- Technological Advancements: Continuous innovation in logging tools, data analytics, and AI is improving the efficiency, accuracy, and cost-effectiveness of wireline services, making them indispensable for modern E&P operations.
- Focus on Maximizing Recovery from Existing Fields: As easily accessible reserves diminish, operators increasingly rely on wireline logging to enhance recovery from mature fields through detailed reservoir analysis and intervention planning.
- Unconventional Resource Development: The significant role of unconventional plays like shale gas and tight oil requires specialized wireline logging techniques for effective reservoir characterization and completion optimization.
Key Barriers & Challenges:
- Oil Price Volatility: Fluctuations in crude oil prices directly impact exploration and production budgets, leading to unpredictable demand for wireline services and potential project delays or cancellations. An estimated xx% decrease in capital expenditure due to price drops can significantly curtail service demand.
- Regulatory Hurdles and Environmental Concerns: Increasingly stringent environmental regulations and the growing emphasis on sustainable energy practices can lead to higher operational costs and compliance challenges, potentially impacting investment in new technologies.
- Skilled Workforce Shortage: The industry faces a challenge in attracting and retaining a skilled workforce, including experienced wireline operators, engineers, and data analysts, which can constrain operational capacity and growth.
- Intense Competition and Pricing Pressures: A competitive market landscape, particularly in mature basins, can lead to pricing pressures, impacting profit margins for service providers.
- Supply Chain Disruptions: Global supply chain issues can affect the availability and cost of specialized equipment and spare parts, leading to operational delays and increased maintenance expenses.
Emerging Opportunities in US Wireline Logging Services Industry
Emerging opportunities in the US wireline logging services industry are predominantly linked to the digitalization of operations and the increasing focus on environmental, social, and governance (ESG) initiatives. The integration of artificial intelligence and machine learning for real-time data analysis and predictive modeling presents a significant avenue for enhanced service offerings and value creation. Furthermore, the growing demand for specialized logging services for carbon capture, utilization, and storage (CCUS) projects, geothermal energy exploration, and geological storage of hydrogen offers untapped market potential. The development of advanced sensing technologies for enhanced well integrity monitoring and leak detection, crucial for environmental compliance, also represents a growth area.
Growth Accelerators in the US Wireline Logging Services Industry
Several key catalysts are propelling long-term growth within the US wireline logging services industry. Technological breakthroughs, particularly in areas such as fiber-optic sensing for continuous downhole monitoring and the application of advanced analytics and machine learning for predictive reservoir management, are significantly enhancing operational efficiency and data interpretation. Strategic partnerships between wireline service providers, exploration and production companies, and technology developers are fostering innovation and enabling the co-creation of tailored solutions. Furthermore, market expansion strategies, including the diversification of service offerings into adjacent sectors like renewable energy exploration (geothermal) and carbon storage, are opening up new revenue streams and reducing reliance on traditional oil and gas cycles. The ongoing push for digital transformation across the energy sector is also a major accelerator, encouraging investment in integrated digital platforms and data-driven decision-making tools.
Key Players Shaping the US Wireline Logging Services Industry Market
- Schlumberger Limited
- Halliburton Company
- Baker Hughes Company
- Weatherford International PLC
- Expro Group
- Superior Energy Services Inc
- Pioneer Energy Services Corp
- NexTier Oilfield Solution Inc
- RECON Petro Technologies Ltd
Notable Milestones in US Wireline Logging Services Industry Sector
- May 2022: Caliber Completion Services, LLC acquired all the wireline assets substantially from ClearWell Dynamics, LLC's subsidiary, formerly known as Pioneer Wireline Services, LLC. This consolidation aimed to bolster Caliber's market presence and service capabilities within the wireline sector.
- October 2022: Schlumberger was awarded multiple scopes for an enhanced oil recovery pilot project by Denbury Onshore, LLC. The award encompassed a comprehensive suite of services, including downhole logging, coring and core laboratory analysis, downhole completions equipment, specialized electric submersible REDA* pumps designed for high CO2 concentrations, and permanent distributed temperature and acoustic sensing utilizing Optiq Schlumberger fiber-optic solutions. This highlights the industry's move towards integrated solutions and advanced monitoring technologies.
In-Depth US Wireline Logging Services Industry Market Outlook
The US wireline logging services industry is set for a period of sustained growth, driven by a convergence of factors that underscore its critical role in the modern energy landscape. The ongoing global demand for energy, coupled with strategic domestic production initiatives, ensures continued investment in exploration and development. Advanced technological integration, particularly in AI-driven analytics and fiber-optic sensing, is not only optimizing traditional operations but also paving the way for novel applications in areas like carbon capture and geothermal energy exploration. Strategic alliances and a willingness to diversify service portfolios will be crucial for navigating market dynamics and capitalizing on emerging opportunities. The industry's ability to adapt to evolving regulatory environments and embrace digital transformation will be paramount in solidifying its future trajectory, promising robust growth and innovation for the foreseeable future.
US Wireline Logging Services Industry Segmentation
-
1. Deployment
- 1.1. Onshore
- 1.2. Offshore
-
2. Type (Qualitative Analysis Only)
- 2.1. Electric Line
- 2.2. Slick Line
-
3. Hole Type (Qualitative Analysis Only)
- 3.1. Open Hole
- 3.2. Cased Hole
US Wireline Logging Services Industry Segmentation By Geography
-
1. North America
- 1.1. United States
- 1.2. Canada
- 1.3. Mexico
-
2. South America
- 2.1. Brazil
- 2.2. Argentina
- 2.3. Rest of South America
-
3. Europe
- 3.1. United Kingdom
- 3.2. Germany
- 3.3. France
- 3.4. Italy
- 3.5. Spain
- 3.6. Russia
- 3.7. Benelux
- 3.8. Nordics
- 3.9. Rest of Europe
-
4. Middle East & Africa
- 4.1. Turkey
- 4.2. Israel
- 4.3. GCC
- 4.4. North Africa
- 4.5. South Africa
- 4.6. Rest of Middle East & Africa
-
5. Asia Pacific
- 5.1. China
- 5.2. India
- 5.3. Japan
- 5.4. South Korea
- 5.5. ASEAN
- 5.6. Oceania
- 5.7. Rest of Asia Pacific
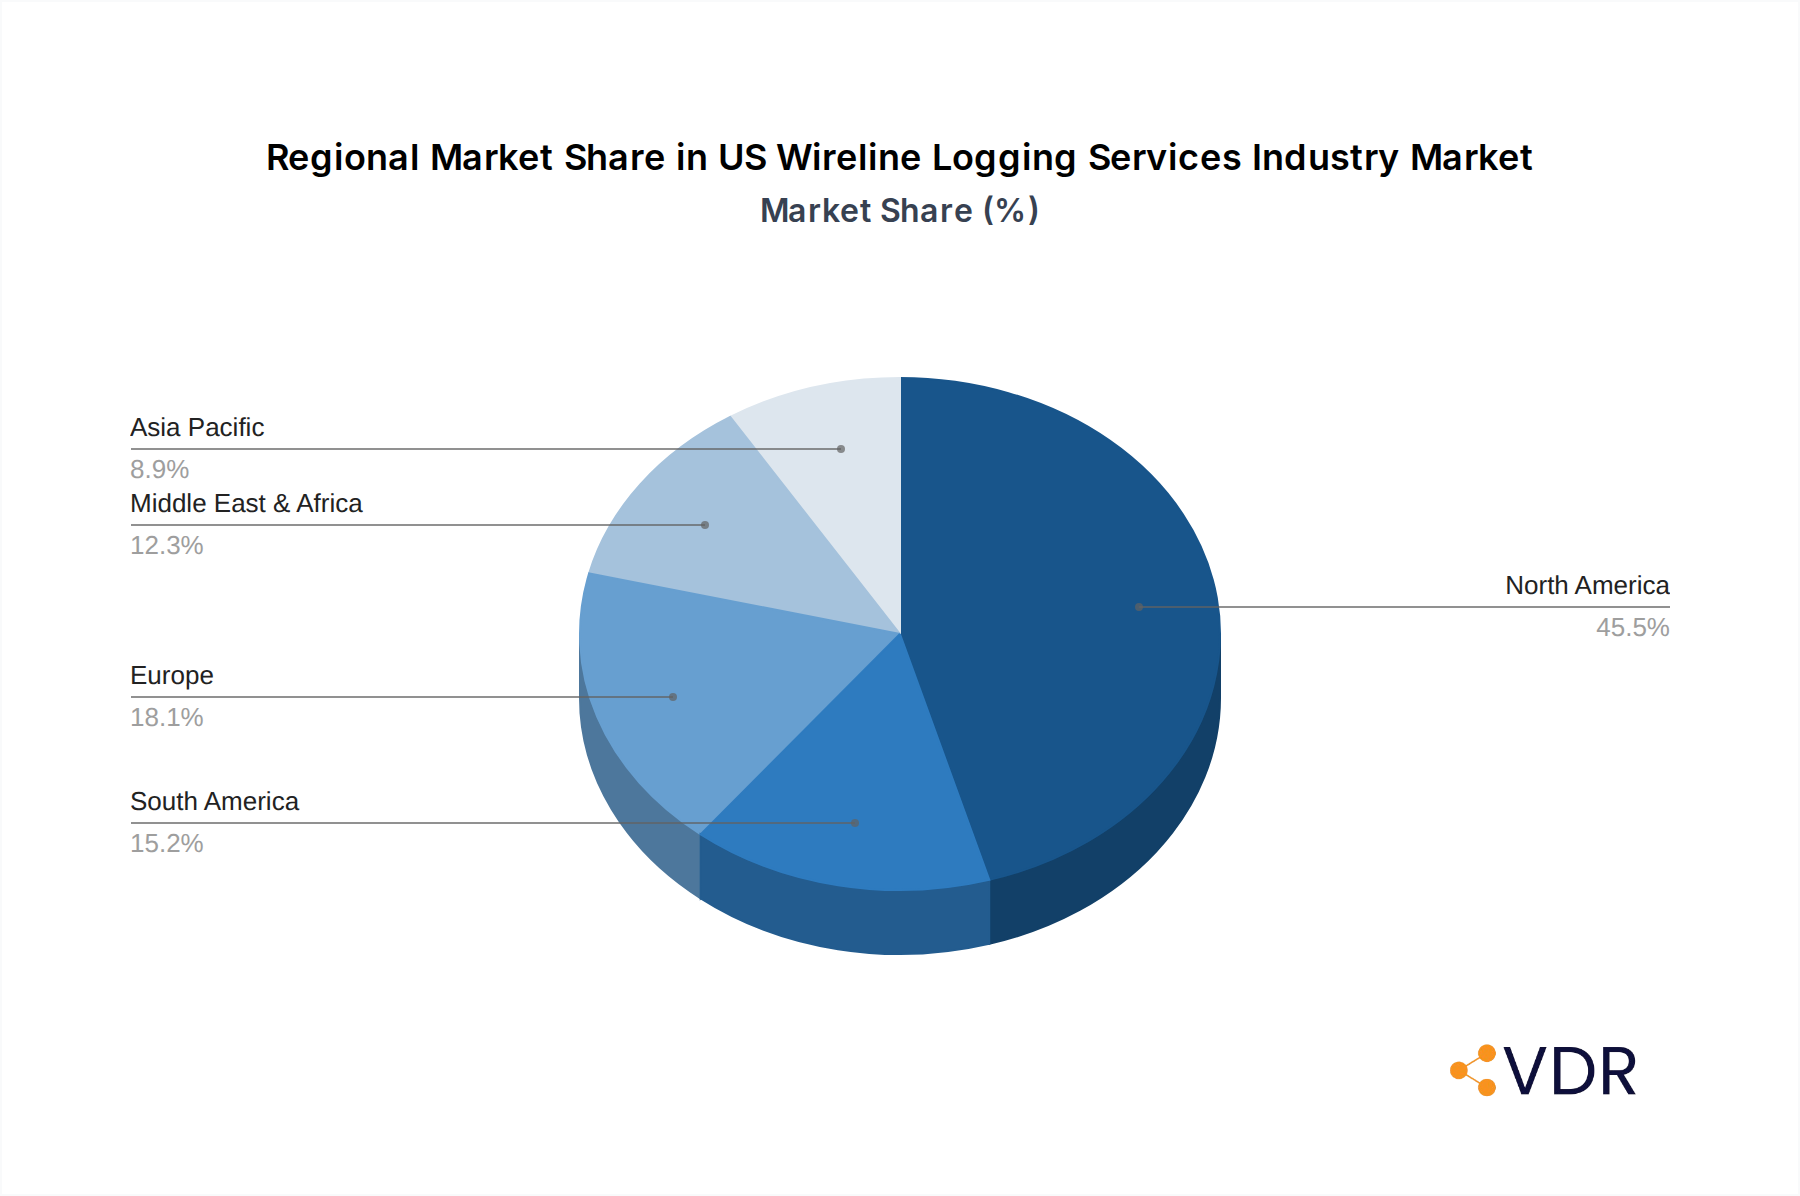
US Wireline Logging Services Industry Regional Market Share
Geographic Coverage of US Wireline Logging Services Industry
US Wireline Logging Services Industry REPORT HIGHLIGHTS
| Aspects | Details |
|---|---|
| Study Period | 2020-2034 |
| Base Year | 2025 |
| Estimated Year | 2026 |
| Forecast Period | 2026-2034 |
| Historical Period | 2020-2025 |
| Growth Rate | CAGR of 7.1% from 2020-2034 |
| Segmentation |
|
Table of Contents
- 1. Introduction
- 1.1. Research Scope
- 1.2. Market Segmentation
- 1.3. Research Objective
- 1.4. Definitions and Assumptions
- 2. Executive Summary
- 2.1. Market Snapshot
- 3. Market Dynamics
- 3.1. Market Drivers
- 3.2. Market Restrains
- 3.3. Market Trends
- 3.4. Market Opportunities
- 4. Market Factor Analysis
- 4.1. Porters Five Forces
- 4.1.1. Bargaining Power of Suppliers
- 4.1.2. Bargaining Power of Buyers
- 4.1.3. Threat of New Entrants
- 4.1.4. Threat of Substitutes
- 4.1.5. Competitive Rivalry
- 4.2. PESTEL analysis
- 4.3. BCG Analysis
- 4.3.1. Stars (High Growth, High Market Share)
- 4.3.2. Cash Cows (Low Growth, High Market Share)
- 4.3.3. Question Mark (High Growth, Low Market Share)
- 4.3.4. Dogs (Low Growth, Low Market Share)
- 4.4. Ansoff Matrix Analysis
- 4.5. Supply Chain Analysis
- 4.6. Regulatory Landscape
- 4.7. Current Market Potential and Opportunity Assessment (TAM–SAM–SOM Framework)
- 4.8. VDR Analyst Note
- 4.1. Porters Five Forces
- 5. Market Analysis, Insights and Forecast 2021-2033
- 5.1. Market Analysis, Insights and Forecast - by Deployment
- 5.1.1. Onshore
- 5.1.2. Offshore
- 5.2. Market Analysis, Insights and Forecast - by Type (Qualitative Analysis Only)
- 5.2.1. Electric Line
- 5.2.2. Slick Line
- 5.3. Market Analysis, Insights and Forecast - by Hole Type (Qualitative Analysis Only)
- 5.3.1. Open Hole
- 5.3.2. Cased Hole
- 5.4. Market Analysis, Insights and Forecast - by Region
- 5.4.1. North America
- 5.4.2. South America
- 5.4.3. Europe
- 5.4.4. Middle East & Africa
- 5.4.5. Asia Pacific
- 5.1. Market Analysis, Insights and Forecast - by Deployment
- 6. Global US Wireline Logging Services Industry Analysis, Insights and Forecast, 2021-2033
- 6.1. Market Analysis, Insights and Forecast - by Deployment
- 6.1.1. Onshore
- 6.1.2. Offshore
- 6.2. Market Analysis, Insights and Forecast - by Type (Qualitative Analysis Only)
- 6.2.1. Electric Line
- 6.2.2. Slick Line
- 6.3. Market Analysis, Insights and Forecast - by Hole Type (Qualitative Analysis Only)
- 6.3.1. Open Hole
- 6.3.2. Cased Hole
- 6.1. Market Analysis, Insights and Forecast - by Deployment
- 7. North America US Wireline Logging Services Industry Analysis, Insights and Forecast, 2021-2033
- 7.1. Market Analysis, Insights and Forecast - by Deployment
- 7.1.1. Onshore
- 7.1.2. Offshore
- 7.2. Market Analysis, Insights and Forecast - by Type (Qualitative Analysis Only)
- 7.2.1. Electric Line
- 7.2.2. Slick Line
- 7.3. Market Analysis, Insights and Forecast - by Hole Type (Qualitative Analysis Only)
- 7.3.1. Open Hole
- 7.3.2. Cased Hole
- 7.1. Market Analysis, Insights and Forecast - by Deployment
- 8. South America US Wireline Logging Services Industry Analysis, Insights and Forecast, 2021-2033
- 8.1. Market Analysis, Insights and Forecast - by Deployment
- 8.1.1. Onshore
- 8.1.2. Offshore
- 8.2. Market Analysis, Insights and Forecast - by Type (Qualitative Analysis Only)
- 8.2.1. Electric Line
- 8.2.2. Slick Line
- 8.3. Market Analysis, Insights and Forecast - by Hole Type (Qualitative Analysis Only)
- 8.3.1. Open Hole
- 8.3.2. Cased Hole
- 8.1. Market Analysis, Insights and Forecast - by Deployment
- 9. Europe US Wireline Logging Services Industry Analysis, Insights and Forecast, 2021-2033
- 9.1. Market Analysis, Insights and Forecast - by Deployment
- 9.1.1. Onshore
- 9.1.2. Offshore
- 9.2. Market Analysis, Insights and Forecast - by Type (Qualitative Analysis Only)
- 9.2.1. Electric Line
- 9.2.2. Slick Line
- 9.3. Market Analysis, Insights and Forecast - by Hole Type (Qualitative Analysis Only)
- 9.3.1. Open Hole
- 9.3.2. Cased Hole
- 9.1. Market Analysis, Insights and Forecast - by Deployment
- 10. Middle East & Africa US Wireline Logging Services Industry Analysis, Insights and Forecast, 2021-2033
- 10.1. Market Analysis, Insights and Forecast - by Deployment
- 10.1.1. Onshore
- 10.1.2. Offshore
- 10.2. Market Analysis, Insights and Forecast - by Type (Qualitative Analysis Only)
- 10.2.1. Electric Line
- 10.2.2. Slick Line
- 10.3. Market Analysis, Insights and Forecast - by Hole Type (Qualitative Analysis Only)
- 10.3.1. Open Hole
- 10.3.2. Cased Hole
- 10.1. Market Analysis, Insights and Forecast - by Deployment
- 11. Asia Pacific US Wireline Logging Services Industry Analysis, Insights and Forecast, 2021-2033
- 11.1. Market Analysis, Insights and Forecast - by Deployment
- 11.1.1. Onshore
- 11.1.2. Offshore
- 11.2. Market Analysis, Insights and Forecast - by Type (Qualitative Analysis Only)
- 11.2.1. Electric Line
- 11.2.2. Slick Line
- 11.3. Market Analysis, Insights and Forecast - by Hole Type (Qualitative Analysis Only)
- 11.3.1. Open Hole
- 11.3.2. Cased Hole
- 11.1. Market Analysis, Insights and Forecast - by Deployment
- 12. Competitive Analysis
- 12.1. Company Profiles
- 12.1.1 Superior Energy Services Inc
- 12.1.1.1. Company Overview
- 12.1.1.2. Products
- 12.1.1.3. Company Financials
- 12.1.1.4. SWOT Analysis
- 12.1.2 Pioneer Energy Services Corp
- 12.1.2.1. Company Overview
- 12.1.2.2. Products
- 12.1.2.3. Company Financials
- 12.1.2.4. SWOT Analysis
- 12.1.3 Expro Group
- 12.1.3.1. Company Overview
- 12.1.3.2. Products
- 12.1.3.3. Company Financials
- 12.1.3.4. SWOT Analysis
- 12.1.4 NexTier Oilfield Solution Inc
- 12.1.4.1. Company Overview
- 12.1.4.2. Products
- 12.1.4.3. Company Financials
- 12.1.4.4. SWOT Analysis
- 12.1.5 Weatherford International PLC
- 12.1.5.1. Company Overview
- 12.1.5.2. Products
- 12.1.5.3. Company Financials
- 12.1.5.4. SWOT Analysis
- 12.1.6 Baker Hughes Company
- 12.1.6.1. Company Overview
- 12.1.6.2. Products
- 12.1.6.3. Company Financials
- 12.1.6.4. SWOT Analysis
- 12.1.7 Halliburton Company
- 12.1.7.1. Company Overview
- 12.1.7.2. Products
- 12.1.7.3. Company Financials
- 12.1.7.4. SWOT Analysis
- 12.1.8 Schlumberger Limited
- 12.1.8.1. Company Overview
- 12.1.8.2. Products
- 12.1.8.3. Company Financials
- 12.1.8.4. SWOT Analysis
- 12.1.9 RECON Petro Technologies Ltd
- 12.1.9.1. Company Overview
- 12.1.9.2. Products
- 12.1.9.3. Company Financials
- 12.1.9.4. SWOT Analysis
- 12.1.1 Superior Energy Services Inc
- 12.2. Market Entropy
- 12.2.1 Company's Key Areas Served
- 12.2.2 Recent Developments
- 12.3. Company Market Share Analysis 2025
- 12.3.1 Top 5 Companies Market Share Analysis
- 12.3.2 Top 3 Companies Market Share Analysis
- 12.4. List of Potential Customers
- 13. Research Methodology
List of Figures
- Figure 1: Global US Wireline Logging Services Industry Revenue Breakdown (billion, %) by Region 2025 & 2033
- Figure 2: North America US Wireline Logging Services Industry Revenue (billion), by Deployment 2025 & 2033
- Figure 3: North America US Wireline Logging Services Industry Revenue Share (%), by Deployment 2025 & 2033
- Figure 4: North America US Wireline Logging Services Industry Revenue (billion), by Type (Qualitative Analysis Only) 2025 & 2033
- Figure 5: North America US Wireline Logging Services Industry Revenue Share (%), by Type (Qualitative Analysis Only) 2025 & 2033
- Figure 6: North America US Wireline Logging Services Industry Revenue (billion), by Hole Type (Qualitative Analysis Only) 2025 & 2033
- Figure 7: North America US Wireline Logging Services Industry Revenue Share (%), by Hole Type (Qualitative Analysis Only) 2025 & 2033
- Figure 8: North America US Wireline Logging Services Industry Revenue (billion), by Country 2025 & 2033
- Figure 9: North America US Wireline Logging Services Industry Revenue Share (%), by Country 2025 & 2033
- Figure 10: South America US Wireline Logging Services Industry Revenue (billion), by Deployment 2025 & 2033
- Figure 11: South America US Wireline Logging Services Industry Revenue Share (%), by Deployment 2025 & 2033
- Figure 12: South America US Wireline Logging Services Industry Revenue (billion), by Type (Qualitative Analysis Only) 2025 & 2033
- Figure 13: South America US Wireline Logging Services Industry Revenue Share (%), by Type (Qualitative Analysis Only) 2025 & 2033
- Figure 14: South America US Wireline Logging Services Industry Revenue (billion), by Hole Type (Qualitative Analysis Only) 2025 & 2033
- Figure 15: South America US Wireline Logging Services Industry Revenue Share (%), by Hole Type (Qualitative Analysis Only) 2025 & 2033
- Figure 16: South America US Wireline Logging Services Industry Revenue (billion), by Country 2025 & 2033
- Figure 17: South America US Wireline Logging Services Industry Revenue Share (%), by Country 2025 & 2033
- Figure 18: Europe US Wireline Logging Services Industry Revenue (billion), by Deployment 2025 & 2033
- Figure 19: Europe US Wireline Logging Services Industry Revenue Share (%), by Deployment 2025 & 2033
- Figure 20: Europe US Wireline Logging Services Industry Revenue (billion), by Type (Qualitative Analysis Only) 2025 & 2033
- Figure 21: Europe US Wireline Logging Services Industry Revenue Share (%), by Type (Qualitative Analysis Only) 2025 & 2033
- Figure 22: Europe US Wireline Logging Services Industry Revenue (billion), by Hole Type (Qualitative Analysis Only) 2025 & 2033
- Figure 23: Europe US Wireline Logging Services Industry Revenue Share (%), by Hole Type (Qualitative Analysis Only) 2025 & 2033
- Figure 24: Europe US Wireline Logging Services Industry Revenue (billion), by Country 2025 & 2033
- Figure 25: Europe US Wireline Logging Services Industry Revenue Share (%), by Country 2025 & 2033
- Figure 26: Middle East & Africa US Wireline Logging Services Industry Revenue (billion), by Deployment 2025 & 2033
- Figure 27: Middle East & Africa US Wireline Logging Services Industry Revenue Share (%), by Deployment 2025 & 2033
- Figure 28: Middle East & Africa US Wireline Logging Services Industry Revenue (billion), by Type (Qualitative Analysis Only) 2025 & 2033
- Figure 29: Middle East & Africa US Wireline Logging Services Industry Revenue Share (%), by Type (Qualitative Analysis Only) 2025 & 2033
- Figure 30: Middle East & Africa US Wireline Logging Services Industry Revenue (billion), by Hole Type (Qualitative Analysis Only) 2025 & 2033
- Figure 31: Middle East & Africa US Wireline Logging Services Industry Revenue Share (%), by Hole Type (Qualitative Analysis Only) 2025 & 2033
- Figure 32: Middle East & Africa US Wireline Logging Services Industry Revenue (billion), by Country 2025 & 2033
- Figure 33: Middle East & Africa US Wireline Logging Services Industry Revenue Share (%), by Country 2025 & 2033
- Figure 34: Asia Pacific US Wireline Logging Services Industry Revenue (billion), by Deployment 2025 & 2033
- Figure 35: Asia Pacific US Wireline Logging Services Industry Revenue Share (%), by Deployment 2025 & 2033
- Figure 36: Asia Pacific US Wireline Logging Services Industry Revenue (billion), by Type (Qualitative Analysis Only) 2025 & 2033
- Figure 37: Asia Pacific US Wireline Logging Services Industry Revenue Share (%), by Type (Qualitative Analysis Only) 2025 & 2033
- Figure 38: Asia Pacific US Wireline Logging Services Industry Revenue (billion), by Hole Type (Qualitative Analysis Only) 2025 & 2033
- Figure 39: Asia Pacific US Wireline Logging Services Industry Revenue Share (%), by Hole Type (Qualitative Analysis Only) 2025 & 2033
- Figure 40: Asia Pacific US Wireline Logging Services Industry Revenue (billion), by Country 2025 & 2033
- Figure 41: Asia Pacific US Wireline Logging Services Industry Revenue Share (%), by Country 2025 & 2033
List of Tables
- Table 1: Global US Wireline Logging Services Industry Revenue billion Forecast, by Deployment 2020 & 2033
- Table 2: Global US Wireline Logging Services Industry Revenue billion Forecast, by Type (Qualitative Analysis Only) 2020 & 2033
- Table 3: Global US Wireline Logging Services Industry Revenue billion Forecast, by Hole Type (Qualitative Analysis Only) 2020 & 2033
- Table 4: Global US Wireline Logging Services Industry Revenue billion Forecast, by Region 2020 & 2033
- Table 5: Global US Wireline Logging Services Industry Revenue billion Forecast, by Deployment 2020 & 2033
- Table 6: Global US Wireline Logging Services Industry Revenue billion Forecast, by Type (Qualitative Analysis Only) 2020 & 2033
- Table 7: Global US Wireline Logging Services Industry Revenue billion Forecast, by Hole Type (Qualitative Analysis Only) 2020 & 2033
- Table 8: Global US Wireline Logging Services Industry Revenue billion Forecast, by Country 2020 & 2033
- Table 9: United States US Wireline Logging Services Industry Revenue (billion) Forecast, by Application 2020 & 2033
- Table 10: Canada US Wireline Logging Services Industry Revenue (billion) Forecast, by Application 2020 & 2033
- Table 11: Mexico US Wireline Logging Services Industry Revenue (billion) Forecast, by Application 2020 & 2033
- Table 12: Global US Wireline Logging Services Industry Revenue billion Forecast, by Deployment 2020 & 2033
- Table 13: Global US Wireline Logging Services Industry Revenue billion Forecast, by Type (Qualitative Analysis Only) 2020 & 2033
- Table 14: Global US Wireline Logging Services Industry Revenue billion Forecast, by Hole Type (Qualitative Analysis Only) 2020 & 2033
- Table 15: Global US Wireline Logging Services Industry Revenue billion Forecast, by Country 2020 & 2033
- Table 16: Brazil US Wireline Logging Services Industry Revenue (billion) Forecast, by Application 2020 & 2033
- Table 17: Argentina US Wireline Logging Services Industry Revenue (billion) Forecast, by Application 2020 & 2033
- Table 18: Rest of South America US Wireline Logging Services Industry Revenue (billion) Forecast, by Application 2020 & 2033
- Table 19: Global US Wireline Logging Services Industry Revenue billion Forecast, by Deployment 2020 & 2033
- Table 20: Global US Wireline Logging Services Industry Revenue billion Forecast, by Type (Qualitative Analysis Only) 2020 & 2033
- Table 21: Global US Wireline Logging Services Industry Revenue billion Forecast, by Hole Type (Qualitative Analysis Only) 2020 & 2033
- Table 22: Global US Wireline Logging Services Industry Revenue billion Forecast, by Country 2020 & 2033
- Table 23: United Kingdom US Wireline Logging Services Industry Revenue (billion) Forecast, by Application 2020 & 2033
- Table 24: Germany US Wireline Logging Services Industry Revenue (billion) Forecast, by Application 2020 & 2033
- Table 25: France US Wireline Logging Services Industry Revenue (billion) Forecast, by Application 2020 & 2033
- Table 26: Italy US Wireline Logging Services Industry Revenue (billion) Forecast, by Application 2020 & 2033
- Table 27: Spain US Wireline Logging Services Industry Revenue (billion) Forecast, by Application 2020 & 2033
- Table 28: Russia US Wireline Logging Services Industry Revenue (billion) Forecast, by Application 2020 & 2033
- Table 29: Benelux US Wireline Logging Services Industry Revenue (billion) Forecast, by Application 2020 & 2033
- Table 30: Nordics US Wireline Logging Services Industry Revenue (billion) Forecast, by Application 2020 & 2033
- Table 31: Rest of Europe US Wireline Logging Services Industry Revenue (billion) Forecast, by Application 2020 & 2033
- Table 32: Global US Wireline Logging Services Industry Revenue billion Forecast, by Deployment 2020 & 2033
- Table 33: Global US Wireline Logging Services Industry Revenue billion Forecast, by Type (Qualitative Analysis Only) 2020 & 2033
- Table 34: Global US Wireline Logging Services Industry Revenue billion Forecast, by Hole Type (Qualitative Analysis Only) 2020 & 2033
- Table 35: Global US Wireline Logging Services Industry Revenue billion Forecast, by Country 2020 & 2033
- Table 36: Turkey US Wireline Logging Services Industry Revenue (billion) Forecast, by Application 2020 & 2033
- Table 37: Israel US Wireline Logging Services Industry Revenue (billion) Forecast, by Application 2020 & 2033
- Table 38: GCC US Wireline Logging Services Industry Revenue (billion) Forecast, by Application 2020 & 2033
- Table 39: North Africa US Wireline Logging Services Industry Revenue (billion) Forecast, by Application 2020 & 2033
- Table 40: South Africa US Wireline Logging Services Industry Revenue (billion) Forecast, by Application 2020 & 2033
- Table 41: Rest of Middle East & Africa US Wireline Logging Services Industry Revenue (billion) Forecast, by Application 2020 & 2033
- Table 42: Global US Wireline Logging Services Industry Revenue billion Forecast, by Deployment 2020 & 2033
- Table 43: Global US Wireline Logging Services Industry Revenue billion Forecast, by Type (Qualitative Analysis Only) 2020 & 2033
- Table 44: Global US Wireline Logging Services Industry Revenue billion Forecast, by Hole Type (Qualitative Analysis Only) 2020 & 2033
- Table 45: Global US Wireline Logging Services Industry Revenue billion Forecast, by Country 2020 & 2033
- Table 46: China US Wireline Logging Services Industry Revenue (billion) Forecast, by Application 2020 & 2033
- Table 47: India US Wireline Logging Services Industry Revenue (billion) Forecast, by Application 2020 & 2033
- Table 48: Japan US Wireline Logging Services Industry Revenue (billion) Forecast, by Application 2020 & 2033
- Table 49: South Korea US Wireline Logging Services Industry Revenue (billion) Forecast, by Application 2020 & 2033
- Table 50: ASEAN US Wireline Logging Services Industry Revenue (billion) Forecast, by Application 2020 & 2033
- Table 51: Oceania US Wireline Logging Services Industry Revenue (billion) Forecast, by Application 2020 & 2033
- Table 52: Rest of Asia Pacific US Wireline Logging Services Industry Revenue (billion) Forecast, by Application 2020 & 2033
Frequently Asked Questions
1. What is the projected Compound Annual Growth Rate (CAGR) of the US Wireline Logging Services Industry?
The projected CAGR is approximately 7.1%.
2. Which companies are prominent players in the US Wireline Logging Services Industry?
Key companies in the market include Superior Energy Services Inc, Pioneer Energy Services Corp, Expro Group, NexTier Oilfield Solution Inc, Weatherford International PLC, Baker Hughes Company, Halliburton Company, Schlumberger Limited, RECON Petro Technologies Ltd.
3. What are the main segments of the US Wireline Logging Services Industry?
The market segments include Deployment, Type (Qualitative Analysis Only), Hole Type (Qualitative Analysis Only).
4. Can you provide details about the market size?
The market size is estimated to be USD 12.1 billion as of 2022.
5. What are some drivers contributing to market growth?
4.; Increasing Automotive Sales in Saudi Arabia4.; Rising Demand from Heavy Automotives.
6. What are the notable trends driving market growth?
Onshore Segment to Dominate the Market.
7. Are there any restraints impacting market growth?
4.; Rising Emphasis on Electric Vehicles.
8. Can you provide examples of recent developments in the market?
In May 2022: Caliber Completion Services, LLC acquired all the wireline assets substantially from ClearWell Dynamics, LLC's subsidiary, formerly known as Pioneer Wireline Services, LLC.
9. What pricing options are available for accessing the report?
Pricing options include single-user, multi-user, and enterprise licenses priced at USD 3800, USD 4500, and USD 5800 respectively.
10. Is the market size provided in terms of value or volume?
The market size is provided in terms of value, measured in billion.
11. Are there any specific market keywords associated with the report?
Yes, the market keyword associated with the report is "US Wireline Logging Services Industry," which aids in identifying and referencing the specific market segment covered.
12. How do I determine which pricing option suits my needs best?
The pricing options vary based on user requirements and access needs. Individual users may opt for single-user licenses, while businesses requiring broader access may choose multi-user or enterprise licenses for cost-effective access to the report.
13. Are there any additional resources or data provided in the US Wireline Logging Services Industry report?
While the report offers comprehensive insights, it's advisable to review the specific contents or supplementary materials provided to ascertain if additional resources or data are available.
14. How can I stay updated on further developments or reports in the US Wireline Logging Services Industry?
To stay informed about further developments, trends, and reports in the US Wireline Logging Services Industry, consider subscribing to industry newsletters, following relevant companies and organizations, or regularly checking reputable industry news sources and publications.
Methodology
Step 1 - Identification of Relevant Samples Size from Population Database


Step 2 - Approaches for Defining Global Market Size (Value, Volume* & Price*)

Note*: In applicable scenarios
Step 3 - Data Sources
Primary Research
- Web Analytics
- Survey Reports
- Research Institute
- Latest Research Reports
- Opinion Leaders
Secondary Research
- Annual Reports
- White Paper
- Latest Press Release
- Industry Association
- Paid Database
- Investor Presentations

Step 4 - Data Triangulation
Involves using different sources of information in order to increase the validity of a study
These sources are likely to be stakeholders in a program - participants, other researchers, program staff, other community members, and so on.
Then we put all data in single framework & apply various statistical tools to find out the dynamic on the market.
During the analysis stage, feedback from the stakeholder groups would be compared to determine areas of agreement as well as areas of divergence