
Key Insights
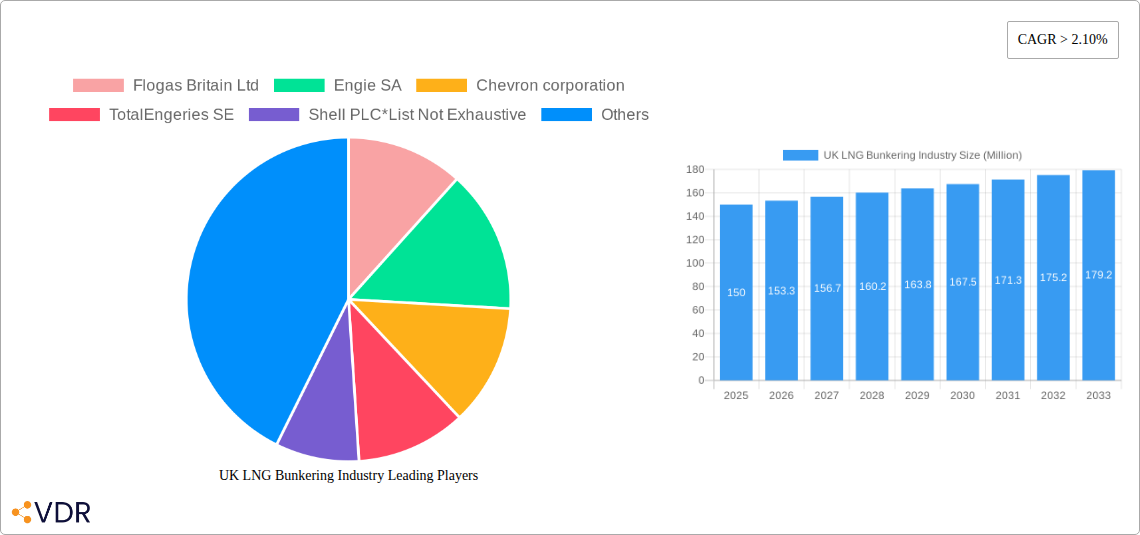
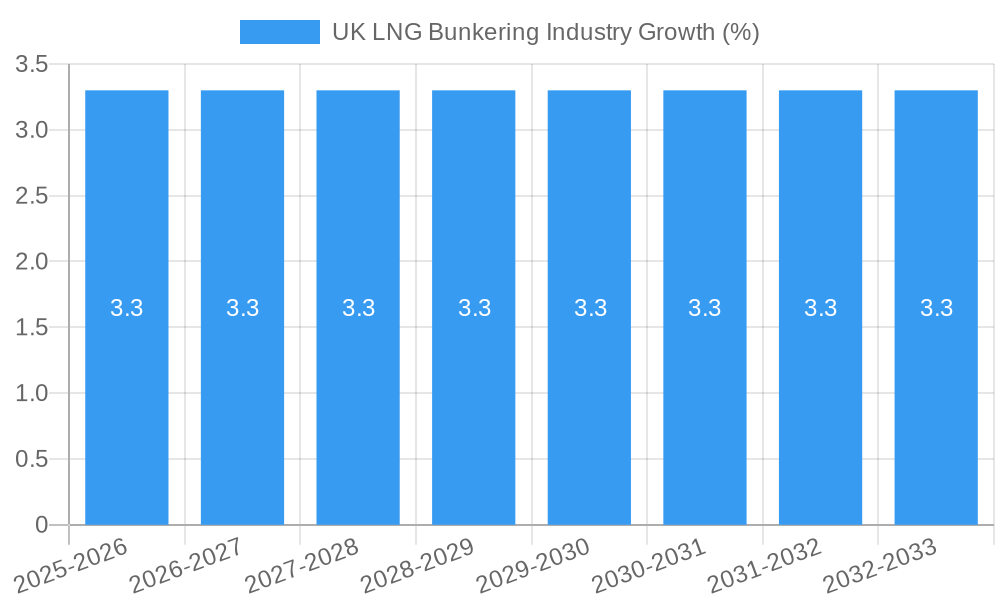
The UK LNG bunkering industry is poised for significant growth, driven by increasing environmental regulations aimed at reducing greenhouse gas emissions from shipping and a growing demand for cleaner fuels. The market, currently estimated to be valued at approximately £150 million in 2025 (this is an estimation based on a similar-sized European market and the UK's relative economic strength), is projected to experience a Compound Annual Growth Rate (CAGR) of over 2.10% through 2033. This expansion is fueled by several key factors, including the increasing adoption of LNG as a marine fuel by shipping companies aiming to meet stringent emissions targets (such as the IMO 2020 sulfur cap and future decarbonization goals), and government incentives promoting the use of cleaner alternatives in port operations. Growth is particularly evident in segments serving the shipping and transportation sectors, with major ports investing in LNG bunkering infrastructure to cater to the growing demand. Key players like Flogas Britain Ltd, Engie SA, and global energy giants are actively involved, investing in infrastructure and supply chains to capitalize on this burgeoning market.
However, the market faces certain challenges. Initial infrastructure investment costs for LNG bunkering facilities are substantial, potentially hindering rapid expansion. Price volatility in the global LNG market and the availability of LNG supply will also affect industry growth, particularly considering geopolitical events that could constrain supply chains. Despite these restraints, the long-term outlook for the UK LNG bunkering industry remains positive, with considerable opportunities for growth driven by environmental regulations, increasing demand from the shipping sector, and strategic investments from major players within the industry. The focus on sustainable shipping and growing public awareness of environmental issues contribute to a stronger, steadily increasing demand for LNG as a transition fuel.
UK LNG Bunkering Industry Market Report: 2019-2033
This comprehensive report provides a detailed analysis of the UK LNG bunkering industry, encompassing market dynamics, growth trends, competitive landscape, and future outlook. The report covers the parent market of LNG bunkering and the child markets of natural gas and bio-LNG applications within shipping, ports, and transportation sectors. The study period spans from 2019 to 2033, with 2025 serving as the base and estimated year. This in-depth analysis is crucial for industry professionals, investors, and stakeholders seeking to navigate this rapidly evolving market.
UK LNG Bunkering Industry Market Dynamics & Structure
The UK LNG bunkering market is characterized by moderate concentration, with key players including Flogas Britain Ltd, Engie SA, Chevron corporation, TotalEnergies SE, and Shell PLC. However, the market also features numerous smaller players and emerging entrants. Technological innovation, driven by advancements in LNG storage and handling technologies, plays a pivotal role. Stringent environmental regulations, aimed at reducing shipping emissions, are key drivers. The market faces competition from traditional marine fuels, but the increasing focus on sustainability is shifting the balance. End-user demographics are predominantly large shipping companies and port authorities.
- Market Concentration: Moderate, with a few dominant players and numerous smaller participants. Market share data for 2024: Shell PLC (25%), Engie SA (18%), Chevron Corporation (15%), Others (42%).
- Technological Innovation: Significant investment in LNG bunkering infrastructure and vessel technology is driving market growth.
- Regulatory Framework: Stringent emission regulations are pushing adoption of LNG as a cleaner fuel.
- Competitive Substitutes: Traditional marine fuels (HFO, MDO) remain competitive, but their market share is expected to decline.
- M&A Trends: A moderate number of M&A deals in recent years focused on infrastructure development and expansion into new markets. Estimated 2022 M&A deal value: £xx million.
- Innovation Barriers: High capital expenditure for infrastructure development and stringent safety regulations.
UK LNG Bunkering Industry Growth Trends & Insights
The UK LNG bunkering market experienced significant growth during the historical period (2019-2024), driven primarily by environmental regulations and increasing awareness of the need to reduce greenhouse gas emissions from shipping. The market size increased from £xx million in 2019 to £xx million in 2024, reflecting a Compound Annual Growth Rate (CAGR) of xx%. Market penetration of LNG as a marine fuel remains relatively low but is expected to accelerate in the forecast period (2025-2033). The adoption of LNG bunkering is anticipated to be faster in larger ports and by major shipping companies due to their greater financial resources and compliance needs. Technological disruptions, such as the development of bio-LNG and improved LNG bunkering technologies, will further propel market expansion. Consumer behavior shifts towards sustainable shipping practices will also increase demand for LNG bunkering services. The market is expected to reach £xx million by 2033, showing a CAGR of xx% for the forecast period.
Dominant Regions, Countries, or Segments in UK LNG Bunkering Industry
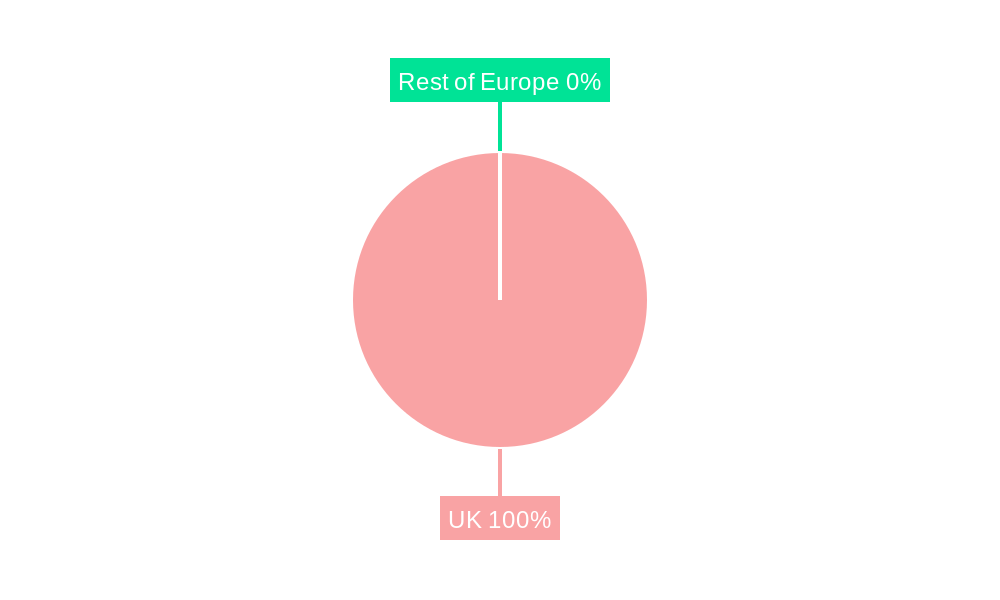
The South East of England is currently the dominant region in the UK LNG bunkering industry, driven by the high concentration of major ports, including London Gateway and Southampton. The Shipping segment, under the Application category, is currently the largest market segment, driven by the increasing adoption of LNG as a fuel source by major shipping lines committed to reducing their environmental impact. Within products, Natural Gas currently dominates, but Bio-LNG is poised for rapid growth due to its potential to achieve carbon neutrality.
Key Drivers:
- Government Policies: Incentives and regulations aimed at reducing greenhouse gas emissions from shipping.
- Port Infrastructure: Investment in LNG bunkering infrastructure in major ports.
- Shipping Company Initiatives: Commitment of major shipping companies to adopt LNG as a fuel.
Dominance Factors:
- Strategic Location: High concentration of shipping activity in the South East England.
- Existing Infrastructure: Presence of existing LNG import terminals.
- Government Support: Favorable regulatory environment and policy support.
UK LNG Bunkering Industry Product Landscape
The UK LNG bunkering market offers both natural gas and bio-LNG. Natural gas LNG provides a significant reduction in greenhouse gas emissions compared to traditional marine fuels. Bio-LNG offers further environmental benefits by being a renewable, carbon-neutral fuel. Technological advancements focus on improving LNG storage and handling technologies, including the development of smaller, more efficient bunkering vessels. The unique selling proposition for bio-LNG is its sustainability credentials, attracting environmentally conscious shipping companies.
Key Drivers, Barriers & Challenges in UK LNG Bunkering Industry
Key Drivers:
- Environmental Regulations: Stringent regulations aimed at reducing emissions from shipping are pushing the adoption of LNG.
- Cost Competitiveness: LNG is becoming increasingly price-competitive with traditional marine fuels in certain market segments.
- Technological Advancements: Improvements in LNG storage and handling technologies are enhancing the feasibility of LNG bunkering.
Challenges & Restraints:
- Infrastructure Development: High capital expenditure required for building LNG bunkering infrastructure presents a significant barrier.
- Regulatory Hurdles: Complex permitting processes and safety regulations can delay project implementation.
- Supply Chain Issues: Ensuring a stable supply of LNG to bunkering facilities can pose a challenge.
Emerging Opportunities in UK LNG Bunkering Industry
- Bio-LNG Expansion: Growing demand for sustainable fuels will drive the expansion of bio-LNG bunkering.
- Small-scale Bunkering: Development of solutions for small-scale LNG bunkering will open up new market opportunities.
- Bunkering in Smaller Ports: Expanding LNG bunkering services to smaller ports will enhance accessibility and utilization.
Growth Accelerators in the UK LNG Bunkering Industry
Technological breakthroughs in LNG storage and handling, combined with strategic partnerships between LNG suppliers, ship owners, and port authorities, will significantly accelerate market growth. The expansion of LNG bunkering services to more ports and the increasing adoption of LNG as a fuel source by shipping companies represent significant growth opportunities.
Key Players Shaping the UK LNG Bunkering Industry Market
- Flogas Britain Ltd
- Engie SA
- Chevron corporation
- TotalEnergies SE
- Shell PLC
- List Not Exhaustive
Notable Milestones in UK LNG Bunkering Industry Sector
- May 2022: Avenir LNG announced the delivery of the Avenir Achievement, the second 20,000 cbm dual-purpose LNG supply and bunkering vessel from the Nantong CIMC Sinopacific Offshore & Engineering. This marked a significant step forward in the expansion of LNG bunkering infrastructure.
In-Depth UK LNG Bunkering Industry Market Outlook
The UK LNG bunkering market is poised for substantial growth in the coming years, driven by favorable government policies, technological advancements, and increasing environmental concerns. Strategic partnerships and investments in infrastructure will further accelerate market expansion. The growing adoption of LNG as a cleaner fuel source by shipping companies presents significant opportunities for market players. The market's future potential is substantial, with the possibility of significant market share gains for companies strategically positioned to capitalize on these trends.
UK LNG Bunkering Industry Segmentation
- 1. Tanker Fleet
- 2. Container Fleet
- 3. Bulk and General Cargo Fleet
- 4. Ferries and OSV
- 5. Others
UK LNG Bunkering Industry Segmentation By Geography
-
1. North America
- 1.1. United States
- 1.2. Canada
- 1.3. Mexico
-
2. South America
- 2.1. Brazil
- 2.2. Argentina
- 2.3. Rest of South America
-
3. Europe
- 3.1. United Kingdom
- 3.2. Germany
- 3.3. France
- 3.4. Italy
- 3.5. Spain
- 3.6. Russia
- 3.7. Benelux
- 3.8. Nordics
- 3.9. Rest of Europe
-
4. Middle East & Africa
- 4.1. Turkey
- 4.2. Israel
- 4.3. GCC
- 4.4. North Africa
- 4.5. South Africa
- 4.6. Rest of Middle East & Africa
-
5. Asia Pacific
- 5.1. China
- 5.2. India
- 5.3. Japan
- 5.4. South Korea
- 5.5. ASEAN
- 5.6. Oceania
- 5.7. Rest of Asia Pacific
UK LNG Bunkering Industry REPORT HIGHLIGHTS
| Aspects | Details |
|---|---|
| Study Period | 2019-2033 |
| Base Year | 2024 |
| Estimated Year | 2025 |
| Forecast Period | 2025-2033 |
| Historical Period | 2019-2024 |
| Growth Rate | CAGR of > 2.10% from 2019-2033 |
| Segmentation |
|
Table of Contents
- 1. Introduction
- 1.1. Research Scope
- 1.2. Market Segmentation
- 1.3. Research Methodology
- 1.4. Definitions and Assumptions
- 2. Executive Summary
- 2.1. Introduction
- 3. Market Dynamics
- 3.1. Introduction
- 3.2. Market Drivers
- 3.2.1. 4.; Increase in the Demand for Electricity4.; Rising Adoption of Electric Vehicles
- 3.3. Market Restrains
- 3.3.1. 4.; New Sources of Distributed Electricity Generation
- 3.4. Market Trends
- 3.4.1. Ferries and OSV Segment to Dominate the Market
- 4. Market Factor Analysis
- 4.1. Porters Five Forces
- 4.2. Supply/Value Chain
- 4.3. PESTEL analysis
- 4.4. Market Entropy
- 4.5. Patent/Trademark Analysis
- 5. Global UK LNG Bunkering Industry Analysis, Insights and Forecast, 2019-2031
- 5.1. Market Analysis, Insights and Forecast - by Tanker Fleet
- 5.2. Market Analysis, Insights and Forecast - by Container Fleet
- 5.3. Market Analysis, Insights and Forecast - by Bulk and General Cargo Fleet
- 5.4. Market Analysis, Insights and Forecast - by Ferries and OSV
- 5.5. Market Analysis, Insights and Forecast - by Others
- 5.6. Market Analysis, Insights and Forecast - by Region
- 5.6.1. North America
- 5.6.2. South America
- 5.6.3. Europe
- 5.6.4. Middle East & Africa
- 5.6.5. Asia Pacific
- 5.1. Market Analysis, Insights and Forecast - by Tanker Fleet
- 6. North America UK LNG Bunkering Industry Analysis, Insights and Forecast, 2019-2031
- 6.1. Market Analysis, Insights and Forecast - by Tanker Fleet
- 6.2. Market Analysis, Insights and Forecast - by Container Fleet
- 6.3. Market Analysis, Insights and Forecast - by Bulk and General Cargo Fleet
- 6.4. Market Analysis, Insights and Forecast - by Ferries and OSV
- 6.5. Market Analysis, Insights and Forecast - by Others
- 6.1. Market Analysis, Insights and Forecast - by Tanker Fleet
- 7. South America UK LNG Bunkering Industry Analysis, Insights and Forecast, 2019-2031
- 7.1. Market Analysis, Insights and Forecast - by Tanker Fleet
- 7.2. Market Analysis, Insights and Forecast - by Container Fleet
- 7.3. Market Analysis, Insights and Forecast - by Bulk and General Cargo Fleet
- 7.4. Market Analysis, Insights and Forecast - by Ferries and OSV
- 7.5. Market Analysis, Insights and Forecast - by Others
- 7.1. Market Analysis, Insights and Forecast - by Tanker Fleet
- 8. Europe UK LNG Bunkering Industry Analysis, Insights and Forecast, 2019-2031
- 8.1. Market Analysis, Insights and Forecast - by Tanker Fleet
- 8.2. Market Analysis, Insights and Forecast - by Container Fleet
- 8.3. Market Analysis, Insights and Forecast - by Bulk and General Cargo Fleet
- 8.4. Market Analysis, Insights and Forecast - by Ferries and OSV
- 8.5. Market Analysis, Insights and Forecast - by Others
- 8.1. Market Analysis, Insights and Forecast - by Tanker Fleet
- 9. Middle East & Africa UK LNG Bunkering Industry Analysis, Insights and Forecast, 2019-2031
- 9.1. Market Analysis, Insights and Forecast - by Tanker Fleet
- 9.2. Market Analysis, Insights and Forecast - by Container Fleet
- 9.3. Market Analysis, Insights and Forecast - by Bulk and General Cargo Fleet
- 9.4. Market Analysis, Insights and Forecast - by Ferries and OSV
- 9.5. Market Analysis, Insights and Forecast - by Others
- 9.1. Market Analysis, Insights and Forecast - by Tanker Fleet
- 10. Asia Pacific UK LNG Bunkering Industry Analysis, Insights and Forecast, 2019-2031
- 10.1. Market Analysis, Insights and Forecast - by Tanker Fleet
- 10.2. Market Analysis, Insights and Forecast - by Container Fleet
- 10.3. Market Analysis, Insights and Forecast - by Bulk and General Cargo Fleet
- 10.4. Market Analysis, Insights and Forecast - by Ferries and OSV
- 10.5. Market Analysis, Insights and Forecast - by Others
- 10.1. Market Analysis, Insights and Forecast - by Tanker Fleet
- 11. Germany UK LNG Bunkering Industry Analysis, Insights and Forecast, 2019-2031
- 12. France UK LNG Bunkering Industry Analysis, Insights and Forecast, 2019-2031
- 13. Italy UK LNG Bunkering Industry Analysis, Insights and Forecast, 2019-2031
- 14. United Kingdom UK LNG Bunkering Industry Analysis, Insights and Forecast, 2019-2031
- 15. Netherlands UK LNG Bunkering Industry Analysis, Insights and Forecast, 2019-2031
- 16. Rest of Europe UK LNG Bunkering Industry Analysis, Insights and Forecast, 2019-2031
- 17. Competitive Analysis
- 17.1. Global Market Share Analysis 2024
- 17.2. Company Profiles
- 17.2.1 Flogas Britain Ltd
- 17.2.1.1. Overview
- 17.2.1.2. Products
- 17.2.1.3. SWOT Analysis
- 17.2.1.4. Recent Developments
- 17.2.1.5. Financials (Based on Availability)
- 17.2.2 Engie SA
- 17.2.2.1. Overview
- 17.2.2.2. Products
- 17.2.2.3. SWOT Analysis
- 17.2.2.4. Recent Developments
- 17.2.2.5. Financials (Based on Availability)
- 17.2.3 Chevron corporation
- 17.2.3.1. Overview
- 17.2.3.2. Products
- 17.2.3.3. SWOT Analysis
- 17.2.3.4. Recent Developments
- 17.2.3.5. Financials (Based on Availability)
- 17.2.4 TotalEngeries SE
- 17.2.4.1. Overview
- 17.2.4.2. Products
- 17.2.4.3. SWOT Analysis
- 17.2.4.4. Recent Developments
- 17.2.4.5. Financials (Based on Availability)
- 17.2.5 Shell PLC*List Not Exhaustive
- 17.2.5.1. Overview
- 17.2.5.2. Products
- 17.2.5.3. SWOT Analysis
- 17.2.5.4. Recent Developments
- 17.2.5.5. Financials (Based on Availability)
- 17.2.1 Flogas Britain Ltd
List of Figures
- Figure 1: Global UK LNG Bunkering Industry Revenue Breakdown (Million, %) by Region 2024 & 2032
- Figure 2: Europe UK LNG Bunkering Industry Revenue (Million), by Country 2024 & 2032
- Figure 3: Europe UK LNG Bunkering Industry Revenue Share (%), by Country 2024 & 2032
- Figure 4: North America UK LNG Bunkering Industry Revenue (Million), by Tanker Fleet 2024 & 2032
- Figure 5: North America UK LNG Bunkering Industry Revenue Share (%), by Tanker Fleet 2024 & 2032
- Figure 6: North America UK LNG Bunkering Industry Revenue (Million), by Container Fleet 2024 & 2032
- Figure 7: North America UK LNG Bunkering Industry Revenue Share (%), by Container Fleet 2024 & 2032
- Figure 8: North America UK LNG Bunkering Industry Revenue (Million), by Bulk and General Cargo Fleet 2024 & 2032
- Figure 9: North America UK LNG Bunkering Industry Revenue Share (%), by Bulk and General Cargo Fleet 2024 & 2032
- Figure 10: North America UK LNG Bunkering Industry Revenue (Million), by Ferries and OSV 2024 & 2032
- Figure 11: North America UK LNG Bunkering Industry Revenue Share (%), by Ferries and OSV 2024 & 2032
- Figure 12: North America UK LNG Bunkering Industry Revenue (Million), by Others 2024 & 2032
- Figure 13: North America UK LNG Bunkering Industry Revenue Share (%), by Others 2024 & 2032
- Figure 14: North America UK LNG Bunkering Industry Revenue (Million), by Country 2024 & 2032
- Figure 15: North America UK LNG Bunkering Industry Revenue Share (%), by Country 2024 & 2032
- Figure 16: South America UK LNG Bunkering Industry Revenue (Million), by Tanker Fleet 2024 & 2032
- Figure 17: South America UK LNG Bunkering Industry Revenue Share (%), by Tanker Fleet 2024 & 2032
- Figure 18: South America UK LNG Bunkering Industry Revenue (Million), by Container Fleet 2024 & 2032
- Figure 19: South America UK LNG Bunkering Industry Revenue Share (%), by Container Fleet 2024 & 2032
- Figure 20: South America UK LNG Bunkering Industry Revenue (Million), by Bulk and General Cargo Fleet 2024 & 2032
- Figure 21: South America UK LNG Bunkering Industry Revenue Share (%), by Bulk and General Cargo Fleet 2024 & 2032
- Figure 22: South America UK LNG Bunkering Industry Revenue (Million), by Ferries and OSV 2024 & 2032
- Figure 23: South America UK LNG Bunkering Industry Revenue Share (%), by Ferries and OSV 2024 & 2032
- Figure 24: South America UK LNG Bunkering Industry Revenue (Million), by Others 2024 & 2032
- Figure 25: South America UK LNG Bunkering Industry Revenue Share (%), by Others 2024 & 2032
- Figure 26: South America UK LNG Bunkering Industry Revenue (Million), by Country 2024 & 2032
- Figure 27: South America UK LNG Bunkering Industry Revenue Share (%), by Country 2024 & 2032
- Figure 28: Europe UK LNG Bunkering Industry Revenue (Million), by Tanker Fleet 2024 & 2032
- Figure 29: Europe UK LNG Bunkering Industry Revenue Share (%), by Tanker Fleet 2024 & 2032
- Figure 30: Europe UK LNG Bunkering Industry Revenue (Million), by Container Fleet 2024 & 2032
- Figure 31: Europe UK LNG Bunkering Industry Revenue Share (%), by Container Fleet 2024 & 2032
- Figure 32: Europe UK LNG Bunkering Industry Revenue (Million), by Bulk and General Cargo Fleet 2024 & 2032
- Figure 33: Europe UK LNG Bunkering Industry Revenue Share (%), by Bulk and General Cargo Fleet 2024 & 2032
- Figure 34: Europe UK LNG Bunkering Industry Revenue (Million), by Ferries and OSV 2024 & 2032
- Figure 35: Europe UK LNG Bunkering Industry Revenue Share (%), by Ferries and OSV 2024 & 2032
- Figure 36: Europe UK LNG Bunkering Industry Revenue (Million), by Others 2024 & 2032
- Figure 37: Europe UK LNG Bunkering Industry Revenue Share (%), by Others 2024 & 2032
- Figure 38: Europe UK LNG Bunkering Industry Revenue (Million), by Country 2024 & 2032
- Figure 39: Europe UK LNG Bunkering Industry Revenue Share (%), by Country 2024 & 2032
- Figure 40: Middle East & Africa UK LNG Bunkering Industry Revenue (Million), by Tanker Fleet 2024 & 2032
- Figure 41: Middle East & Africa UK LNG Bunkering Industry Revenue Share (%), by Tanker Fleet 2024 & 2032
- Figure 42: Middle East & Africa UK LNG Bunkering Industry Revenue (Million), by Container Fleet 2024 & 2032
- Figure 43: Middle East & Africa UK LNG Bunkering Industry Revenue Share (%), by Container Fleet 2024 & 2032
- Figure 44: Middle East & Africa UK LNG Bunkering Industry Revenue (Million), by Bulk and General Cargo Fleet 2024 & 2032
- Figure 45: Middle East & Africa UK LNG Bunkering Industry Revenue Share (%), by Bulk and General Cargo Fleet 2024 & 2032
- Figure 46: Middle East & Africa UK LNG Bunkering Industry Revenue (Million), by Ferries and OSV 2024 & 2032
- Figure 47: Middle East & Africa UK LNG Bunkering Industry Revenue Share (%), by Ferries and OSV 2024 & 2032
- Figure 48: Middle East & Africa UK LNG Bunkering Industry Revenue (Million), by Others 2024 & 2032
- Figure 49: Middle East & Africa UK LNG Bunkering Industry Revenue Share (%), by Others 2024 & 2032
- Figure 50: Middle East & Africa UK LNG Bunkering Industry Revenue (Million), by Country 2024 & 2032
- Figure 51: Middle East & Africa UK LNG Bunkering Industry Revenue Share (%), by Country 2024 & 2032
- Figure 52: Asia Pacific UK LNG Bunkering Industry Revenue (Million), by Tanker Fleet 2024 & 2032
- Figure 53: Asia Pacific UK LNG Bunkering Industry Revenue Share (%), by Tanker Fleet 2024 & 2032
- Figure 54: Asia Pacific UK LNG Bunkering Industry Revenue (Million), by Container Fleet 2024 & 2032
- Figure 55: Asia Pacific UK LNG Bunkering Industry Revenue Share (%), by Container Fleet 2024 & 2032
- Figure 56: Asia Pacific UK LNG Bunkering Industry Revenue (Million), by Bulk and General Cargo Fleet 2024 & 2032
- Figure 57: Asia Pacific UK LNG Bunkering Industry Revenue Share (%), by Bulk and General Cargo Fleet 2024 & 2032
- Figure 58: Asia Pacific UK LNG Bunkering Industry Revenue (Million), by Ferries and OSV 2024 & 2032
- Figure 59: Asia Pacific UK LNG Bunkering Industry Revenue Share (%), by Ferries and OSV 2024 & 2032
- Figure 60: Asia Pacific UK LNG Bunkering Industry Revenue (Million), by Others 2024 & 2032
- Figure 61: Asia Pacific UK LNG Bunkering Industry Revenue Share (%), by Others 2024 & 2032
- Figure 62: Asia Pacific UK LNG Bunkering Industry Revenue (Million), by Country 2024 & 2032
- Figure 63: Asia Pacific UK LNG Bunkering Industry Revenue Share (%), by Country 2024 & 2032
List of Tables
- Table 1: Global UK LNG Bunkering Industry Revenue Million Forecast, by Region 2019 & 2032
- Table 2: Global UK LNG Bunkering Industry Revenue Million Forecast, by Tanker Fleet 2019 & 2032
- Table 3: Global UK LNG Bunkering Industry Revenue Million Forecast, by Container Fleet 2019 & 2032
- Table 4: Global UK LNG Bunkering Industry Revenue Million Forecast, by Bulk and General Cargo Fleet 2019 & 2032
- Table 5: Global UK LNG Bunkering Industry Revenue Million Forecast, by Ferries and OSV 2019 & 2032
- Table 6: Global UK LNG Bunkering Industry Revenue Million Forecast, by Others 2019 & 2032
- Table 7: Global UK LNG Bunkering Industry Revenue Million Forecast, by Region 2019 & 2032
- Table 8: Global UK LNG Bunkering Industry Revenue Million Forecast, by Country 2019 & 2032
- Table 9: Germany UK LNG Bunkering Industry Revenue (Million) Forecast, by Application 2019 & 2032
- Table 10: France UK LNG Bunkering Industry Revenue (Million) Forecast, by Application 2019 & 2032
- Table 11: Italy UK LNG Bunkering Industry Revenue (Million) Forecast, by Application 2019 & 2032
- Table 12: United Kingdom UK LNG Bunkering Industry Revenue (Million) Forecast, by Application 2019 & 2032
- Table 13: Netherlands UK LNG Bunkering Industry Revenue (Million) Forecast, by Application 2019 & 2032
- Table 14: Rest of Europe UK LNG Bunkering Industry Revenue (Million) Forecast, by Application 2019 & 2032
- Table 15: Global UK LNG Bunkering Industry Revenue Million Forecast, by Tanker Fleet 2019 & 2032
- Table 16: Global UK LNG Bunkering Industry Revenue Million Forecast, by Container Fleet 2019 & 2032
- Table 17: Global UK LNG Bunkering Industry Revenue Million Forecast, by Bulk and General Cargo Fleet 2019 & 2032
- Table 18: Global UK LNG Bunkering Industry Revenue Million Forecast, by Ferries and OSV 2019 & 2032
- Table 19: Global UK LNG Bunkering Industry Revenue Million Forecast, by Others 2019 & 2032
- Table 20: Global UK LNG Bunkering Industry Revenue Million Forecast, by Country 2019 & 2032
- Table 21: United States UK LNG Bunkering Industry Revenue (Million) Forecast, by Application 2019 & 2032
- Table 22: Canada UK LNG Bunkering Industry Revenue (Million) Forecast, by Application 2019 & 2032
- Table 23: Mexico UK LNG Bunkering Industry Revenue (Million) Forecast, by Application 2019 & 2032
- Table 24: Global UK LNG Bunkering Industry Revenue Million Forecast, by Tanker Fleet 2019 & 2032
- Table 25: Global UK LNG Bunkering Industry Revenue Million Forecast, by Container Fleet 2019 & 2032
- Table 26: Global UK LNG Bunkering Industry Revenue Million Forecast, by Bulk and General Cargo Fleet 2019 & 2032
- Table 27: Global UK LNG Bunkering Industry Revenue Million Forecast, by Ferries and OSV 2019 & 2032
- Table 28: Global UK LNG Bunkering Industry Revenue Million Forecast, by Others 2019 & 2032
- Table 29: Global UK LNG Bunkering Industry Revenue Million Forecast, by Country 2019 & 2032
- Table 30: Brazil UK LNG Bunkering Industry Revenue (Million) Forecast, by Application 2019 & 2032
- Table 31: Argentina UK LNG Bunkering Industry Revenue (Million) Forecast, by Application 2019 & 2032
- Table 32: Rest of South America UK LNG Bunkering Industry Revenue (Million) Forecast, by Application 2019 & 2032
- Table 33: Global UK LNG Bunkering Industry Revenue Million Forecast, by Tanker Fleet 2019 & 2032
- Table 34: Global UK LNG Bunkering Industry Revenue Million Forecast, by Container Fleet 2019 & 2032
- Table 35: Global UK LNG Bunkering Industry Revenue Million Forecast, by Bulk and General Cargo Fleet 2019 & 2032
- Table 36: Global UK LNG Bunkering Industry Revenue Million Forecast, by Ferries and OSV 2019 & 2032
- Table 37: Global UK LNG Bunkering Industry Revenue Million Forecast, by Others 2019 & 2032
- Table 38: Global UK LNG Bunkering Industry Revenue Million Forecast, by Country 2019 & 2032
- Table 39: United Kingdom UK LNG Bunkering Industry Revenue (Million) Forecast, by Application 2019 & 2032
- Table 40: Germany UK LNG Bunkering Industry Revenue (Million) Forecast, by Application 2019 & 2032
- Table 41: France UK LNG Bunkering Industry Revenue (Million) Forecast, by Application 2019 & 2032
- Table 42: Italy UK LNG Bunkering Industry Revenue (Million) Forecast, by Application 2019 & 2032
- Table 43: Spain UK LNG Bunkering Industry Revenue (Million) Forecast, by Application 2019 & 2032
- Table 44: Russia UK LNG Bunkering Industry Revenue (Million) Forecast, by Application 2019 & 2032
- Table 45: Benelux UK LNG Bunkering Industry Revenue (Million) Forecast, by Application 2019 & 2032
- Table 46: Nordics UK LNG Bunkering Industry Revenue (Million) Forecast, by Application 2019 & 2032
- Table 47: Rest of Europe UK LNG Bunkering Industry Revenue (Million) Forecast, by Application 2019 & 2032
- Table 48: Global UK LNG Bunkering Industry Revenue Million Forecast, by Tanker Fleet 2019 & 2032
- Table 49: Global UK LNG Bunkering Industry Revenue Million Forecast, by Container Fleet 2019 & 2032
- Table 50: Global UK LNG Bunkering Industry Revenue Million Forecast, by Bulk and General Cargo Fleet 2019 & 2032
- Table 51: Global UK LNG Bunkering Industry Revenue Million Forecast, by Ferries and OSV 2019 & 2032
- Table 52: Global UK LNG Bunkering Industry Revenue Million Forecast, by Others 2019 & 2032
- Table 53: Global UK LNG Bunkering Industry Revenue Million Forecast, by Country 2019 & 2032
- Table 54: Turkey UK LNG Bunkering Industry Revenue (Million) Forecast, by Application 2019 & 2032
- Table 55: Israel UK LNG Bunkering Industry Revenue (Million) Forecast, by Application 2019 & 2032
- Table 56: GCC UK LNG Bunkering Industry Revenue (Million) Forecast, by Application 2019 & 2032
- Table 57: North Africa UK LNG Bunkering Industry Revenue (Million) Forecast, by Application 2019 & 2032
- Table 58: South Africa UK LNG Bunkering Industry Revenue (Million) Forecast, by Application 2019 & 2032
- Table 59: Rest of Middle East & Africa UK LNG Bunkering Industry Revenue (Million) Forecast, by Application 2019 & 2032
- Table 60: Global UK LNG Bunkering Industry Revenue Million Forecast, by Tanker Fleet 2019 & 2032
- Table 61: Global UK LNG Bunkering Industry Revenue Million Forecast, by Container Fleet 2019 & 2032
- Table 62: Global UK LNG Bunkering Industry Revenue Million Forecast, by Bulk and General Cargo Fleet 2019 & 2032
- Table 63: Global UK LNG Bunkering Industry Revenue Million Forecast, by Ferries and OSV 2019 & 2032
- Table 64: Global UK LNG Bunkering Industry Revenue Million Forecast, by Others 2019 & 2032
- Table 65: Global UK LNG Bunkering Industry Revenue Million Forecast, by Country 2019 & 2032
- Table 66: China UK LNG Bunkering Industry Revenue (Million) Forecast, by Application 2019 & 2032
- Table 67: India UK LNG Bunkering Industry Revenue (Million) Forecast, by Application 2019 & 2032
- Table 68: Japan UK LNG Bunkering Industry Revenue (Million) Forecast, by Application 2019 & 2032
- Table 69: South Korea UK LNG Bunkering Industry Revenue (Million) Forecast, by Application 2019 & 2032
- Table 70: ASEAN UK LNG Bunkering Industry Revenue (Million) Forecast, by Application 2019 & 2032
- Table 71: Oceania UK LNG Bunkering Industry Revenue (Million) Forecast, by Application 2019 & 2032
- Table 72: Rest of Asia Pacific UK LNG Bunkering Industry Revenue (Million) Forecast, by Application 2019 & 2032
Frequently Asked Questions
1. What is the projected Compound Annual Growth Rate (CAGR) of the UK LNG Bunkering Industry?
The projected CAGR is approximately > 2.10%.
2. Which companies are prominent players in the UK LNG Bunkering Industry?
Key companies in the market include Flogas Britain Ltd, Engie SA, Chevron corporation, TotalEngeries SE, Shell PLC*List Not Exhaustive.
3. What are the main segments of the UK LNG Bunkering Industry?
The market segments include Tanker Fleet, Container Fleet, Bulk and General Cargo Fleet, Ferries and OSV, Others.
4. Can you provide details about the market size?
The market size is estimated to be USD XX Million as of 2022.
5. What are some drivers contributing to market growth?
4.; Increase in the Demand for Electricity4.; Rising Adoption of Electric Vehicles.
6. What are the notable trends driving market growth?
Ferries and OSV Segment to Dominate the Market.
7. Are there any restraints impacting market growth?
4.; New Sources of Distributed Electricity Generation.
8. Can you provide examples of recent developments in the market?
May 2022: Avenir LNG announced the delivery of the Avenir Achievement, the second 20,000 cbm dual-purpose LNG supply and bunkering vessel from the Nantong CIMC Sinopacific Offshore & Engineering.
9. What pricing options are available for accessing the report?
Pricing options include single-user, multi-user, and enterprise licenses priced at USD 3800, USD 4500, and USD 5800 respectively.
10. Is the market size provided in terms of value or volume?
The market size is provided in terms of value, measured in Million.
11. Are there any specific market keywords associated with the report?
Yes, the market keyword associated with the report is "UK LNG Bunkering Industry," which aids in identifying and referencing the specific market segment covered.
12. How do I determine which pricing option suits my needs best?
The pricing options vary based on user requirements and access needs. Individual users may opt for single-user licenses, while businesses requiring broader access may choose multi-user or enterprise licenses for cost-effective access to the report.
13. Are there any additional resources or data provided in the UK LNG Bunkering Industry report?
While the report offers comprehensive insights, it's advisable to review the specific contents or supplementary materials provided to ascertain if additional resources or data are available.
14. How can I stay updated on further developments or reports in the UK LNG Bunkering Industry?
To stay informed about further developments, trends, and reports in the UK LNG Bunkering Industry, consider subscribing to industry newsletters, following relevant companies and organizations, or regularly checking reputable industry news sources and publications.
Methodology
Step 1 - Identification of Relevant Samples Size from Population Database


Step 2 - Approaches for Defining Global Market Size (Value, Volume* & Price*)

Note*: In applicable scenarios
Step 3 - Data Sources
Primary Research
- Web Analytics
- Survey Reports
- Research Institute
- Latest Research Reports
- Opinion Leaders
Secondary Research
- Annual Reports
- White Paper
- Latest Press Release
- Industry Association
- Paid Database
- Investor Presentations

Step 4 - Data Triangulation
Involves using different sources of information in order to increase the validity of a study
These sources are likely to be stakeholders in a program - participants, other researchers, program staff, other community members, and so on.
Then we put all data in single framework & apply various statistical tools to find out the dynamic on the market.
During the analysis stage, feedback from the stakeholder groups would be compared to determine areas of agreement as well as areas of divergence


