
Key Insights
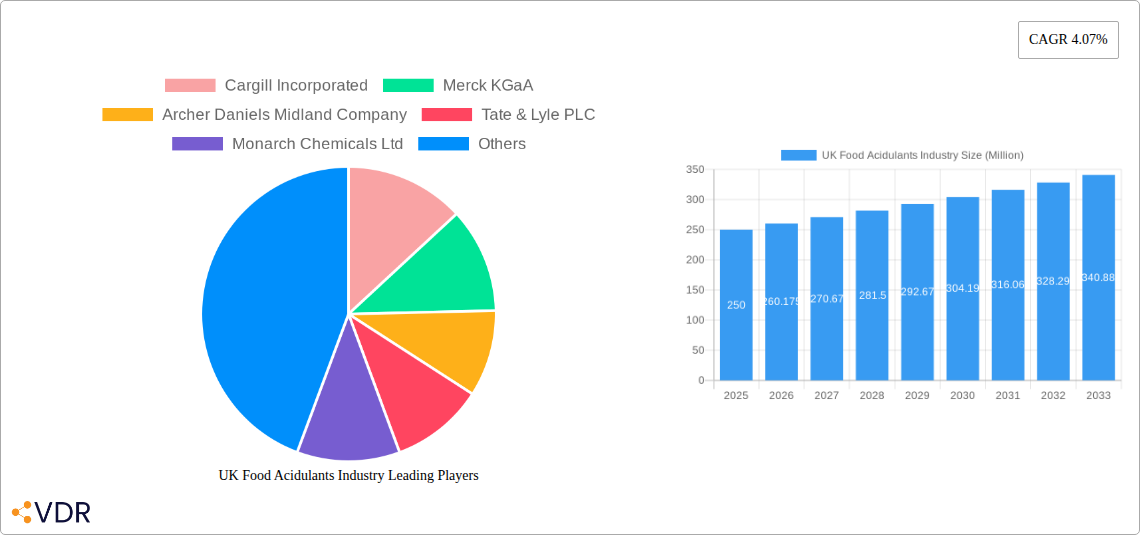
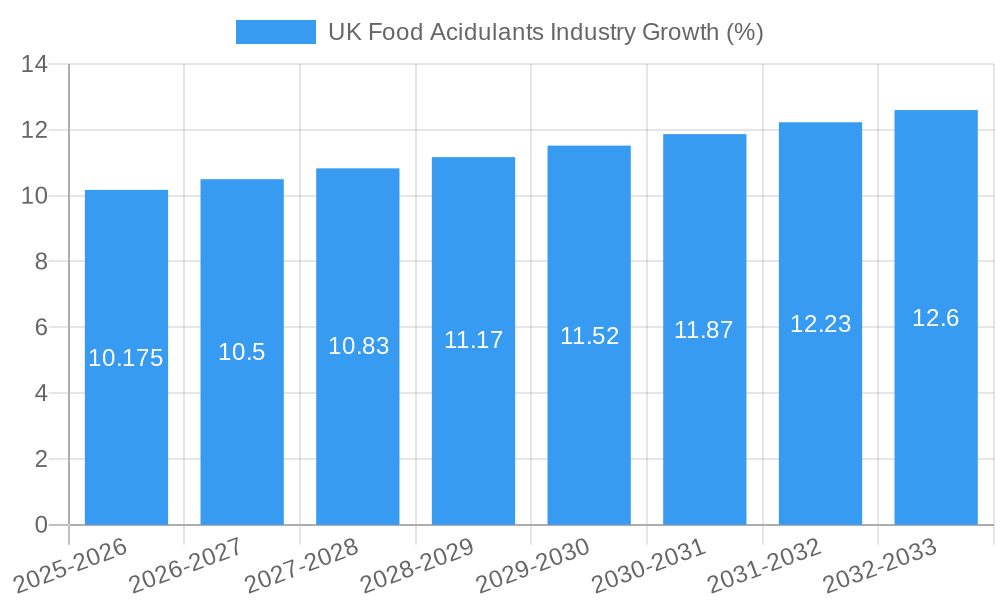
The UK food acidulants market, valued at approximately £250 million in 2025, is projected to experience steady growth, driven by increasing demand for processed foods and beverages. A compound annual growth rate (CAGR) of 4.07% from 2025 to 2033 indicates a significant market expansion, reaching an estimated value of over £350 million by 2033. Key drivers include the growing popularity of convenience foods, the rising demand for healthier food options (with acidulants playing a crucial role in preservation and taste enhancement), and the increasing adoption of food acidulants in various applications like bakery, confectionery, and dairy products. Citric acid remains the dominant type, followed by phosphoric and lactic acid, reflecting their widespread use across various food segments. The market is segmented by both acidulant type and application, allowing for granular market analysis and identification of key growth opportunities. Potential restraints include fluctuating raw material prices and stringent regulatory requirements regarding food additives. However, innovation in acidulant production, including the development of natural and organic alternatives, is expected to mitigate these challenges and further fuel market growth. Major players, such as Cargill, Merck KGaA, and Archer Daniels Midland, are strategically investing in research and development to strengthen their market positions and expand their product portfolios to meet the evolving demands of the UK food industry.
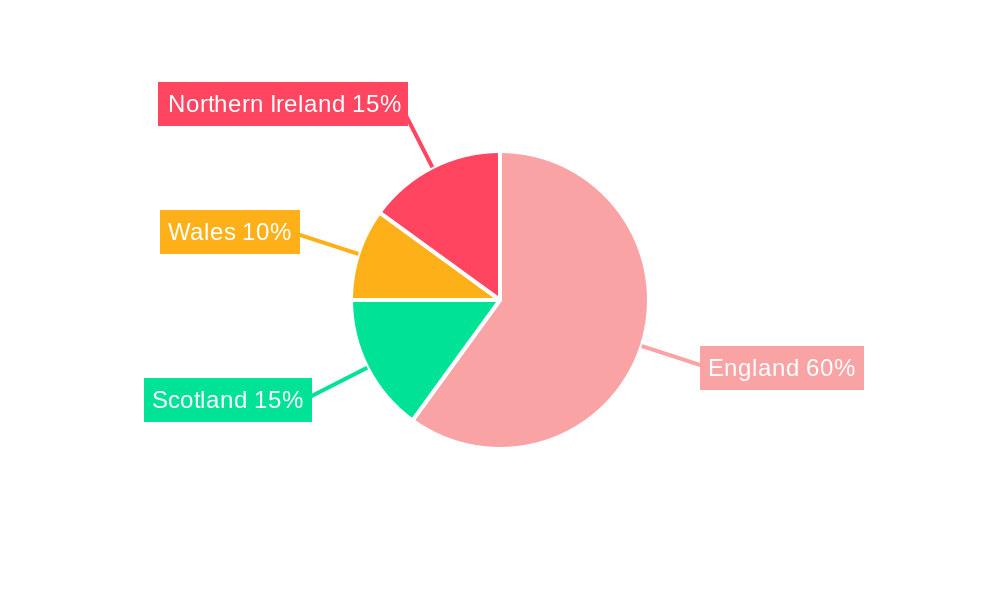
The regional distribution within the UK shows a concentration in England, driven by higher population density and greater food processing activities. However, growth is anticipated across all regions—England, Wales, Scotland, and Northern Ireland—reflecting increasing consumer demand and expanding food processing capabilities. Future market growth hinges on several factors, including consumer preferences for clean-label products, technological advancements, and evolving food safety regulations. The market presents substantial opportunities for both established players and new entrants, particularly those focusing on sustainable and innovative solutions within the food acidulants sector. Further growth is likely to be influenced by the development of new applications, such as in functional foods and beverages.
UK Food Acidulants Industry Market Report: 2019-2033
This comprehensive report provides an in-depth analysis of the UK food acidulants market, covering market dynamics, growth trends, regional segmentation, product landscape, key players, and future outlook. The study period spans 2019-2033, with 2025 as the base and estimated year. This report is invaluable for industry professionals, investors, and strategists seeking a granular understanding of this dynamic sector. The report meticulously analyzes the parent market (Food Additives) and its child market (Food Acidulants) to provide a holistic view.
UK Food Acidulants Industry Market Dynamics & Structure
The UK food acidulants market is characterized by moderate concentration, with key players like Cargill Incorporated, Merck KGaA, Archer Daniels Midland Company, and Tate & Lyle PLC holding significant market share. Technological innovation, primarily in production efficiency and sustainable sourcing, is a key driver. Stringent regulatory frameworks concerning food safety and labeling influence product development and market access. Competition from natural alternatives and substitutes like fruit juices necessitates continuous product innovation. End-user demographics, particularly shifting consumer preferences towards healthier and naturally sourced foods, impact demand. The market has witnessed a moderate level of M&A activity in recent years, with xx deals recorded between 2019 and 2024, primarily focused on expanding product portfolios and geographical reach.
- Market Concentration: Moderately concentrated, with top 5 players holding approximately xx% market share in 2025.
- Technological Innovation: Focus on improving production efficiency, reducing environmental impact, and developing novel acidulant formulations.
- Regulatory Framework: Stringent regulations concerning food safety, labeling, and additives impact market dynamics.
- Competitive Substitutes: Natural alternatives and other food preservation methods pose competitive pressure.
- M&A Activity: xx M&A deals recorded between 2019-2024, resulting in xx% market share change.
- Innovation Barriers: High R&D costs and stringent regulatory approvals present significant barriers to innovation.
UK Food Acidulants Industry Growth Trends & Insights
The UK food acidulants market experienced steady growth during the historical period (2019-2024), with a CAGR of xx%. This growth is primarily driven by increasing demand from the food and beverage industry, particularly in the beverages and confectionery segments. Technological advancements leading to improved product quality and efficiency, coupled with favorable economic conditions, further boosted market expansion. However, the market faced challenges due to fluctuations in raw material prices and consumer preference shifts towards minimally processed foods. Market penetration in emerging applications like meat alternatives and plant-based products is steadily increasing, presenting further growth opportunities. The forecast period (2025-2033) anticipates a CAGR of xx%, driven by increasing health consciousness and the rising demand for convenience foods.
Dominant Regions, Countries, or Segments in UK Food Acidulants Industry
The South East region dominates the UK food acidulants market, contributing approximately xx% to the total market value in 2025. This dominance is attributed to higher concentration of food processing industries and robust consumer spending. Within the product segments, Citric Acid holds the largest market share (xx%), followed by Lactic Acid (xx%) and Phosphoric Acid (xx%). The Beverages application segment accounts for the largest share (xx%) of the market, driven by the increasing popularity of carbonated drinks, juices, and other processed beverages.
- Key Drivers for South East Region: High concentration of food processing units, strong consumer spending, and advanced logistics infrastructure.
- Dominant Product Type: Citric Acid, driven by its versatility, wide applications, and cost-effectiveness.
- Dominant Application: Beverages, due to its extensive use in carbonated drinks, juices, and other beverages.
- Growth Potential: Dairy and Frozen Products, Meat Industry, and Confectionery segments show significant growth potential.
UK Food Acidulants Industry Product Landscape
The UK food acidulants market showcases a diverse product landscape, encompassing various types like citric acid, lactic acid, phosphoric acid, and others. These acidulants differ in their properties, applications, and functionalities, catering to specific needs across food and beverage applications. Ongoing innovations focus on enhancing product purity, improving functionality, and developing sustainable sourcing methods. A key trend is the increasing demand for natural and organic acidulants, driving the development of innovative extraction and production processes.
Key Drivers, Barriers & Challenges in UK Food Acidulants Industry
Key Drivers:
- Growing demand from the food and beverage industry.
- Increasing health consciousness and demand for naturally sourced products.
- Technological advancements leading to improved product quality and efficiency.
- Favorable economic conditions and increasing disposable incomes.
Key Challenges & Restraints:
- Fluctuations in raw material prices impacting production costs.
- Stringent regulations related to food safety and labeling.
- Competition from natural alternatives and substitutes.
- Supply chain disruptions and logistical challenges.
Emerging Opportunities in UK Food Acidulants Industry
- Expanding into emerging applications such as plant-based meat alternatives and functional foods.
- Developing innovative acidulant formulations with enhanced functionalities.
- Focusing on sustainable sourcing and production methods.
- Meeting the growing demand for natural and organic acidulants.
Growth Accelerators in the UK Food Acidulants Industry Industry
The UK food acidulants market's long-term growth is fueled by several factors. Technological advancements in production processes are improving efficiency and reducing costs. Strategic partnerships between acidulant manufacturers and food and beverage companies are expanding market reach and driving innovation. Market expansion into new geographical areas and product diversification are broadening the revenue streams.
Key Players Shaping the UK Food Acidulants Industry Market
- Cargill Incorporated
- Merck KGaA
- Archer Daniels Midland Company
- Tate & Lyle PLC
- Monarch Chemicals Ltd
- Brenntag AG
- H Plus Limited
Notable Milestones in UK Food Acidulants Industry Sector
- 2021: Launch of a new, sustainably sourced citric acid by Cargill Incorporated.
- 2022: Acquisition of a smaller acidulant producer by Tate & Lyle PLC, expanding its product portfolio.
- 2023: Implementation of stricter regulations on food additives by the UK government.
In-Depth UK Food Acidulants Industry Market Outlook
The UK food acidulants market is poised for continued growth throughout the forecast period (2025-2033). The increasing demand for processed foods and beverages, coupled with technological advancements and strategic partnerships, will drive market expansion. Focusing on sustainable sourcing, developing innovative acidulant formulations, and tapping into emerging application areas like plant-based foods will present lucrative opportunities for market players. The market anticipates a steady increase in demand, driven by favorable economic conditions and evolving consumer preferences.
UK Food Acidulants Industry Segmentation
-
1. Type
- 1.1. Citric Acid
- 1.2. Phosphoric Acid
- 1.3. Lactic Acid
- 1.4. Other Types
-
2. Application
- 2.1. Beverages
- 2.2. Dairy and Frozen Products
- 2.3. Bakery
- 2.4. Meat Industry
- 2.5. Confectionery
- 2.6. Other Applications
UK Food Acidulants Industry Segmentation By Geography
-
1. North America
- 1.1. United States
- 1.2. Canada
- 1.3. Mexico
-
2. South America
- 2.1. Brazil
- 2.2. Argentina
- 2.3. Rest of South America
-
3. Europe
- 3.1. United Kingdom
- 3.2. Germany
- 3.3. France
- 3.4. Italy
- 3.5. Spain
- 3.6. Russia
- 3.7. Benelux
- 3.8. Nordics
- 3.9. Rest of Europe
-
4. Middle East & Africa
- 4.1. Turkey
- 4.2. Israel
- 4.3. GCC
- 4.4. North Africa
- 4.5. South Africa
- 4.6. Rest of Middle East & Africa
-
5. Asia Pacific
- 5.1. China
- 5.2. India
- 5.3. Japan
- 5.4. South Korea
- 5.5. ASEAN
- 5.6. Oceania
- 5.7. Rest of Asia Pacific
UK Food Acidulants Industry REPORT HIGHLIGHTS
| Aspects | Details |
|---|---|
| Study Period | 2019-2033 |
| Base Year | 2024 |
| Estimated Year | 2025 |
| Forecast Period | 2025-2033 |
| Historical Period | 2019-2024 |
| Growth Rate | CAGR of 4.07% from 2019-2033 |
| Segmentation |
|
Table of Contents
- 1. Introduction
- 1.1. Research Scope
- 1.2. Market Segmentation
- 1.3. Research Methodology
- 1.4. Definitions and Assumptions
- 2. Executive Summary
- 2.1. Introduction
- 3. Market Dynamics
- 3.1. Introduction
- 3.2. Market Drivers
- 3.2.1. Rising Application in Dietary Supplements
- 3.3. Market Restrains
- 3.3.1. Increasing prevalence of hydroglycemia
- 3.4. Market Trends
- 3.4.1. Phosphoric Acid Promises Growth in Future
- 4. Market Factor Analysis
- 4.1. Porters Five Forces
- 4.2. Supply/Value Chain
- 4.3. PESTEL analysis
- 4.4. Market Entropy
- 4.5. Patent/Trademark Analysis
- 5. Global UK Food Acidulants Industry Analysis, Insights and Forecast, 2019-2031
- 5.1. Market Analysis, Insights and Forecast - by Type
- 5.1.1. Citric Acid
- 5.1.2. Phosphoric Acid
- 5.1.3. Lactic Acid
- 5.1.4. Other Types
- 5.2. Market Analysis, Insights and Forecast - by Application
- 5.2.1. Beverages
- 5.2.2. Dairy and Frozen Products
- 5.2.3. Bakery
- 5.2.4. Meat Industry
- 5.2.5. Confectionery
- 5.2.6. Other Applications
- 5.3. Market Analysis, Insights and Forecast - by Region
- 5.3.1. North America
- 5.3.2. South America
- 5.3.3. Europe
- 5.3.4. Middle East & Africa
- 5.3.5. Asia Pacific
- 5.1. Market Analysis, Insights and Forecast - by Type
- 6. North America UK Food Acidulants Industry Analysis, Insights and Forecast, 2019-2031
- 6.1. Market Analysis, Insights and Forecast - by Type
- 6.1.1. Citric Acid
- 6.1.2. Phosphoric Acid
- 6.1.3. Lactic Acid
- 6.1.4. Other Types
- 6.2. Market Analysis, Insights and Forecast - by Application
- 6.2.1. Beverages
- 6.2.2. Dairy and Frozen Products
- 6.2.3. Bakery
- 6.2.4. Meat Industry
- 6.2.5. Confectionery
- 6.2.6. Other Applications
- 6.1. Market Analysis, Insights and Forecast - by Type
- 7. South America UK Food Acidulants Industry Analysis, Insights and Forecast, 2019-2031
- 7.1. Market Analysis, Insights and Forecast - by Type
- 7.1.1. Citric Acid
- 7.1.2. Phosphoric Acid
- 7.1.3. Lactic Acid
- 7.1.4. Other Types
- 7.2. Market Analysis, Insights and Forecast - by Application
- 7.2.1. Beverages
- 7.2.2. Dairy and Frozen Products
- 7.2.3. Bakery
- 7.2.4. Meat Industry
- 7.2.5. Confectionery
- 7.2.6. Other Applications
- 7.1. Market Analysis, Insights and Forecast - by Type
- 8. Europe UK Food Acidulants Industry Analysis, Insights and Forecast, 2019-2031
- 8.1. Market Analysis, Insights and Forecast - by Type
- 8.1.1. Citric Acid
- 8.1.2. Phosphoric Acid
- 8.1.3. Lactic Acid
- 8.1.4. Other Types
- 8.2. Market Analysis, Insights and Forecast - by Application
- 8.2.1. Beverages
- 8.2.2. Dairy and Frozen Products
- 8.2.3. Bakery
- 8.2.4. Meat Industry
- 8.2.5. Confectionery
- 8.2.6. Other Applications
- 8.1. Market Analysis, Insights and Forecast - by Type
- 9. Middle East & Africa UK Food Acidulants Industry Analysis, Insights and Forecast, 2019-2031
- 9.1. Market Analysis, Insights and Forecast - by Type
- 9.1.1. Citric Acid
- 9.1.2. Phosphoric Acid
- 9.1.3. Lactic Acid
- 9.1.4. Other Types
- 9.2. Market Analysis, Insights and Forecast - by Application
- 9.2.1. Beverages
- 9.2.2. Dairy and Frozen Products
- 9.2.3. Bakery
- 9.2.4. Meat Industry
- 9.2.5. Confectionery
- 9.2.6. Other Applications
- 9.1. Market Analysis, Insights and Forecast - by Type
- 10. Asia Pacific UK Food Acidulants Industry Analysis, Insights and Forecast, 2019-2031
- 10.1. Market Analysis, Insights and Forecast - by Type
- 10.1.1. Citric Acid
- 10.1.2. Phosphoric Acid
- 10.1.3. Lactic Acid
- 10.1.4. Other Types
- 10.2. Market Analysis, Insights and Forecast - by Application
- 10.2.1. Beverages
- 10.2.2. Dairy and Frozen Products
- 10.2.3. Bakery
- 10.2.4. Meat Industry
- 10.2.5. Confectionery
- 10.2.6. Other Applications
- 10.1. Market Analysis, Insights and Forecast - by Type
- 11. England UK Food Acidulants Industry Analysis, Insights and Forecast, 2019-2031
- 12. Wales UK Food Acidulants Industry Analysis, Insights and Forecast, 2019-2031
- 13. Scotland UK Food Acidulants Industry Analysis, Insights and Forecast, 2019-2031
- 14. Northern UK Food Acidulants Industry Analysis, Insights and Forecast, 2019-2031
- 15. Ireland UK Food Acidulants Industry Analysis, Insights and Forecast, 2019-2031
- 16. Competitive Analysis
- 16.1. Global Market Share Analysis 2024
- 16.2. Company Profiles
- 16.2.1 Cargill Incorporated
- 16.2.1.1. Overview
- 16.2.1.2. Products
- 16.2.1.3. SWOT Analysis
- 16.2.1.4. Recent Developments
- 16.2.1.5. Financials (Based on Availability)
- 16.2.2 Merck KGaA
- 16.2.2.1. Overview
- 16.2.2.2. Products
- 16.2.2.3. SWOT Analysis
- 16.2.2.4. Recent Developments
- 16.2.2.5. Financials (Based on Availability)
- 16.2.3 Archer Daniels Midland Company
- 16.2.3.1. Overview
- 16.2.3.2. Products
- 16.2.3.3. SWOT Analysis
- 16.2.3.4. Recent Developments
- 16.2.3.5. Financials (Based on Availability)
- 16.2.4 Tate & Lyle PLC
- 16.2.4.1. Overview
- 16.2.4.2. Products
- 16.2.4.3. SWOT Analysis
- 16.2.4.4. Recent Developments
- 16.2.4.5. Financials (Based on Availability)
- 16.2.5 Monarch Chemicals Ltd
- 16.2.5.1. Overview
- 16.2.5.2. Products
- 16.2.5.3. SWOT Analysis
- 16.2.5.4. Recent Developments
- 16.2.5.5. Financials (Based on Availability)
- 16.2.6 Brenntag AG
- 16.2.6.1. Overview
- 16.2.6.2. Products
- 16.2.6.3. SWOT Analysis
- 16.2.6.4. Recent Developments
- 16.2.6.5. Financials (Based on Availability)
- 16.2.7 H Plus Limited*List Not Exhaustive
- 16.2.7.1. Overview
- 16.2.7.2. Products
- 16.2.7.3. SWOT Analysis
- 16.2.7.4. Recent Developments
- 16.2.7.5. Financials (Based on Availability)
- 16.2.1 Cargill Incorporated
List of Figures
- Figure 1: Global UK Food Acidulants Industry Revenue Breakdown (Million, %) by Region 2024 & 2032
- Figure 2: Global UK Food Acidulants Industry Volume Breakdown (K Tons, %) by Region 2024 & 2032
- Figure 3: United kingdom Region UK Food Acidulants Industry Revenue (Million), by Country 2024 & 2032
- Figure 4: United kingdom Region UK Food Acidulants Industry Volume (K Tons), by Country 2024 & 2032
- Figure 5: United kingdom Region UK Food Acidulants Industry Revenue Share (%), by Country 2024 & 2032
- Figure 6: United kingdom Region UK Food Acidulants Industry Volume Share (%), by Country 2024 & 2032
- Figure 7: North America UK Food Acidulants Industry Revenue (Million), by Type 2024 & 2032
- Figure 8: North America UK Food Acidulants Industry Volume (K Tons), by Type 2024 & 2032
- Figure 9: North America UK Food Acidulants Industry Revenue Share (%), by Type 2024 & 2032
- Figure 10: North America UK Food Acidulants Industry Volume Share (%), by Type 2024 & 2032
- Figure 11: North America UK Food Acidulants Industry Revenue (Million), by Application 2024 & 2032
- Figure 12: North America UK Food Acidulants Industry Volume (K Tons), by Application 2024 & 2032
- Figure 13: North America UK Food Acidulants Industry Revenue Share (%), by Application 2024 & 2032
- Figure 14: North America UK Food Acidulants Industry Volume Share (%), by Application 2024 & 2032
- Figure 15: North America UK Food Acidulants Industry Revenue (Million), by Country 2024 & 2032
- Figure 16: North America UK Food Acidulants Industry Volume (K Tons), by Country 2024 & 2032
- Figure 17: North America UK Food Acidulants Industry Revenue Share (%), by Country 2024 & 2032
- Figure 18: North America UK Food Acidulants Industry Volume Share (%), by Country 2024 & 2032
- Figure 19: South America UK Food Acidulants Industry Revenue (Million), by Type 2024 & 2032
- Figure 20: South America UK Food Acidulants Industry Volume (K Tons), by Type 2024 & 2032
- Figure 21: South America UK Food Acidulants Industry Revenue Share (%), by Type 2024 & 2032
- Figure 22: South America UK Food Acidulants Industry Volume Share (%), by Type 2024 & 2032
- Figure 23: South America UK Food Acidulants Industry Revenue (Million), by Application 2024 & 2032
- Figure 24: South America UK Food Acidulants Industry Volume (K Tons), by Application 2024 & 2032
- Figure 25: South America UK Food Acidulants Industry Revenue Share (%), by Application 2024 & 2032
- Figure 26: South America UK Food Acidulants Industry Volume Share (%), by Application 2024 & 2032
- Figure 27: South America UK Food Acidulants Industry Revenue (Million), by Country 2024 & 2032
- Figure 28: South America UK Food Acidulants Industry Volume (K Tons), by Country 2024 & 2032
- Figure 29: South America UK Food Acidulants Industry Revenue Share (%), by Country 2024 & 2032
- Figure 30: South America UK Food Acidulants Industry Volume Share (%), by Country 2024 & 2032
- Figure 31: Europe UK Food Acidulants Industry Revenue (Million), by Type 2024 & 2032
- Figure 32: Europe UK Food Acidulants Industry Volume (K Tons), by Type 2024 & 2032
- Figure 33: Europe UK Food Acidulants Industry Revenue Share (%), by Type 2024 & 2032
- Figure 34: Europe UK Food Acidulants Industry Volume Share (%), by Type 2024 & 2032
- Figure 35: Europe UK Food Acidulants Industry Revenue (Million), by Application 2024 & 2032
- Figure 36: Europe UK Food Acidulants Industry Volume (K Tons), by Application 2024 & 2032
- Figure 37: Europe UK Food Acidulants Industry Revenue Share (%), by Application 2024 & 2032
- Figure 38: Europe UK Food Acidulants Industry Volume Share (%), by Application 2024 & 2032
- Figure 39: Europe UK Food Acidulants Industry Revenue (Million), by Country 2024 & 2032
- Figure 40: Europe UK Food Acidulants Industry Volume (K Tons), by Country 2024 & 2032
- Figure 41: Europe UK Food Acidulants Industry Revenue Share (%), by Country 2024 & 2032
- Figure 42: Europe UK Food Acidulants Industry Volume Share (%), by Country 2024 & 2032
- Figure 43: Middle East & Africa UK Food Acidulants Industry Revenue (Million), by Type 2024 & 2032
- Figure 44: Middle East & Africa UK Food Acidulants Industry Volume (K Tons), by Type 2024 & 2032
- Figure 45: Middle East & Africa UK Food Acidulants Industry Revenue Share (%), by Type 2024 & 2032
- Figure 46: Middle East & Africa UK Food Acidulants Industry Volume Share (%), by Type 2024 & 2032
- Figure 47: Middle East & Africa UK Food Acidulants Industry Revenue (Million), by Application 2024 & 2032
- Figure 48: Middle East & Africa UK Food Acidulants Industry Volume (K Tons), by Application 2024 & 2032
- Figure 49: Middle East & Africa UK Food Acidulants Industry Revenue Share (%), by Application 2024 & 2032
- Figure 50: Middle East & Africa UK Food Acidulants Industry Volume Share (%), by Application 2024 & 2032
- Figure 51: Middle East & Africa UK Food Acidulants Industry Revenue (Million), by Country 2024 & 2032
- Figure 52: Middle East & Africa UK Food Acidulants Industry Volume (K Tons), by Country 2024 & 2032
- Figure 53: Middle East & Africa UK Food Acidulants Industry Revenue Share (%), by Country 2024 & 2032
- Figure 54: Middle East & Africa UK Food Acidulants Industry Volume Share (%), by Country 2024 & 2032
- Figure 55: Asia Pacific UK Food Acidulants Industry Revenue (Million), by Type 2024 & 2032
- Figure 56: Asia Pacific UK Food Acidulants Industry Volume (K Tons), by Type 2024 & 2032
- Figure 57: Asia Pacific UK Food Acidulants Industry Revenue Share (%), by Type 2024 & 2032
- Figure 58: Asia Pacific UK Food Acidulants Industry Volume Share (%), by Type 2024 & 2032
- Figure 59: Asia Pacific UK Food Acidulants Industry Revenue (Million), by Application 2024 & 2032
- Figure 60: Asia Pacific UK Food Acidulants Industry Volume (K Tons), by Application 2024 & 2032
- Figure 61: Asia Pacific UK Food Acidulants Industry Revenue Share (%), by Application 2024 & 2032
- Figure 62: Asia Pacific UK Food Acidulants Industry Volume Share (%), by Application 2024 & 2032
- Figure 63: Asia Pacific UK Food Acidulants Industry Revenue (Million), by Country 2024 & 2032
- Figure 64: Asia Pacific UK Food Acidulants Industry Volume (K Tons), by Country 2024 & 2032
- Figure 65: Asia Pacific UK Food Acidulants Industry Revenue Share (%), by Country 2024 & 2032
- Figure 66: Asia Pacific UK Food Acidulants Industry Volume Share (%), by Country 2024 & 2032
List of Tables
- Table 1: Global UK Food Acidulants Industry Revenue Million Forecast, by Region 2019 & 2032
- Table 2: Global UK Food Acidulants Industry Volume K Tons Forecast, by Region 2019 & 2032
- Table 3: Global UK Food Acidulants Industry Revenue Million Forecast, by Type 2019 & 2032
- Table 4: Global UK Food Acidulants Industry Volume K Tons Forecast, by Type 2019 & 2032
- Table 5: Global UK Food Acidulants Industry Revenue Million Forecast, by Application 2019 & 2032
- Table 6: Global UK Food Acidulants Industry Volume K Tons Forecast, by Application 2019 & 2032
- Table 7: Global UK Food Acidulants Industry Revenue Million Forecast, by Region 2019 & 2032
- Table 8: Global UK Food Acidulants Industry Volume K Tons Forecast, by Region 2019 & 2032
- Table 9: Global UK Food Acidulants Industry Revenue Million Forecast, by Country 2019 & 2032
- Table 10: Global UK Food Acidulants Industry Volume K Tons Forecast, by Country 2019 & 2032
- Table 11: England UK Food Acidulants Industry Revenue (Million) Forecast, by Application 2019 & 2032
- Table 12: England UK Food Acidulants Industry Volume (K Tons) Forecast, by Application 2019 & 2032
- Table 13: Wales UK Food Acidulants Industry Revenue (Million) Forecast, by Application 2019 & 2032
- Table 14: Wales UK Food Acidulants Industry Volume (K Tons) Forecast, by Application 2019 & 2032
- Table 15: Scotland UK Food Acidulants Industry Revenue (Million) Forecast, by Application 2019 & 2032
- Table 16: Scotland UK Food Acidulants Industry Volume (K Tons) Forecast, by Application 2019 & 2032
- Table 17: Northern UK Food Acidulants Industry Revenue (Million) Forecast, by Application 2019 & 2032
- Table 18: Northern UK Food Acidulants Industry Volume (K Tons) Forecast, by Application 2019 & 2032
- Table 19: Ireland UK Food Acidulants Industry Revenue (Million) Forecast, by Application 2019 & 2032
- Table 20: Ireland UK Food Acidulants Industry Volume (K Tons) Forecast, by Application 2019 & 2032
- Table 21: Global UK Food Acidulants Industry Revenue Million Forecast, by Type 2019 & 2032
- Table 22: Global UK Food Acidulants Industry Volume K Tons Forecast, by Type 2019 & 2032
- Table 23: Global UK Food Acidulants Industry Revenue Million Forecast, by Application 2019 & 2032
- Table 24: Global UK Food Acidulants Industry Volume K Tons Forecast, by Application 2019 & 2032
- Table 25: Global UK Food Acidulants Industry Revenue Million Forecast, by Country 2019 & 2032
- Table 26: Global UK Food Acidulants Industry Volume K Tons Forecast, by Country 2019 & 2032
- Table 27: United States UK Food Acidulants Industry Revenue (Million) Forecast, by Application 2019 & 2032
- Table 28: United States UK Food Acidulants Industry Volume (K Tons) Forecast, by Application 2019 & 2032
- Table 29: Canada UK Food Acidulants Industry Revenue (Million) Forecast, by Application 2019 & 2032
- Table 30: Canada UK Food Acidulants Industry Volume (K Tons) Forecast, by Application 2019 & 2032
- Table 31: Mexico UK Food Acidulants Industry Revenue (Million) Forecast, by Application 2019 & 2032
- Table 32: Mexico UK Food Acidulants Industry Volume (K Tons) Forecast, by Application 2019 & 2032
- Table 33: Global UK Food Acidulants Industry Revenue Million Forecast, by Type 2019 & 2032
- Table 34: Global UK Food Acidulants Industry Volume K Tons Forecast, by Type 2019 & 2032
- Table 35: Global UK Food Acidulants Industry Revenue Million Forecast, by Application 2019 & 2032
- Table 36: Global UK Food Acidulants Industry Volume K Tons Forecast, by Application 2019 & 2032
- Table 37: Global UK Food Acidulants Industry Revenue Million Forecast, by Country 2019 & 2032
- Table 38: Global UK Food Acidulants Industry Volume K Tons Forecast, by Country 2019 & 2032
- Table 39: Brazil UK Food Acidulants Industry Revenue (Million) Forecast, by Application 2019 & 2032
- Table 40: Brazil UK Food Acidulants Industry Volume (K Tons) Forecast, by Application 2019 & 2032
- Table 41: Argentina UK Food Acidulants Industry Revenue (Million) Forecast, by Application 2019 & 2032
- Table 42: Argentina UK Food Acidulants Industry Volume (K Tons) Forecast, by Application 2019 & 2032
- Table 43: Rest of South America UK Food Acidulants Industry Revenue (Million) Forecast, by Application 2019 & 2032
- Table 44: Rest of South America UK Food Acidulants Industry Volume (K Tons) Forecast, by Application 2019 & 2032
- Table 45: Global UK Food Acidulants Industry Revenue Million Forecast, by Type 2019 & 2032
- Table 46: Global UK Food Acidulants Industry Volume K Tons Forecast, by Type 2019 & 2032
- Table 47: Global UK Food Acidulants Industry Revenue Million Forecast, by Application 2019 & 2032
- Table 48: Global UK Food Acidulants Industry Volume K Tons Forecast, by Application 2019 & 2032
- Table 49: Global UK Food Acidulants Industry Revenue Million Forecast, by Country 2019 & 2032
- Table 50: Global UK Food Acidulants Industry Volume K Tons Forecast, by Country 2019 & 2032
- Table 51: United Kingdom UK Food Acidulants Industry Revenue (Million) Forecast, by Application 2019 & 2032
- Table 52: United Kingdom UK Food Acidulants Industry Volume (K Tons) Forecast, by Application 2019 & 2032
- Table 53: Germany UK Food Acidulants Industry Revenue (Million) Forecast, by Application 2019 & 2032
- Table 54: Germany UK Food Acidulants Industry Volume (K Tons) Forecast, by Application 2019 & 2032
- Table 55: France UK Food Acidulants Industry Revenue (Million) Forecast, by Application 2019 & 2032
- Table 56: France UK Food Acidulants Industry Volume (K Tons) Forecast, by Application 2019 & 2032
- Table 57: Italy UK Food Acidulants Industry Revenue (Million) Forecast, by Application 2019 & 2032
- Table 58: Italy UK Food Acidulants Industry Volume (K Tons) Forecast, by Application 2019 & 2032
- Table 59: Spain UK Food Acidulants Industry Revenue (Million) Forecast, by Application 2019 & 2032
- Table 60: Spain UK Food Acidulants Industry Volume (K Tons) Forecast, by Application 2019 & 2032
- Table 61: Russia UK Food Acidulants Industry Revenue (Million) Forecast, by Application 2019 & 2032
- Table 62: Russia UK Food Acidulants Industry Volume (K Tons) Forecast, by Application 2019 & 2032
- Table 63: Benelux UK Food Acidulants Industry Revenue (Million) Forecast, by Application 2019 & 2032
- Table 64: Benelux UK Food Acidulants Industry Volume (K Tons) Forecast, by Application 2019 & 2032
- Table 65: Nordics UK Food Acidulants Industry Revenue (Million) Forecast, by Application 2019 & 2032
- Table 66: Nordics UK Food Acidulants Industry Volume (K Tons) Forecast, by Application 2019 & 2032
- Table 67: Rest of Europe UK Food Acidulants Industry Revenue (Million) Forecast, by Application 2019 & 2032
- Table 68: Rest of Europe UK Food Acidulants Industry Volume (K Tons) Forecast, by Application 2019 & 2032
- Table 69: Global UK Food Acidulants Industry Revenue Million Forecast, by Type 2019 & 2032
- Table 70: Global UK Food Acidulants Industry Volume K Tons Forecast, by Type 2019 & 2032
- Table 71: Global UK Food Acidulants Industry Revenue Million Forecast, by Application 2019 & 2032
- Table 72: Global UK Food Acidulants Industry Volume K Tons Forecast, by Application 2019 & 2032
- Table 73: Global UK Food Acidulants Industry Revenue Million Forecast, by Country 2019 & 2032
- Table 74: Global UK Food Acidulants Industry Volume K Tons Forecast, by Country 2019 & 2032
- Table 75: Turkey UK Food Acidulants Industry Revenue (Million) Forecast, by Application 2019 & 2032
- Table 76: Turkey UK Food Acidulants Industry Volume (K Tons) Forecast, by Application 2019 & 2032
- Table 77: Israel UK Food Acidulants Industry Revenue (Million) Forecast, by Application 2019 & 2032
- Table 78: Israel UK Food Acidulants Industry Volume (K Tons) Forecast, by Application 2019 & 2032
- Table 79: GCC UK Food Acidulants Industry Revenue (Million) Forecast, by Application 2019 & 2032
- Table 80: GCC UK Food Acidulants Industry Volume (K Tons) Forecast, by Application 2019 & 2032
- Table 81: North Africa UK Food Acidulants Industry Revenue (Million) Forecast, by Application 2019 & 2032
- Table 82: North Africa UK Food Acidulants Industry Volume (K Tons) Forecast, by Application 2019 & 2032
- Table 83: South Africa UK Food Acidulants Industry Revenue (Million) Forecast, by Application 2019 & 2032
- Table 84: South Africa UK Food Acidulants Industry Volume (K Tons) Forecast, by Application 2019 & 2032
- Table 85: Rest of Middle East & Africa UK Food Acidulants Industry Revenue (Million) Forecast, by Application 2019 & 2032
- Table 86: Rest of Middle East & Africa UK Food Acidulants Industry Volume (K Tons) Forecast, by Application 2019 & 2032
- Table 87: Global UK Food Acidulants Industry Revenue Million Forecast, by Type 2019 & 2032
- Table 88: Global UK Food Acidulants Industry Volume K Tons Forecast, by Type 2019 & 2032
- Table 89: Global UK Food Acidulants Industry Revenue Million Forecast, by Application 2019 & 2032
- Table 90: Global UK Food Acidulants Industry Volume K Tons Forecast, by Application 2019 & 2032
- Table 91: Global UK Food Acidulants Industry Revenue Million Forecast, by Country 2019 & 2032
- Table 92: Global UK Food Acidulants Industry Volume K Tons Forecast, by Country 2019 & 2032
- Table 93: China UK Food Acidulants Industry Revenue (Million) Forecast, by Application 2019 & 2032
- Table 94: China UK Food Acidulants Industry Volume (K Tons) Forecast, by Application 2019 & 2032
- Table 95: India UK Food Acidulants Industry Revenue (Million) Forecast, by Application 2019 & 2032
- Table 96: India UK Food Acidulants Industry Volume (K Tons) Forecast, by Application 2019 & 2032
- Table 97: Japan UK Food Acidulants Industry Revenue (Million) Forecast, by Application 2019 & 2032
- Table 98: Japan UK Food Acidulants Industry Volume (K Tons) Forecast, by Application 2019 & 2032
- Table 99: South Korea UK Food Acidulants Industry Revenue (Million) Forecast, by Application 2019 & 2032
- Table 100: South Korea UK Food Acidulants Industry Volume (K Tons) Forecast, by Application 2019 & 2032
- Table 101: ASEAN UK Food Acidulants Industry Revenue (Million) Forecast, by Application 2019 & 2032
- Table 102: ASEAN UK Food Acidulants Industry Volume (K Tons) Forecast, by Application 2019 & 2032
- Table 103: Oceania UK Food Acidulants Industry Revenue (Million) Forecast, by Application 2019 & 2032
- Table 104: Oceania UK Food Acidulants Industry Volume (K Tons) Forecast, by Application 2019 & 2032
- Table 105: Rest of Asia Pacific UK Food Acidulants Industry Revenue (Million) Forecast, by Application 2019 & 2032
- Table 106: Rest of Asia Pacific UK Food Acidulants Industry Volume (K Tons) Forecast, by Application 2019 & 2032
Frequently Asked Questions
1. What is the projected Compound Annual Growth Rate (CAGR) of the UK Food Acidulants Industry?
The projected CAGR is approximately 4.07%.
2. Which companies are prominent players in the UK Food Acidulants Industry?
Key companies in the market include Cargill Incorporated, Merck KGaA, Archer Daniels Midland Company, Tate & Lyle PLC, Monarch Chemicals Ltd, Brenntag AG, H Plus Limited*List Not Exhaustive.
3. What are the main segments of the UK Food Acidulants Industry?
The market segments include Type, Application.
4. Can you provide details about the market size?
The market size is estimated to be USD XX Million as of 2022.
5. What are some drivers contributing to market growth?
Rising Application in Dietary Supplements.
6. What are the notable trends driving market growth?
Phosphoric Acid Promises Growth in Future.
7. Are there any restraints impacting market growth?
Increasing prevalence of hydroglycemia.
8. Can you provide examples of recent developments in the market?
N/A
9. What pricing options are available for accessing the report?
Pricing options include single-user, multi-user, and enterprise licenses priced at USD 3800, USD 4500, and USD 5800 respectively.
10. Is the market size provided in terms of value or volume?
The market size is provided in terms of value, measured in Million and volume, measured in K Tons.
11. Are there any specific market keywords associated with the report?
Yes, the market keyword associated with the report is "UK Food Acidulants Industry," which aids in identifying and referencing the specific market segment covered.
12. How do I determine which pricing option suits my needs best?
The pricing options vary based on user requirements and access needs. Individual users may opt for single-user licenses, while businesses requiring broader access may choose multi-user or enterprise licenses for cost-effective access to the report.
13. Are there any additional resources or data provided in the UK Food Acidulants Industry report?
While the report offers comprehensive insights, it's advisable to review the specific contents or supplementary materials provided to ascertain if additional resources or data are available.
14. How can I stay updated on further developments or reports in the UK Food Acidulants Industry?
To stay informed about further developments, trends, and reports in the UK Food Acidulants Industry, consider subscribing to industry newsletters, following relevant companies and organizations, or regularly checking reputable industry news sources and publications.
Methodology
Step 1 - Identification of Relevant Samples Size from Population Database


Step 2 - Approaches for Defining Global Market Size (Value, Volume* & Price*)

Note*: In applicable scenarios
Step 3 - Data Sources
Primary Research
- Web Analytics
- Survey Reports
- Research Institute
- Latest Research Reports
- Opinion Leaders
Secondary Research
- Annual Reports
- White Paper
- Latest Press Release
- Industry Association
- Paid Database
- Investor Presentations

Step 4 - Data Triangulation
Involves using different sources of information in order to increase the validity of a study
These sources are likely to be stakeholders in a program - participants, other researchers, program staff, other community members, and so on.
Then we put all data in single framework & apply various statistical tools to find out the dynamic on the market.
During the analysis stage, feedback from the stakeholder groups would be compared to determine areas of agreement as well as areas of divergence


