
Key Insights
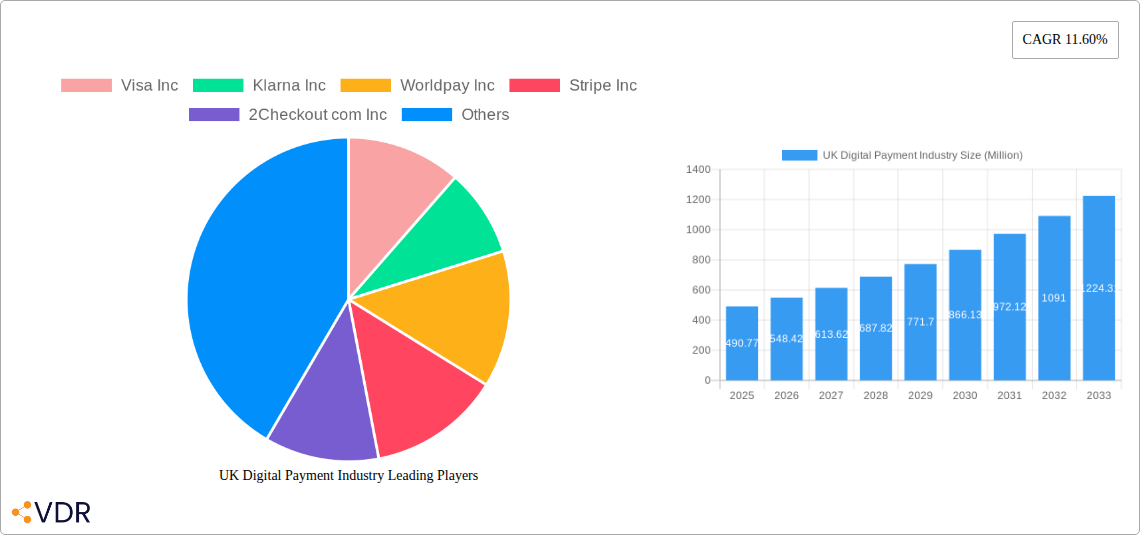
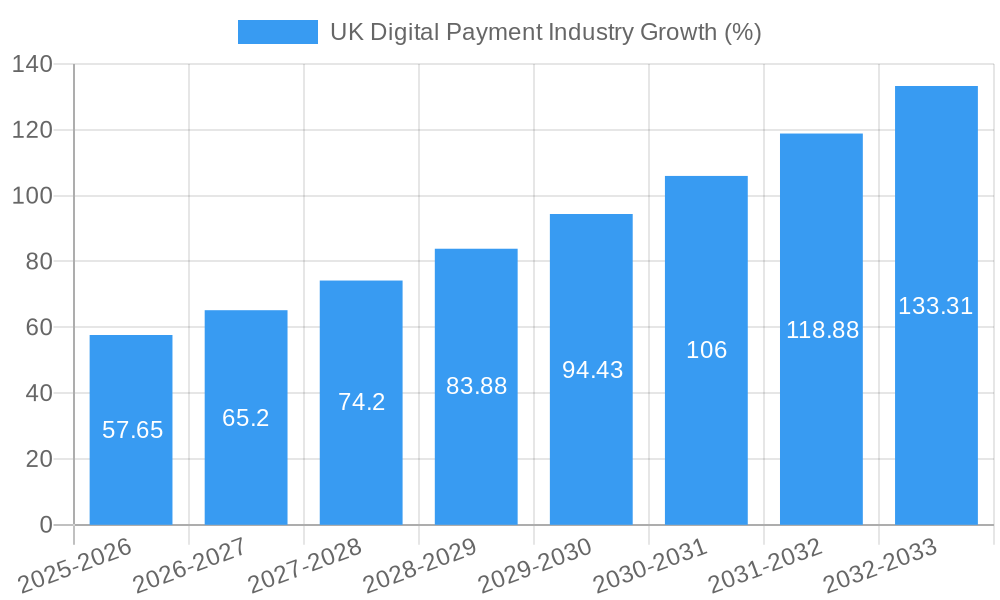
The UK digital payment industry is experiencing robust growth, projected to reach £490.77 million in 2025 and maintain a Compound Annual Growth Rate (CAGR) of 11.60% from 2025 to 2033. This expansion is fueled by several key drivers. The increasing adoption of smartphones and e-commerce platforms provides convenient and accessible digital payment options for consumers. Furthermore, government initiatives promoting cashless transactions and the robust regulatory environment supporting secure digital payments are contributing significantly to market expansion. The rising popularity of mobile wallets and buy-now-pay-later (BNPL) services, particularly amongst younger demographics, further propels growth. Competition amongst major players like Visa, Mastercard, PayPal, and emerging fintech companies like Klarna and Stripe drives innovation and enhances consumer choice, fostering market expansion. While data security concerns and potential regulatory changes pose some challenges, the overall trajectory remains positive.
Segmentation analysis reveals a significant contribution from both Point-of-Sale (POS) and online sales channels. Within end-user industries, retail and entertainment sectors are major contributors, followed by healthcare and hospitality. Considering the CAGR, we can project substantial growth across all segments. The retail sector will likely benefit from continued e-commerce growth and the increasing integration of digital payment solutions within physical stores. The entertainment sector, encompassing online gaming and streaming services, is expected to show strong growth due to its reliance on digital transactions. Looking ahead, the continued expansion of the digital payment ecosystem in the UK will be shaped by factors such as technological advancements in payment processing, enhanced security measures, and the evolving needs and preferences of consumers. The market is poised for significant expansion throughout the forecast period, driven by both established players and innovative fintech startups.
UK Digital Payment Industry Report: 2019-2033
This comprehensive report provides a detailed analysis of the UK digital payment industry, offering invaluable insights for industry professionals, investors, and strategic planners. Covering the period from 2019 to 2033, with a focus on 2025, this report unravels market dynamics, growth trends, and key players shaping the future of payments in the UK. The report delves into both parent markets (digital payments) and child markets (e.g., Point of Sale, Online Payments, specific end-user industries), providing a granular understanding of this rapidly evolving sector. Market values are presented in millions.
UK Digital Payment Industry Market Dynamics & Structure
The UK digital payment landscape is characterized by high market concentration amongst established players and a surge in FinTech innovation. The regulatory environment, while supportive of innovation, also presents challenges in areas like data privacy and consumer protection. The market witnesses continuous technological advancements, with the rise of mobile payments, Buy Now Pay Later (BNPL), and embedded finance solutions driving significant changes. Competitive substitutes, including traditional cash and cheques, are slowly declining in relevance. The end-user demographics are diverse, ranging from young tech-savvy individuals to older generations gradually adopting digital solutions. Mergers and acquisitions (M&A) are frequent, with larger players acquiring smaller FinTechs to enhance their capabilities and expand their market reach.
- Market Concentration: Top 5 players hold approximately xx% market share (2024).
- Technological Drivers: Mobile payments, BNPL, Open Banking, AI-powered fraud detection.
- Regulatory Framework: PSD2, FCA regulations impacting BNPL and data privacy.
- Competitive Substitutes: Cash, cheques (declining market share).
- M&A Activity: xx deals closed in the last 5 years (2019-2024), valued at approximately £xx million.
- Innovation Barriers: High regulatory compliance costs, data security concerns.
UK Digital Payment Industry Growth Trends & Insights
The UK digital payment market exhibits robust growth, driven by increasing smartphone penetration, rising e-commerce adoption, and a shift towards cashless transactions. The market size has grown from £xx million in 2019 to an estimated £xx million in 2025, with a Compound Annual Growth Rate (CAGR) of xx% during the historical period. Market penetration continues to rise, particularly in online sales and POS systems. Technological disruptions, such as the introduction of new payment methods and improved security features, fuel further growth. Consumer behavior shifts towards convenience and seamless payment experiences also contribute significantly. The adoption of BNPL solutions shows particularly strong growth amongst younger demographics. This trend is expected to accelerate further during the forecast period. Detailed projections for the 2025-2033 period are included in the full report.
Dominant Regions, Countries, or Segments in UK Digital Payment Industry
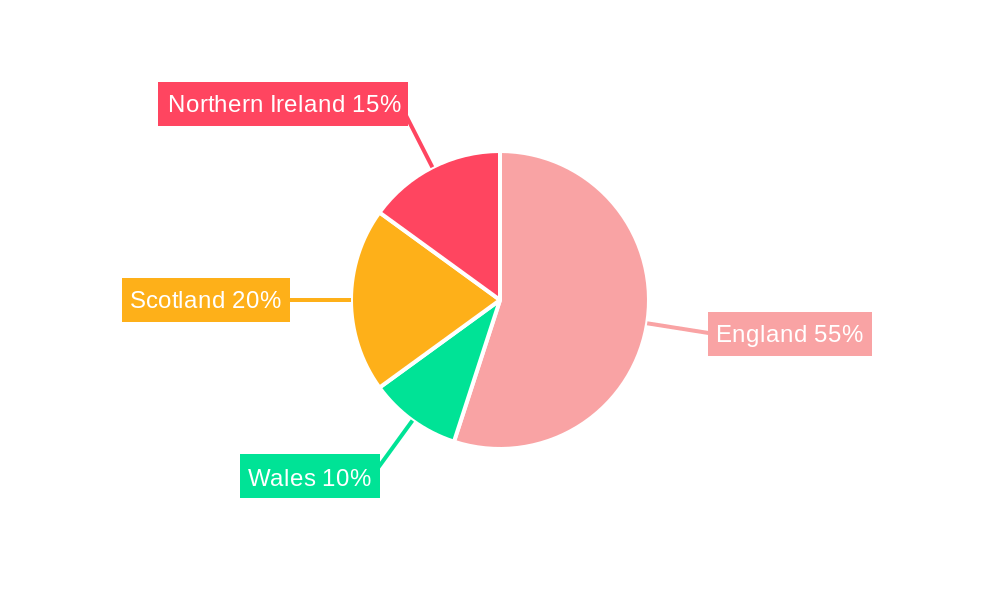
The UK digital payment market demonstrates strong growth across all segments, yet certain areas are significantly more dominant. The Retail segment in the By End-user Industry category leads the market, fueled by the widespread adoption of e-commerce and in-store digital payments. Online sales (By Mode of Payment) also present a dominant segment showing significant growth, driven by the expansion of online retail and services. London and other major metropolitan areas exhibit higher adoption rates than less populated regions, due to greater concentration of businesses and tech-savvy individuals.
- Key Drivers – Retail Segment: High e-commerce penetration, increasing consumer preference for contactless payments, robust retail infrastructure.
- Key Drivers – Online Sales Segment: Growth of e-commerce platforms, increasing online shopping habits, improved internet accessibility.
- Dominance Factors: High smartphone penetration, strong digital infrastructure, favourable regulatory environment.
- Growth Potential: Continued expansion of e-commerce, rising adoption of innovative payment technologies, increase in mobile commerce.
UK Digital Payment Industry Product Landscape
The UK digital payment industry offers a diverse range of products and services, encompassing traditional payment cards (debit and credit) to emerging solutions like mobile wallets, BNPL options, and embedded finance. These solutions are characterized by enhanced security features, user-friendly interfaces, and increased interoperability. The emphasis on seamless and secure transactions drives ongoing innovation and competition, with providers consistently seeking to offer unique selling propositions (USPs) such as faster processing times, lower fees, and superior customer support.
Key Drivers, Barriers & Challenges in UK Digital Payment Industry
Key Drivers:
- Increasing smartphone penetration and internet usage.
- Growing e-commerce and online shopping.
- Government initiatives promoting digital payments.
- Innovation in payment technologies (e.g., BNPL, mobile wallets).
Challenges & Restraints:
- Data security and fraud concerns (impact: xx% of transactions affected by fraud annually).
- Regulatory complexities and compliance costs.
- Competition from established players and FinTech startups.
- Infrastructure limitations in certain regions.
Emerging Opportunities in UK Digital Payment Industry
- Expansion into underserved markets (rural areas, specific demographics).
- Integration of AI and machine learning for enhanced security and personalization.
- Growth of embedded finance solutions within various industries.
- Development of innovative payment solutions tailored to specific industries (e.g., healthcare, hospitality).
Growth Accelerators in the UK Digital Payment Industry Industry
Technological advancements, strategic partnerships between traditional financial institutions and FinTech companies, and the expansion of digital payment infrastructure into previously underserved markets are key factors driving the long-term growth of the UK digital payment industry. Moreover, increasing government support for digital transformation and financial inclusion further accelerates this expansion.
Key Players Shaping the UK Digital Payment Industry Market
- Visa Inc
- Klarna Inc
- Worldpay Inc
- Stripe Inc
- 2Checkout com Inc
- PayPoint plc
- Amazon Payments Inc
- SumUp Inc
- PayPal Payments Private Limited
- Mastercard Inc
Notable Milestones in UK Digital Payment Industry Sector
- November 2023: Square launches Tap to Pay on iPhone in the UK.
- February 2023: ECOMMPAY launches a BNPL solution for UK travel companies.
In-Depth UK Digital Payment Industry Market Outlook
The future of the UK digital payment industry appears exceptionally promising. Continued technological advancements, particularly in areas such as AI-powered fraud detection and personalized payment experiences, will drive further growth. Strategic partnerships and the expansion of embedded finance will create new revenue streams for existing players and opportunities for new entrants. The market presents significant potential for investors and stakeholders willing to capitalize on these emerging trends and contribute to the ongoing transformation of the UK's financial landscape.
UK Digital Payment Industry Segmentation
-
1. Mode of Payment
-
1.1. Point of Sale
- 1.1.1. Card Pay
- 1.1.2. Digital Wallet (includes Mobile Wallets)
- 1.1.3. Cash
- 1.1.4. Others
-
1.2. Online Sale
- 1.2.1. Others (
-
1.1. Point of Sale
-
2. End-user Industry
- 2.1. Retail
- 2.2. Entertainment
- 2.3. Healthcare
- 2.4. Hospitality
- 2.5. Other End-user Industries
UK Digital Payment Industry Segmentation By Geography
-
1. North America
- 1.1. United States
- 1.2. Canada
- 1.3. Mexico
-
2. South America
- 2.1. Brazil
- 2.2. Argentina
- 2.3. Rest of South America
-
3. Europe
- 3.1. United Kingdom
- 3.2. Germany
- 3.3. France
- 3.4. Italy
- 3.5. Spain
- 3.6. Russia
- 3.7. Benelux
- 3.8. Nordics
- 3.9. Rest of Europe
-
4. Middle East & Africa
- 4.1. Turkey
- 4.2. Israel
- 4.3. GCC
- 4.4. North Africa
- 4.5. South Africa
- 4.6. Rest of Middle East & Africa
-
5. Asia Pacific
- 5.1. China
- 5.2. India
- 5.3. Japan
- 5.4. South Korea
- 5.5. ASEAN
- 5.6. Oceania
- 5.7. Rest of Asia Pacific
UK Digital Payment Industry REPORT HIGHLIGHTS
| Aspects | Details |
|---|---|
| Study Period | 2019-2033 |
| Base Year | 2024 |
| Estimated Year | 2025 |
| Forecast Period | 2025-2033 |
| Historical Period | 2019-2024 |
| Growth Rate | CAGR of 11.60% from 2019-2033 |
| Segmentation |
|
Table of Contents
- 1. Introduction
- 1.1. Research Scope
- 1.2. Market Segmentation
- 1.3. Research Methodology
- 1.4. Definitions and Assumptions
- 2. Executive Summary
- 2.1. Introduction
- 3. Market Dynamics
- 3.1. Introduction
- 3.2. Market Drivers
- 3.2.1 High Proliferation of E-commerce
- 3.2.2 including the rise of m-commerce and cross-border e-commerce supported by the increase in purchasing power; Enablement Programs by Key Retailers and Government encouraging digitization of the market; Growth of Real-time Payments
- 3.2.3 especially Buy Now Pay Later in the country
- 3.3. Market Restrains
- 3.3.1. ; Stringent Regulations in the Payments Industry
- 3.4. Market Trends
- 3.4.1. Card Payments to Witness Significant Growth
- 4. Market Factor Analysis
- 4.1. Porters Five Forces
- 4.2. Supply/Value Chain
- 4.3. PESTEL analysis
- 4.4. Market Entropy
- 4.5. Patent/Trademark Analysis
- 5. Global UK Digital Payment Industry Analysis, Insights and Forecast, 2019-2031
- 5.1. Market Analysis, Insights and Forecast - by Mode of Payment
- 5.1.1. Point of Sale
- 5.1.1.1. Card Pay
- 5.1.1.2. Digital Wallet (includes Mobile Wallets)
- 5.1.1.3. Cash
- 5.1.1.4. Others
- 5.1.2. Online Sale
- 5.1.2.1. Others (
- 5.1.1. Point of Sale
- 5.2. Market Analysis, Insights and Forecast - by End-user Industry
- 5.2.1. Retail
- 5.2.2. Entertainment
- 5.2.3. Healthcare
- 5.2.4. Hospitality
- 5.2.5. Other End-user Industries
- 5.3. Market Analysis, Insights and Forecast - by Region
- 5.3.1. North America
- 5.3.2. South America
- 5.3.3. Europe
- 5.3.4. Middle East & Africa
- 5.3.5. Asia Pacific
- 5.1. Market Analysis, Insights and Forecast - by Mode of Payment
- 6. North America UK Digital Payment Industry Analysis, Insights and Forecast, 2019-2031
- 6.1. Market Analysis, Insights and Forecast - by Mode of Payment
- 6.1.1. Point of Sale
- 6.1.1.1. Card Pay
- 6.1.1.2. Digital Wallet (includes Mobile Wallets)
- 6.1.1.3. Cash
- 6.1.1.4. Others
- 6.1.2. Online Sale
- 6.1.2.1. Others (
- 6.1.1. Point of Sale
- 6.2. Market Analysis, Insights and Forecast - by End-user Industry
- 6.2.1. Retail
- 6.2.2. Entertainment
- 6.2.3. Healthcare
- 6.2.4. Hospitality
- 6.2.5. Other End-user Industries
- 6.1. Market Analysis, Insights and Forecast - by Mode of Payment
- 7. South America UK Digital Payment Industry Analysis, Insights and Forecast, 2019-2031
- 7.1. Market Analysis, Insights and Forecast - by Mode of Payment
- 7.1.1. Point of Sale
- 7.1.1.1. Card Pay
- 7.1.1.2. Digital Wallet (includes Mobile Wallets)
- 7.1.1.3. Cash
- 7.1.1.4. Others
- 7.1.2. Online Sale
- 7.1.2.1. Others (
- 7.1.1. Point of Sale
- 7.2. Market Analysis, Insights and Forecast - by End-user Industry
- 7.2.1. Retail
- 7.2.2. Entertainment
- 7.2.3. Healthcare
- 7.2.4. Hospitality
- 7.2.5. Other End-user Industries
- 7.1. Market Analysis, Insights and Forecast - by Mode of Payment
- 8. Europe UK Digital Payment Industry Analysis, Insights and Forecast, 2019-2031
- 8.1. Market Analysis, Insights and Forecast - by Mode of Payment
- 8.1.1. Point of Sale
- 8.1.1.1. Card Pay
- 8.1.1.2. Digital Wallet (includes Mobile Wallets)
- 8.1.1.3. Cash
- 8.1.1.4. Others
- 8.1.2. Online Sale
- 8.1.2.1. Others (
- 8.1.1. Point of Sale
- 8.2. Market Analysis, Insights and Forecast - by End-user Industry
- 8.2.1. Retail
- 8.2.2. Entertainment
- 8.2.3. Healthcare
- 8.2.4. Hospitality
- 8.2.5. Other End-user Industries
- 8.1. Market Analysis, Insights and Forecast - by Mode of Payment
- 9. Middle East & Africa UK Digital Payment Industry Analysis, Insights and Forecast, 2019-2031
- 9.1. Market Analysis, Insights and Forecast - by Mode of Payment
- 9.1.1. Point of Sale
- 9.1.1.1. Card Pay
- 9.1.1.2. Digital Wallet (includes Mobile Wallets)
- 9.1.1.3. Cash
- 9.1.1.4. Others
- 9.1.2. Online Sale
- 9.1.2.1. Others (
- 9.1.1. Point of Sale
- 9.2. Market Analysis, Insights and Forecast - by End-user Industry
- 9.2.1. Retail
- 9.2.2. Entertainment
- 9.2.3. Healthcare
- 9.2.4. Hospitality
- 9.2.5. Other End-user Industries
- 9.1. Market Analysis, Insights and Forecast - by Mode of Payment
- 10. Asia Pacific UK Digital Payment Industry Analysis, Insights and Forecast, 2019-2031
- 10.1. Market Analysis, Insights and Forecast - by Mode of Payment
- 10.1.1. Point of Sale
- 10.1.1.1. Card Pay
- 10.1.1.2. Digital Wallet (includes Mobile Wallets)
- 10.1.1.3. Cash
- 10.1.1.4. Others
- 10.1.2. Online Sale
- 10.1.2.1. Others (
- 10.1.1. Point of Sale
- 10.2. Market Analysis, Insights and Forecast - by End-user Industry
- 10.2.1. Retail
- 10.2.2. Entertainment
- 10.2.3. Healthcare
- 10.2.4. Hospitality
- 10.2.5. Other End-user Industries
- 10.1. Market Analysis, Insights and Forecast - by Mode of Payment
- 11. England UK Digital Payment Industry Analysis, Insights and Forecast, 2019-2031
- 12. Wales UK Digital Payment Industry Analysis, Insights and Forecast, 2019-2031
- 13. Scotland UK Digital Payment Industry Analysis, Insights and Forecast, 2019-2031
- 14. Northern UK Digital Payment Industry Analysis, Insights and Forecast, 2019-2031
- 15. Ireland UK Digital Payment Industry Analysis, Insights and Forecast, 2019-2031
- 16. Competitive Analysis
- 16.1. Global Market Share Analysis 2024
- 16.2. Company Profiles
- 16.2.1 Visa Inc
- 16.2.1.1. Overview
- 16.2.1.2. Products
- 16.2.1.3. SWOT Analysis
- 16.2.1.4. Recent Developments
- 16.2.1.5. Financials (Based on Availability)
- 16.2.2 Klarna Inc
- 16.2.2.1. Overview
- 16.2.2.2. Products
- 16.2.2.3. SWOT Analysis
- 16.2.2.4. Recent Developments
- 16.2.2.5. Financials (Based on Availability)
- 16.2.3 Worldpay Inc
- 16.2.3.1. Overview
- 16.2.3.2. Products
- 16.2.3.3. SWOT Analysis
- 16.2.3.4. Recent Developments
- 16.2.3.5. Financials (Based on Availability)
- 16.2.4 Stripe Inc
- 16.2.4.1. Overview
- 16.2.4.2. Products
- 16.2.4.3. SWOT Analysis
- 16.2.4.4. Recent Developments
- 16.2.4.5. Financials (Based on Availability)
- 16.2.5 2Checkout com Inc
- 16.2.5.1. Overview
- 16.2.5.2. Products
- 16.2.5.3. SWOT Analysis
- 16.2.5.4. Recent Developments
- 16.2.5.5. Financials (Based on Availability)
- 16.2.6 PayPoint plc
- 16.2.6.1. Overview
- 16.2.6.2. Products
- 16.2.6.3. SWOT Analysis
- 16.2.6.4. Recent Developments
- 16.2.6.5. Financials (Based on Availability)
- 16.2.7 Amazon Payments Inc
- 16.2.7.1. Overview
- 16.2.7.2. Products
- 16.2.7.3. SWOT Analysis
- 16.2.7.4. Recent Developments
- 16.2.7.5. Financials (Based on Availability)
- 16.2.8 SumUp Inc *List Not Exhaustive
- 16.2.8.1. Overview
- 16.2.8.2. Products
- 16.2.8.3. SWOT Analysis
- 16.2.8.4. Recent Developments
- 16.2.8.5. Financials (Based on Availability)
- 16.2.9 PayPal Payments Private Limited
- 16.2.9.1. Overview
- 16.2.9.2. Products
- 16.2.9.3. SWOT Analysis
- 16.2.9.4. Recent Developments
- 16.2.9.5. Financials (Based on Availability)
- 16.2.10 Mastercard Inc
- 16.2.10.1. Overview
- 16.2.10.2. Products
- 16.2.10.3. SWOT Analysis
- 16.2.10.4. Recent Developments
- 16.2.10.5. Financials (Based on Availability)
- 16.2.1 Visa Inc
List of Figures
- Figure 1: Global UK Digital Payment Industry Revenue Breakdown (Million, %) by Region 2024 & 2032
- Figure 2: United kingdom Region UK Digital Payment Industry Revenue (Million), by Country 2024 & 2032
- Figure 3: United kingdom Region UK Digital Payment Industry Revenue Share (%), by Country 2024 & 2032
- Figure 4: North America UK Digital Payment Industry Revenue (Million), by Mode of Payment 2024 & 2032
- Figure 5: North America UK Digital Payment Industry Revenue Share (%), by Mode of Payment 2024 & 2032
- Figure 6: North America UK Digital Payment Industry Revenue (Million), by End-user Industry 2024 & 2032
- Figure 7: North America UK Digital Payment Industry Revenue Share (%), by End-user Industry 2024 & 2032
- Figure 8: North America UK Digital Payment Industry Revenue (Million), by Country 2024 & 2032
- Figure 9: North America UK Digital Payment Industry Revenue Share (%), by Country 2024 & 2032
- Figure 10: South America UK Digital Payment Industry Revenue (Million), by Mode of Payment 2024 & 2032
- Figure 11: South America UK Digital Payment Industry Revenue Share (%), by Mode of Payment 2024 & 2032
- Figure 12: South America UK Digital Payment Industry Revenue (Million), by End-user Industry 2024 & 2032
- Figure 13: South America UK Digital Payment Industry Revenue Share (%), by End-user Industry 2024 & 2032
- Figure 14: South America UK Digital Payment Industry Revenue (Million), by Country 2024 & 2032
- Figure 15: South America UK Digital Payment Industry Revenue Share (%), by Country 2024 & 2032
- Figure 16: Europe UK Digital Payment Industry Revenue (Million), by Mode of Payment 2024 & 2032
- Figure 17: Europe UK Digital Payment Industry Revenue Share (%), by Mode of Payment 2024 & 2032
- Figure 18: Europe UK Digital Payment Industry Revenue (Million), by End-user Industry 2024 & 2032
- Figure 19: Europe UK Digital Payment Industry Revenue Share (%), by End-user Industry 2024 & 2032
- Figure 20: Europe UK Digital Payment Industry Revenue (Million), by Country 2024 & 2032
- Figure 21: Europe UK Digital Payment Industry Revenue Share (%), by Country 2024 & 2032
- Figure 22: Middle East & Africa UK Digital Payment Industry Revenue (Million), by Mode of Payment 2024 & 2032
- Figure 23: Middle East & Africa UK Digital Payment Industry Revenue Share (%), by Mode of Payment 2024 & 2032
- Figure 24: Middle East & Africa UK Digital Payment Industry Revenue (Million), by End-user Industry 2024 & 2032
- Figure 25: Middle East & Africa UK Digital Payment Industry Revenue Share (%), by End-user Industry 2024 & 2032
- Figure 26: Middle East & Africa UK Digital Payment Industry Revenue (Million), by Country 2024 & 2032
- Figure 27: Middle East & Africa UK Digital Payment Industry Revenue Share (%), by Country 2024 & 2032
- Figure 28: Asia Pacific UK Digital Payment Industry Revenue (Million), by Mode of Payment 2024 & 2032
- Figure 29: Asia Pacific UK Digital Payment Industry Revenue Share (%), by Mode of Payment 2024 & 2032
- Figure 30: Asia Pacific UK Digital Payment Industry Revenue (Million), by End-user Industry 2024 & 2032
- Figure 31: Asia Pacific UK Digital Payment Industry Revenue Share (%), by End-user Industry 2024 & 2032
- Figure 32: Asia Pacific UK Digital Payment Industry Revenue (Million), by Country 2024 & 2032
- Figure 33: Asia Pacific UK Digital Payment Industry Revenue Share (%), by Country 2024 & 2032
List of Tables
- Table 1: Global UK Digital Payment Industry Revenue Million Forecast, by Region 2019 & 2032
- Table 2: Global UK Digital Payment Industry Revenue Million Forecast, by Mode of Payment 2019 & 2032
- Table 3: Global UK Digital Payment Industry Revenue Million Forecast, by End-user Industry 2019 & 2032
- Table 4: Global UK Digital Payment Industry Revenue Million Forecast, by Region 2019 & 2032
- Table 5: Global UK Digital Payment Industry Revenue Million Forecast, by Country 2019 & 2032
- Table 6: England UK Digital Payment Industry Revenue (Million) Forecast, by Application 2019 & 2032
- Table 7: Wales UK Digital Payment Industry Revenue (Million) Forecast, by Application 2019 & 2032
- Table 8: Scotland UK Digital Payment Industry Revenue (Million) Forecast, by Application 2019 & 2032
- Table 9: Northern UK Digital Payment Industry Revenue (Million) Forecast, by Application 2019 & 2032
- Table 10: Ireland UK Digital Payment Industry Revenue (Million) Forecast, by Application 2019 & 2032
- Table 11: Global UK Digital Payment Industry Revenue Million Forecast, by Mode of Payment 2019 & 2032
- Table 12: Global UK Digital Payment Industry Revenue Million Forecast, by End-user Industry 2019 & 2032
- Table 13: Global UK Digital Payment Industry Revenue Million Forecast, by Country 2019 & 2032
- Table 14: United States UK Digital Payment Industry Revenue (Million) Forecast, by Application 2019 & 2032
- Table 15: Canada UK Digital Payment Industry Revenue (Million) Forecast, by Application 2019 & 2032
- Table 16: Mexico UK Digital Payment Industry Revenue (Million) Forecast, by Application 2019 & 2032
- Table 17: Global UK Digital Payment Industry Revenue Million Forecast, by Mode of Payment 2019 & 2032
- Table 18: Global UK Digital Payment Industry Revenue Million Forecast, by End-user Industry 2019 & 2032
- Table 19: Global UK Digital Payment Industry Revenue Million Forecast, by Country 2019 & 2032
- Table 20: Brazil UK Digital Payment Industry Revenue (Million) Forecast, by Application 2019 & 2032
- Table 21: Argentina UK Digital Payment Industry Revenue (Million) Forecast, by Application 2019 & 2032
- Table 22: Rest of South America UK Digital Payment Industry Revenue (Million) Forecast, by Application 2019 & 2032
- Table 23: Global UK Digital Payment Industry Revenue Million Forecast, by Mode of Payment 2019 & 2032
- Table 24: Global UK Digital Payment Industry Revenue Million Forecast, by End-user Industry 2019 & 2032
- Table 25: Global UK Digital Payment Industry Revenue Million Forecast, by Country 2019 & 2032
- Table 26: United Kingdom UK Digital Payment Industry Revenue (Million) Forecast, by Application 2019 & 2032
- Table 27: Germany UK Digital Payment Industry Revenue (Million) Forecast, by Application 2019 & 2032
- Table 28: France UK Digital Payment Industry Revenue (Million) Forecast, by Application 2019 & 2032
- Table 29: Italy UK Digital Payment Industry Revenue (Million) Forecast, by Application 2019 & 2032
- Table 30: Spain UK Digital Payment Industry Revenue (Million) Forecast, by Application 2019 & 2032
- Table 31: Russia UK Digital Payment Industry Revenue (Million) Forecast, by Application 2019 & 2032
- Table 32: Benelux UK Digital Payment Industry Revenue (Million) Forecast, by Application 2019 & 2032
- Table 33: Nordics UK Digital Payment Industry Revenue (Million) Forecast, by Application 2019 & 2032
- Table 34: Rest of Europe UK Digital Payment Industry Revenue (Million) Forecast, by Application 2019 & 2032
- Table 35: Global UK Digital Payment Industry Revenue Million Forecast, by Mode of Payment 2019 & 2032
- Table 36: Global UK Digital Payment Industry Revenue Million Forecast, by End-user Industry 2019 & 2032
- Table 37: Global UK Digital Payment Industry Revenue Million Forecast, by Country 2019 & 2032
- Table 38: Turkey UK Digital Payment Industry Revenue (Million) Forecast, by Application 2019 & 2032
- Table 39: Israel UK Digital Payment Industry Revenue (Million) Forecast, by Application 2019 & 2032
- Table 40: GCC UK Digital Payment Industry Revenue (Million) Forecast, by Application 2019 & 2032
- Table 41: North Africa UK Digital Payment Industry Revenue (Million) Forecast, by Application 2019 & 2032
- Table 42: South Africa UK Digital Payment Industry Revenue (Million) Forecast, by Application 2019 & 2032
- Table 43: Rest of Middle East & Africa UK Digital Payment Industry Revenue (Million) Forecast, by Application 2019 & 2032
- Table 44: Global UK Digital Payment Industry Revenue Million Forecast, by Mode of Payment 2019 & 2032
- Table 45: Global UK Digital Payment Industry Revenue Million Forecast, by End-user Industry 2019 & 2032
- Table 46: Global UK Digital Payment Industry Revenue Million Forecast, by Country 2019 & 2032
- Table 47: China UK Digital Payment Industry Revenue (Million) Forecast, by Application 2019 & 2032
- Table 48: India UK Digital Payment Industry Revenue (Million) Forecast, by Application 2019 & 2032
- Table 49: Japan UK Digital Payment Industry Revenue (Million) Forecast, by Application 2019 & 2032
- Table 50: South Korea UK Digital Payment Industry Revenue (Million) Forecast, by Application 2019 & 2032
- Table 51: ASEAN UK Digital Payment Industry Revenue (Million) Forecast, by Application 2019 & 2032
- Table 52: Oceania UK Digital Payment Industry Revenue (Million) Forecast, by Application 2019 & 2032
- Table 53: Rest of Asia Pacific UK Digital Payment Industry Revenue (Million) Forecast, by Application 2019 & 2032
Frequently Asked Questions
1. What is the projected Compound Annual Growth Rate (CAGR) of the UK Digital Payment Industry?
The projected CAGR is approximately 11.60%.
2. Which companies are prominent players in the UK Digital Payment Industry?
Key companies in the market include Visa Inc, Klarna Inc, Worldpay Inc, Stripe Inc, 2Checkout com Inc, PayPoint plc, Amazon Payments Inc, SumUp Inc *List Not Exhaustive, PayPal Payments Private Limited, Mastercard Inc.
3. What are the main segments of the UK Digital Payment Industry?
The market segments include Mode of Payment, End-user Industry.
4. Can you provide details about the market size?
The market size is estimated to be USD 490.77 Million as of 2022.
5. What are some drivers contributing to market growth?
High Proliferation of E-commerce. including the rise of m-commerce and cross-border e-commerce supported by the increase in purchasing power; Enablement Programs by Key Retailers and Government encouraging digitization of the market; Growth of Real-time Payments. especially Buy Now Pay Later in the country.
6. What are the notable trends driving market growth?
Card Payments to Witness Significant Growth.
7. Are there any restraints impacting market growth?
; Stringent Regulations in the Payments Industry.
8. Can you provide examples of recent developments in the market?
November 2023 - Square launched Tap to Pay on iPhone across the United Kingdom, making it the third market globally where the company will offer the technology to its sellers. Available within the Square for Retail, Square Point of Sale, and Square Appointments iOS apps, Tap to Pay on iPhone enables sellers of all sizes to accept contactless payments directly from their iPhone, without additional hardware required and at no extra cost.
9. What pricing options are available for accessing the report?
Pricing options include single-user, multi-user, and enterprise licenses priced at USD 3800, USD 4500, and USD 5800 respectively.
10. Is the market size provided in terms of value or volume?
The market size is provided in terms of value, measured in Million.
11. Are there any specific market keywords associated with the report?
Yes, the market keyword associated with the report is "UK Digital Payment Industry," which aids in identifying and referencing the specific market segment covered.
12. How do I determine which pricing option suits my needs best?
The pricing options vary based on user requirements and access needs. Individual users may opt for single-user licenses, while businesses requiring broader access may choose multi-user or enterprise licenses for cost-effective access to the report.
13. Are there any additional resources or data provided in the UK Digital Payment Industry report?
While the report offers comprehensive insights, it's advisable to review the specific contents or supplementary materials provided to ascertain if additional resources or data are available.
14. How can I stay updated on further developments or reports in the UK Digital Payment Industry?
To stay informed about further developments, trends, and reports in the UK Digital Payment Industry, consider subscribing to industry newsletters, following relevant companies and organizations, or regularly checking reputable industry news sources and publications.
Methodology
Step 1 - Identification of Relevant Samples Size from Population Database


Step 2 - Approaches for Defining Global Market Size (Value, Volume* & Price*)

Note*: In applicable scenarios
Step 3 - Data Sources
Primary Research
- Web Analytics
- Survey Reports
- Research Institute
- Latest Research Reports
- Opinion Leaders
Secondary Research
- Annual Reports
- White Paper
- Latest Press Release
- Industry Association
- Paid Database
- Investor Presentations

Step 4 - Data Triangulation
Involves using different sources of information in order to increase the validity of a study
These sources are likely to be stakeholders in a program - participants, other researchers, program staff, other community members, and so on.
Then we put all data in single framework & apply various statistical tools to find out the dynamic on the market.
During the analysis stage, feedback from the stakeholder groups would be compared to determine areas of agreement as well as areas of divergence


