

Key Insights
The Urban Air Mobility (UAM) Infrastructure market is poised for exceptional growth, projected to reach an estimated $15.6 billion in 2025. This rapid expansion is driven by a remarkable Compound Annual Growth Rate (CAGR) of 24.8%, indicating a transformative period for urban transportation. Key drivers fueling this surge include the increasing demand for efficient city planning solutions, the critical need for robust emergency operation capabilities, and the burgeoning adoption of drone operations for diverse commercial and logistical purposes. The market is further propelled by advancements in airport operations, with a growing focus on integrating UAM capabilities, and the development of specialized infrastructure like skytram operations. This dynamic landscape is characterized by significant investment and innovation from a multitude of players, from established aviation giants to specialized UAM infrastructure providers. The anticipated growth is largely attributed to the inherent advantages UAM offers in alleviating urban congestion, reducing travel times, and enhancing logistical efficiency.
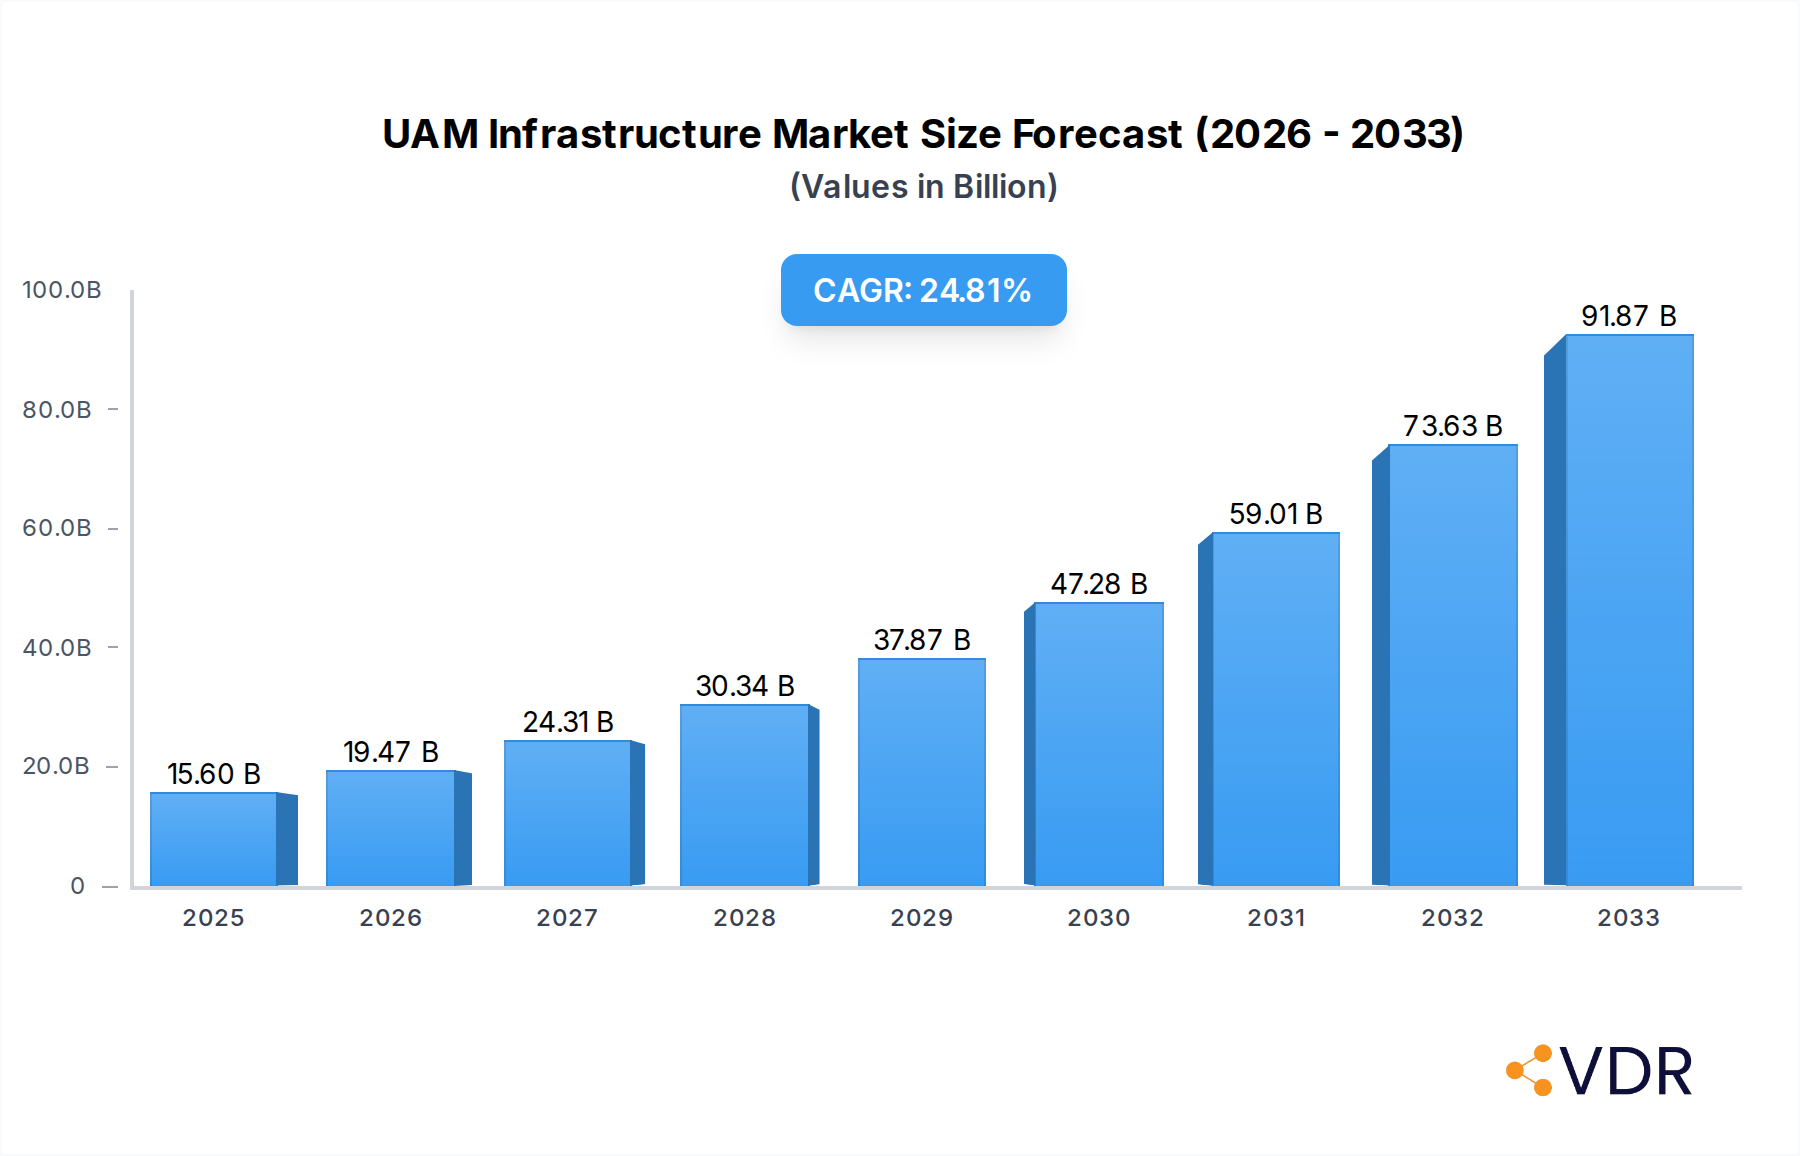
UAM Infrastructure Market Size (In Billion)
The UAM Infrastructure market is set to witness significant evolution, with innovations in areas such as battery technology for electric vertical takeoff and landing (eVTOL) aircraft, advanced air traffic management systems, and the development of vertiports and other ground infrastructure. While opportunities are abundant, certain restraints may influence the pace of adoption, including evolving regulatory frameworks, public perception and acceptance, and the high initial investment costs associated with deploying widespread UAM infrastructure. Nevertheless, the projected market trajectory suggests a substantial and sustained increase in demand for UAM infrastructure solutions across major global regions. North America and Europe are expected to lead in adoption, supported by proactive regulatory environments and substantial private investment. The Asia Pacific region, with its rapidly growing urban centers and technological advancements, is also anticipated to be a significant growth frontier. Emerging markets in the Middle East and Africa, and South America will also contribute to the global expansion as UAM solutions mature and become more accessible.

UAM Infrastructure Company Market Share
Report Title: UAM Infrastructure Market: Global Outlook, Growth Trajectories, and Investment Opportunities (2019-2033)
This comprehensive report delves into the burgeoning Urban Air Mobility (UAM) infrastructure market, providing an in-depth analysis of its dynamics, growth trends, and future outlook. Covering the period from 2019 to 2033, with a base year of 2025, this report is an essential resource for stakeholders seeking to understand the evolving landscape of aerial mobility. We explore the intricate interplay of parent and child markets, offering a nuanced perspective on the drivers, challenges, and opportunities within this transformative sector.
UAM Infrastructure Market Dynamics & Structure
The UAM infrastructure market, currently valued at approximately $35.8 billion in the base year of 2025, exhibits a moderately concentrated structure driven by significant technological advancements and the pressing need for advanced urban planning solutions. Key players are investing heavily in innovation, particularly in vertiports, air traffic management systems, and charging infrastructure, shaping the competitive landscape. The market's growth is fueled by increasing urbanization, the demand for efficient transportation, and the potential to alleviate ground congestion. Regulatory frameworks, while still evolving, are a crucial factor influencing market entry and operational feasibility.
- Market Concentration: Dominated by a few key players in vertiport development and air traffic management solutions, with increasing fragmentation in drone operations and supporting technology.
- Technological Innovation Drivers: Advances in electric vertical takeoff and landing (eVTOL) aircraft, battery technology, autonomous navigation, and digital air traffic control systems are paramount.
- Regulatory Frameworks: Evolving aviation regulations, airspace management protocols, and urban planning integration are critical determinants of market expansion.
- Competitive Product Substitutes: While direct substitutes for UAM infrastructure are limited, improvements in existing ground transportation (e.g., high-speed rail, autonomous vehicles) and traditional aviation represent indirect competitive pressures.
- End-User Demographics: Primarily targeting urban commuters, logistics providers, emergency services, and government agencies seeking efficient and rapid transit solutions.
- M&A Trends: A notable trend of mergers and acquisitions focused on consolidating vertiport networks, acquiring advanced air traffic management technologies, and securing partnerships for eVTOL manufacturing and deployment. M&A deal volumes are projected to increase by 25% by 2028, reflecting the industry's maturation.
UAM Infrastructure Growth Trends & Insights
The global UAM infrastructure market is poised for exponential growth, projected to expand from approximately $35.8 billion in 2025 to an estimated $189.7 billion by 2033, exhibiting a robust Compound Annual Growth Rate (CAGR) of 23.5% during the forecast period (2025-2033). This remarkable trajectory is underpinned by several interconnected growth trends. The increasing adoption of eVTOL aircraft for passenger transport and cargo delivery is a primary catalyst, driving the demand for sophisticated vertiports, charging stations, and advanced air traffic management (ATM) systems. As cities grapple with escalating traffic congestion and environmental concerns, UAM infrastructure offers a viable solution for faster, more sustainable, and efficient mobility.
Technological disruptions are continuously reshaping the UAM infrastructure landscape. Advancements in battery technology are enabling longer flight ranges and faster charging times for eVTOLs, while developments in AI and machine learning are crucial for the safe and efficient management of increasingly complex urban airspace. The integration of digital twin technology for simulating and optimizing vertiport operations and airspace management is another significant trend. Consumer behavior is also shifting, with a growing willingness to embrace novel transportation modes, particularly among younger demographics and in densely populated urban centers, driven by the promise of reduced travel times and enhanced convenience. The UAM market penetration is expected to rise from a nascent stage in 2025 to over 15% in major metropolitan areas by 2033.
The evolution of UAM infrastructure is not merely about vertical flight; it encompasses the entire ecosystem required to support it. This includes the development of robust, scalable, and secure ground infrastructure, such as charging networks, maintenance facilities, and passenger terminals. Furthermore, the maturation of air traffic management systems, moving from current air traffic control paradigms to highly automated and integrated UAM-specific solutions, is critical for safe and efficient operations at scale. Government initiatives and private sector investments are working in tandem, fostering innovation and accelerating the deployment of UAM services. The integration of UAM into existing urban planning frameworks is a growing trend, with cities worldwide actively developing strategies to incorporate aerial mobility into their transportation networks. This holistic approach, addressing both aerial and terrestrial aspects, will be key to unlocking the full potential of UAM and ensuring its sustainable integration into urban life.
Dominant Regions, Countries, or Segments in UAM Infrastructure
The UAM infrastructure market is experiencing dynamic growth across various regions, with North America and Europe currently leading the charge in terms of investment, regulatory development, and pilot program implementation. However, the Asia-Pacific region is rapidly emerging as a significant growth hub, driven by rapid urbanization, increasing disposable incomes, and a strong government push towards technological innovation. Within the Application segment, City Planning is the most dominant driver of UAM infrastructure development. Cities are proactively integrating UAM concepts into their long-term urban development strategies to address traffic congestion, reduce carbon emissions, and enhance connectivity. This involves the planning and construction of vertiports, charging infrastructure, and the establishment of regulatory frameworks to govern aerial mobility within urban airspace. The market share for UAM infrastructure supporting City Planning is estimated at 45% in 2025, with projections indicating continued dominance.
In terms of Types, Airport Operations represent a crucial segment for UAM infrastructure development. This includes the integration of UAM operations into existing airport infrastructure, facilitating seamless transitions between traditional air travel and urban air mobility. This segment benefits from established aviation regulations and infrastructure, making it a more straightforward entry point for UAM services. Airport Operations are expected to hold approximately 35% of the UAM infrastructure market share in 2025, focusing on the development of dedicated vertiports within or adjacent to major airports, and the necessary air traffic management integration.
The Emergency Operation application, while currently a smaller segment with an estimated 15% market share in 2025, holds immense growth potential. UAM infrastructure plays a vital role in enabling rapid response for medical evacuations, disaster relief, and law enforcement activities, especially in areas with limited ground access. Investments in specialized infrastructure, such as emergency landing pads and rapid deployment vertiports, are expected to increase significantly. The Other application segment, encompassing logistics, tourism, and private mobility, accounts for the remaining market share and is expected to grow substantially as UAM becomes more mainstream.
Key drivers for dominance in these segments include:
- Economic Policies and Investment: Favorable government incentives, public-private partnerships, and significant venture capital funding are crucial for infrastructure development. Countries with strong economic bases and forward-thinking investment strategies are attracting more UAM infrastructure projects.
- Infrastructure Development: The presence of advanced existing infrastructure, such as well-developed airport networks and robust digital communication systems, accelerates UAM infrastructure deployment.
- Regulatory Clarity and Support: Clear and supportive regulatory frameworks, including airspace management policies and safety standards, are essential for investor confidence and operational scalability. Regions with proactive regulatory bodies are seeing faster market penetration.
- Technological Adoption and Innovation: A strong ecosystem of technology providers and a willingness to adopt cutting-edge solutions for vertiports, ATM, and charging infrastructure are critical differentiators.
UAM Infrastructure Product Landscape
The UAM infrastructure market is characterized by a rapidly evolving product landscape focused on enabling safe, efficient, and scalable aerial mobility. Key innovations include modular and adaptable vertiports designed for urban integration, featuring advanced charging capabilities and passenger amenities. Smart air traffic management (ATM) systems, leveraging AI and machine learning, are being developed to manage the complex airspace for drones and eVTOLs, ensuring deconfliction and optimized flight paths. High-power charging solutions, including fast-charging stations and battery-swapping technologies, are crucial for maintaining operational efficiency. Furthermore, advanced sensor technologies and communication systems are being integrated into infrastructure to enhance situational awareness and connectivity for airborne vehicles. Performance metrics are being driven by factors such as throughput capacity, charging speed, operational uptime, and compliance with stringent safety regulations.
Key Drivers, Barriers & Challenges in UAM Infrastructure
The UAM infrastructure market is propelled by several key drivers, including increasing urbanization and the resultant traffic congestion, the growing demand for faster and more efficient intra-city and inter-city transportation, and significant advancements in eVTOL technology and battery performance. Government initiatives supporting the development of advanced air mobility ecosystems, coupled with substantial private sector investment, further accelerate market growth.
- Technological Advancements: Breakthroughs in eVTOL design, battery density, and autonomous flight systems are making UAM a viable reality.
- Environmental Concerns: The push for sustainable transportation solutions favors electric-powered UAM operations.
- Economic Incentives: Government grants, tax breaks, and public-private partnerships are spurring infrastructure development.
- Urban Congestion Alleviation: UAM offers a solution to overcrowded ground transportation networks.
Conversely, the market faces significant barriers and challenges that require careful navigation. These include the high cost of infrastructure development, the complex and evolving regulatory landscape, public perception and acceptance of aerial vehicles, and the need for robust cybersecurity measures to protect critical infrastructure.
- High Capital Investment: Significant upfront investment is required for vertiport construction, charging networks, and ATM systems.
- Regulatory Hurdles: Developing comprehensive and harmonized regulations for UAM operations is a protracted process.
- Public Acceptance: Addressing concerns related to noise pollution, safety, and privacy is crucial for widespread adoption.
- Infrastructure Scalability: Ensuring that infrastructure can scale efficiently to meet future demand presents a logistical challenge.
- Supply Chain Constraints: The availability of specialized components and skilled labor can impact development timelines.
- Airspace Integration: Safely integrating UAM traffic with existing air traffic management systems is a complex technical challenge.
Emerging Opportunities in UAM Infrastructure
Emerging opportunities in the UAM infrastructure sector are abundant, particularly in the development of integrated urban mobility hubs that combine vertiports with other transportation modes like public transit and ride-sharing services. The expansion of UAM into cargo and logistics operations presents a significant growth avenue, necessitating the development of specialized drone ports and automated delivery infrastructure. Furthermore, the increasing demand for integrated smart city solutions creates opportunities for UAM infrastructure providers to collaborate with technology companies to develop interconnected mobility networks. Untapped markets in emerging economies, with their rapidly growing urban populations and a need for innovative transportation solutions, represent substantial future potential.
Growth Accelerators in the UAM Infrastructure Industry
Several catalysts are accelerating the growth of the UAM infrastructure industry. Technological breakthroughs in battery technology, leading to longer flight durations and faster charging, are a major accelerator. Strategic partnerships between eVTOL manufacturers, infrastructure developers, and city governments are crucial for creating cohesive deployment strategies. Furthermore, market expansion strategies, including the development of standardized infrastructure solutions and the establishment of robust operational models, are paving the way for wider adoption. The increasing number of pilot programs and successful demonstrations worldwide is building confidence and attracting further investment, creating a virtuous cycle of growth.
Key Players Shaping the UAM Infrastructure Market
- FEV Group
- Groupe ADP
- Skyway
- Urban-Air Port
- Kookiejar
- ResilienX
- Skyports Limited
- Skyscape Corporation
- ANRA Technologies
- BETA Technologies
- Bluenest
- Embention
- Ferrovial
- UrbanV SpA
- Volatus Infrastructure
Notable Milestones in UAM Infrastructure Sector
- 2019: Launch of initial conceptual designs for advanced urban air mobility traffic management systems.
- 2020: Several companies begin pilot programs for drone delivery infrastructure in select urban areas.
- 2021: Significant investment rounds for vertiport developers and air traffic management solution providers.
- 2022: First urban air mobility corridors established in select cities, facilitating test flights for eVTOLs.
- 2023: Increased regulatory discussions and framework development for commercial UAM operations in Europe and North America.
- 2024: Strategic partnerships announced for the development of large-scale vertiport networks in major metropolitan areas.
In-Depth UAM Infrastructure Market Outlook
The future outlook for the UAM infrastructure market is exceptionally promising, driven by a confluence of accelerating factors. Continued technological innovation in eVTOL capabilities and energy storage will significantly enhance operational feasibility and reduce costs. Strategic collaborations among industry leaders, encompassing infrastructure, aviation, and urban planning sectors, will foster integrated solutions and streamline market entry. The proactive engagement of regulatory bodies worldwide is expected to provide greater clarity and create a more conducive environment for investment and deployment. As urban populations continue to grow and the demand for efficient, sustainable transportation intensifies, the UAM infrastructure sector is poised for sustained and substantial expansion, presenting significant opportunities for growth and innovation.
UAM Infrastructure Segmentation
-
1. Application
- 1.1. City Planning
- 1.2. Emergency Operation
- 1.3. Other
-
2. Types
- 2.1. Airport Operations
- 2.2. Skytram Operation
- 2.3. Drone Operations
UAM Infrastructure Segmentation By Geography
-
1. North America
- 1.1. United States
- 1.2. Canada
- 1.3. Mexico
-
2. South America
- 2.1. Brazil
- 2.2. Argentina
- 2.3. Rest of South America
-
3. Europe
- 3.1. United Kingdom
- 3.2. Germany
- 3.3. France
- 3.4. Italy
- 3.5. Spain
- 3.6. Russia
- 3.7. Benelux
- 3.8. Nordics
- 3.9. Rest of Europe
-
4. Middle East & Africa
- 4.1. Turkey
- 4.2. Israel
- 4.3. GCC
- 4.4. North Africa
- 4.5. South Africa
- 4.6. Rest of Middle East & Africa
-
5. Asia Pacific
- 5.1. China
- 5.2. India
- 5.3. Japan
- 5.4. South Korea
- 5.5. ASEAN
- 5.6. Oceania
- 5.7. Rest of Asia Pacific

UAM Infrastructure Regional Market Share
Geographic Coverage of UAM Infrastructure
UAM Infrastructure REPORT HIGHLIGHTS
| Aspects | Details |
|---|---|
| Study Period | 2020-2034 |
| Base Year | 2025 |
| Estimated Year | 2026 |
| Forecast Period | 2026-2034 |
| Historical Period | 2020-2025 |
| Growth Rate | CAGR of 24.8% from 2020-2034 |
| Segmentation |
|
Table of Contents
- 1. Introduction
- 1.1. Research Scope
- 1.2. Market Segmentation
- 1.3. Research Methodology
- 1.4. Definitions and Assumptions
- 2. Executive Summary
- 2.1. Introduction
- 3. Market Dynamics
- 3.1. Introduction
- 3.2. Market Drivers
- 3.3. Market Restrains
- 3.4. Market Trends
- 4. Market Factor Analysis
- 4.1. Porters Five Forces
- 4.2. Supply/Value Chain
- 4.3. PESTEL analysis
- 4.4. Market Entropy
- 4.5. Patent/Trademark Analysis
- 5. Global UAM Infrastructure Analysis, Insights and Forecast, 2020-2032
- 5.1. Market Analysis, Insights and Forecast - by Application
- 5.1.1. City Planning
- 5.1.2. Emergency Operation
- 5.1.3. Other
- 5.2. Market Analysis, Insights and Forecast - by Types
- 5.2.1. Airport Operations
- 5.2.2. Skytram Operation
- 5.2.3. Drone Operations
- 5.3. Market Analysis, Insights and Forecast - by Region
- 5.3.1. North America
- 5.3.2. South America
- 5.3.3. Europe
- 5.3.4. Middle East & Africa
- 5.3.5. Asia Pacific
- 5.1. Market Analysis, Insights and Forecast - by Application
- 6. North America UAM Infrastructure Analysis, Insights and Forecast, 2020-2032
- 6.1. Market Analysis, Insights and Forecast - by Application
- 6.1.1. City Planning
- 6.1.2. Emergency Operation
- 6.1.3. Other
- 6.2. Market Analysis, Insights and Forecast - by Types
- 6.2.1. Airport Operations
- 6.2.2. Skytram Operation
- 6.2.3. Drone Operations
- 6.1. Market Analysis, Insights and Forecast - by Application
- 7. South America UAM Infrastructure Analysis, Insights and Forecast, 2020-2032
- 7.1. Market Analysis, Insights and Forecast - by Application
- 7.1.1. City Planning
- 7.1.2. Emergency Operation
- 7.1.3. Other
- 7.2. Market Analysis, Insights and Forecast - by Types
- 7.2.1. Airport Operations
- 7.2.2. Skytram Operation
- 7.2.3. Drone Operations
- 7.1. Market Analysis, Insights and Forecast - by Application
- 8. Europe UAM Infrastructure Analysis, Insights and Forecast, 2020-2032
- 8.1. Market Analysis, Insights and Forecast - by Application
- 8.1.1. City Planning
- 8.1.2. Emergency Operation
- 8.1.3. Other
- 8.2. Market Analysis, Insights and Forecast - by Types
- 8.2.1. Airport Operations
- 8.2.2. Skytram Operation
- 8.2.3. Drone Operations
- 8.1. Market Analysis, Insights and Forecast - by Application
- 9. Middle East & Africa UAM Infrastructure Analysis, Insights and Forecast, 2020-2032
- 9.1. Market Analysis, Insights and Forecast - by Application
- 9.1.1. City Planning
- 9.1.2. Emergency Operation
- 9.1.3. Other
- 9.2. Market Analysis, Insights and Forecast - by Types
- 9.2.1. Airport Operations
- 9.2.2. Skytram Operation
- 9.2.3. Drone Operations
- 9.1. Market Analysis, Insights and Forecast - by Application
- 10. Asia Pacific UAM Infrastructure Analysis, Insights and Forecast, 2020-2032
- 10.1. Market Analysis, Insights and Forecast - by Application
- 10.1.1. City Planning
- 10.1.2. Emergency Operation
- 10.1.3. Other
- 10.2. Market Analysis, Insights and Forecast - by Types
- 10.2.1. Airport Operations
- 10.2.2. Skytram Operation
- 10.2.3. Drone Operations
- 10.1. Market Analysis, Insights and Forecast - by Application
- 11. Competitive Analysis
- 11.1. Global Market Share Analysis 2025
- 11.2. Company Profiles
- 11.2.1 FEV Group
- 11.2.1.1. Overview
- 11.2.1.2. Products
- 11.2.1.3. SWOT Analysis
- 11.2.1.4. Recent Developments
- 11.2.1.5. Financials (Based on Availability)
- 11.2.2 Groupe ADP
- 11.2.2.1. Overview
- 11.2.2.2. Products
- 11.2.2.3. SWOT Analysis
- 11.2.2.4. Recent Developments
- 11.2.2.5. Financials (Based on Availability)
- 11.2.3 Skyway
- 11.2.3.1. Overview
- 11.2.3.2. Products
- 11.2.3.3. SWOT Analysis
- 11.2.3.4. Recent Developments
- 11.2.3.5. Financials (Based on Availability)
- 11.2.4 Urban-Air Port
- 11.2.4.1. Overview
- 11.2.4.2. Products
- 11.2.4.3. SWOT Analysis
- 11.2.4.4. Recent Developments
- 11.2.4.5. Financials (Based on Availability)
- 11.2.5 Kookiejar
- 11.2.5.1. Overview
- 11.2.5.2. Products
- 11.2.5.3. SWOT Analysis
- 11.2.5.4. Recent Developments
- 11.2.5.5. Financials (Based on Availability)
- 11.2.6 ResilienX
- 11.2.6.1. Overview
- 11.2.6.2. Products
- 11.2.6.3. SWOT Analysis
- 11.2.6.4. Recent Developments
- 11.2.6.5. Financials (Based on Availability)
- 11.2.7 Skyports Limited
- 11.2.7.1. Overview
- 11.2.7.2. Products
- 11.2.7.3. SWOT Analysis
- 11.2.7.4. Recent Developments
- 11.2.7.5. Financials (Based on Availability)
- 11.2.8 Skyscape Corporation
- 11.2.8.1. Overview
- 11.2.8.2. Products
- 11.2.8.3. SWOT Analysis
- 11.2.8.4. Recent Developments
- 11.2.8.5. Financials (Based on Availability)
- 11.2.9 ANRA Technologies
- 11.2.9.1. Overview
- 11.2.9.2. Products
- 11.2.9.3. SWOT Analysis
- 11.2.9.4. Recent Developments
- 11.2.9.5. Financials (Based on Availability)
- 11.2.10 BETA Technologies
- 11.2.10.1. Overview
- 11.2.10.2. Products
- 11.2.10.3. SWOT Analysis
- 11.2.10.4. Recent Developments
- 11.2.10.5. Financials (Based on Availability)
- 11.2.11 Bluenest
- 11.2.11.1. Overview
- 11.2.11.2. Products
- 11.2.11.3. SWOT Analysis
- 11.2.11.4. Recent Developments
- 11.2.11.5. Financials (Based on Availability)
- 11.2.12 Embention
- 11.2.12.1. Overview
- 11.2.12.2. Products
- 11.2.12.3. SWOT Analysis
- 11.2.12.4. Recent Developments
- 11.2.12.5. Financials (Based on Availability)
- 11.2.13 Ferrovial
- 11.2.13.1. Overview
- 11.2.13.2. Products
- 11.2.13.3. SWOT Analysis
- 11.2.13.4. Recent Developments
- 11.2.13.5. Financials (Based on Availability)
- 11.2.14 UrbanV SpA
- 11.2.14.1. Overview
- 11.2.14.2. Products
- 11.2.14.3. SWOT Analysis
- 11.2.14.4. Recent Developments
- 11.2.14.5. Financials (Based on Availability)
- 11.2.15 Volatus Infrastructure
- 11.2.15.1. Overview
- 11.2.15.2. Products
- 11.2.15.3. SWOT Analysis
- 11.2.15.4. Recent Developments
- 11.2.15.5. Financials (Based on Availability)
- 11.2.1 FEV Group
List of Figures
- Figure 1: Global UAM Infrastructure Revenue Breakdown (undefined, %) by Region 2025 & 2033
- Figure 2: North America UAM Infrastructure Revenue (undefined), by Application 2025 & 2033
- Figure 3: North America UAM Infrastructure Revenue Share (%), by Application 2025 & 2033
- Figure 4: North America UAM Infrastructure Revenue (undefined), by Types 2025 & 2033
- Figure 5: North America UAM Infrastructure Revenue Share (%), by Types 2025 & 2033
- Figure 6: North America UAM Infrastructure Revenue (undefined), by Country 2025 & 2033
- Figure 7: North America UAM Infrastructure Revenue Share (%), by Country 2025 & 2033
- Figure 8: South America UAM Infrastructure Revenue (undefined), by Application 2025 & 2033
- Figure 9: South America UAM Infrastructure Revenue Share (%), by Application 2025 & 2033
- Figure 10: South America UAM Infrastructure Revenue (undefined), by Types 2025 & 2033
- Figure 11: South America UAM Infrastructure Revenue Share (%), by Types 2025 & 2033
- Figure 12: South America UAM Infrastructure Revenue (undefined), by Country 2025 & 2033
- Figure 13: South America UAM Infrastructure Revenue Share (%), by Country 2025 & 2033
- Figure 14: Europe UAM Infrastructure Revenue (undefined), by Application 2025 & 2033
- Figure 15: Europe UAM Infrastructure Revenue Share (%), by Application 2025 & 2033
- Figure 16: Europe UAM Infrastructure Revenue (undefined), by Types 2025 & 2033
- Figure 17: Europe UAM Infrastructure Revenue Share (%), by Types 2025 & 2033
- Figure 18: Europe UAM Infrastructure Revenue (undefined), by Country 2025 & 2033
- Figure 19: Europe UAM Infrastructure Revenue Share (%), by Country 2025 & 2033
- Figure 20: Middle East & Africa UAM Infrastructure Revenue (undefined), by Application 2025 & 2033
- Figure 21: Middle East & Africa UAM Infrastructure Revenue Share (%), by Application 2025 & 2033
- Figure 22: Middle East & Africa UAM Infrastructure Revenue (undefined), by Types 2025 & 2033
- Figure 23: Middle East & Africa UAM Infrastructure Revenue Share (%), by Types 2025 & 2033
- Figure 24: Middle East & Africa UAM Infrastructure Revenue (undefined), by Country 2025 & 2033
- Figure 25: Middle East & Africa UAM Infrastructure Revenue Share (%), by Country 2025 & 2033
- Figure 26: Asia Pacific UAM Infrastructure Revenue (undefined), by Application 2025 & 2033
- Figure 27: Asia Pacific UAM Infrastructure Revenue Share (%), by Application 2025 & 2033
- Figure 28: Asia Pacific UAM Infrastructure Revenue (undefined), by Types 2025 & 2033
- Figure 29: Asia Pacific UAM Infrastructure Revenue Share (%), by Types 2025 & 2033
- Figure 30: Asia Pacific UAM Infrastructure Revenue (undefined), by Country 2025 & 2033
- Figure 31: Asia Pacific UAM Infrastructure Revenue Share (%), by Country 2025 & 2033
List of Tables
- Table 1: Global UAM Infrastructure Revenue undefined Forecast, by Application 2020 & 2033
- Table 2: Global UAM Infrastructure Revenue undefined Forecast, by Types 2020 & 2033
- Table 3: Global UAM Infrastructure Revenue undefined Forecast, by Region 2020 & 2033
- Table 4: Global UAM Infrastructure Revenue undefined Forecast, by Application 2020 & 2033
- Table 5: Global UAM Infrastructure Revenue undefined Forecast, by Types 2020 & 2033
- Table 6: Global UAM Infrastructure Revenue undefined Forecast, by Country 2020 & 2033
- Table 7: United States UAM Infrastructure Revenue (undefined) Forecast, by Application 2020 & 2033
- Table 8: Canada UAM Infrastructure Revenue (undefined) Forecast, by Application 2020 & 2033
- Table 9: Mexico UAM Infrastructure Revenue (undefined) Forecast, by Application 2020 & 2033
- Table 10: Global UAM Infrastructure Revenue undefined Forecast, by Application 2020 & 2033
- Table 11: Global UAM Infrastructure Revenue undefined Forecast, by Types 2020 & 2033
- Table 12: Global UAM Infrastructure Revenue undefined Forecast, by Country 2020 & 2033
- Table 13: Brazil UAM Infrastructure Revenue (undefined) Forecast, by Application 2020 & 2033
- Table 14: Argentina UAM Infrastructure Revenue (undefined) Forecast, by Application 2020 & 2033
- Table 15: Rest of South America UAM Infrastructure Revenue (undefined) Forecast, by Application 2020 & 2033
- Table 16: Global UAM Infrastructure Revenue undefined Forecast, by Application 2020 & 2033
- Table 17: Global UAM Infrastructure Revenue undefined Forecast, by Types 2020 & 2033
- Table 18: Global UAM Infrastructure Revenue undefined Forecast, by Country 2020 & 2033
- Table 19: United Kingdom UAM Infrastructure Revenue (undefined) Forecast, by Application 2020 & 2033
- Table 20: Germany UAM Infrastructure Revenue (undefined) Forecast, by Application 2020 & 2033
- Table 21: France UAM Infrastructure Revenue (undefined) Forecast, by Application 2020 & 2033
- Table 22: Italy UAM Infrastructure Revenue (undefined) Forecast, by Application 2020 & 2033
- Table 23: Spain UAM Infrastructure Revenue (undefined) Forecast, by Application 2020 & 2033
- Table 24: Russia UAM Infrastructure Revenue (undefined) Forecast, by Application 2020 & 2033
- Table 25: Benelux UAM Infrastructure Revenue (undefined) Forecast, by Application 2020 & 2033
- Table 26: Nordics UAM Infrastructure Revenue (undefined) Forecast, by Application 2020 & 2033
- Table 27: Rest of Europe UAM Infrastructure Revenue (undefined) Forecast, by Application 2020 & 2033
- Table 28: Global UAM Infrastructure Revenue undefined Forecast, by Application 2020 & 2033
- Table 29: Global UAM Infrastructure Revenue undefined Forecast, by Types 2020 & 2033
- Table 30: Global UAM Infrastructure Revenue undefined Forecast, by Country 2020 & 2033
- Table 31: Turkey UAM Infrastructure Revenue (undefined) Forecast, by Application 2020 & 2033
- Table 32: Israel UAM Infrastructure Revenue (undefined) Forecast, by Application 2020 & 2033
- Table 33: GCC UAM Infrastructure Revenue (undefined) Forecast, by Application 2020 & 2033
- Table 34: North Africa UAM Infrastructure Revenue (undefined) Forecast, by Application 2020 & 2033
- Table 35: South Africa UAM Infrastructure Revenue (undefined) Forecast, by Application 2020 & 2033
- Table 36: Rest of Middle East & Africa UAM Infrastructure Revenue (undefined) Forecast, by Application 2020 & 2033
- Table 37: Global UAM Infrastructure Revenue undefined Forecast, by Application 2020 & 2033
- Table 38: Global UAM Infrastructure Revenue undefined Forecast, by Types 2020 & 2033
- Table 39: Global UAM Infrastructure Revenue undefined Forecast, by Country 2020 & 2033
- Table 40: China UAM Infrastructure Revenue (undefined) Forecast, by Application 2020 & 2033
- Table 41: India UAM Infrastructure Revenue (undefined) Forecast, by Application 2020 & 2033
- Table 42: Japan UAM Infrastructure Revenue (undefined) Forecast, by Application 2020 & 2033
- Table 43: South Korea UAM Infrastructure Revenue (undefined) Forecast, by Application 2020 & 2033
- Table 44: ASEAN UAM Infrastructure Revenue (undefined) Forecast, by Application 2020 & 2033
- Table 45: Oceania UAM Infrastructure Revenue (undefined) Forecast, by Application 2020 & 2033
- Table 46: Rest of Asia Pacific UAM Infrastructure Revenue (undefined) Forecast, by Application 2020 & 2033
Frequently Asked Questions
1. What is the projected Compound Annual Growth Rate (CAGR) of the UAM Infrastructure?
The projected CAGR is approximately 24.8%.
2. Which companies are prominent players in the UAM Infrastructure?
Key companies in the market include FEV Group, Groupe ADP, Skyway, Urban-Air Port, Kookiejar, ResilienX, Skyports Limited, Skyscape Corporation, ANRA Technologies, BETA Technologies, Bluenest, Embention, Ferrovial, UrbanV SpA, Volatus Infrastructure.
3. What are the main segments of the UAM Infrastructure?
The market segments include Application, Types.
4. Can you provide details about the market size?
The market size is estimated to be USD XXX N/A as of 2022.
5. What are some drivers contributing to market growth?
N/A
6. What are the notable trends driving market growth?
N/A
7. Are there any restraints impacting market growth?
N/A
8. Can you provide examples of recent developments in the market?
N/A
9. What pricing options are available for accessing the report?
Pricing options include single-user, multi-user, and enterprise licenses priced at USD 2900.00, USD 4350.00, and USD 5800.00 respectively.
10. Is the market size provided in terms of value or volume?
The market size is provided in terms of value, measured in N/A.
11. Are there any specific market keywords associated with the report?
Yes, the market keyword associated with the report is "UAM Infrastructure," which aids in identifying and referencing the specific market segment covered.
12. How do I determine which pricing option suits my needs best?
The pricing options vary based on user requirements and access needs. Individual users may opt for single-user licenses, while businesses requiring broader access may choose multi-user or enterprise licenses for cost-effective access to the report.
13. Are there any additional resources or data provided in the UAM Infrastructure report?
While the report offers comprehensive insights, it's advisable to review the specific contents or supplementary materials provided to ascertain if additional resources or data are available.
14. How can I stay updated on further developments or reports in the UAM Infrastructure?
To stay informed about further developments, trends, and reports in the UAM Infrastructure, consider subscribing to industry newsletters, following relevant companies and organizations, or regularly checking reputable industry news sources and publications.
Methodology
Step 1 - Identification of Relevant Samples Size from Population Database


Step 2 - Approaches for Defining Global Market Size (Value, Volume* & Price*)

Note*: In applicable scenarios
Step 3 - Data Sources
Primary Research
- Web Analytics
- Survey Reports
- Research Institute
- Latest Research Reports
- Opinion Leaders
Secondary Research
- Annual Reports
- White Paper
- Latest Press Release
- Industry Association
- Paid Database
- Investor Presentations

Step 4 - Data Triangulation
Involves using different sources of information in order to increase the validity of a study
These sources are likely to be stakeholders in a program - participants, other researchers, program staff, other community members, and so on.
Then we put all data in single framework & apply various statistical tools to find out the dynamic on the market.
During the analysis stage, feedback from the stakeholder groups would be compared to determine areas of agreement as well as areas of divergence