


Key Insights
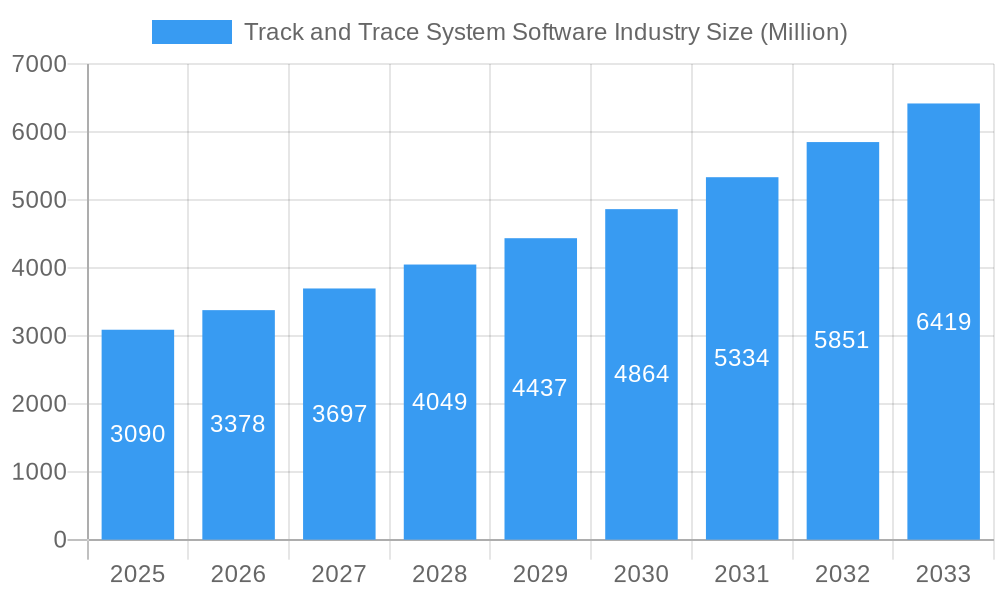
The Track and Trace System Software market is experiencing robust growth, projected to reach $3.09 billion in 2025 and maintain a Compound Annual Growth Rate (CAGR) of 9.31% from 2025 to 2033. This expansion is fueled by several key factors. Increasing regulatory mandates across various industries, particularly pharmaceuticals and medical devices, demanding enhanced product traceability and security are a primary driver. The rising prevalence of counterfeiting and the need to ensure supply chain integrity are also significantly contributing to market growth. Furthermore, technological advancements, such as the integration of advanced analytics and AI capabilities within Track and Trace systems, are improving efficiency and offering deeper insights into product lifecycle management. The market segmentation reveals a strong demand across different applications, with Serialization Solutions and Aggregation Solutions holding significant market share. Geographically, North America and Europe currently dominate the market, but rapidly developing economies in Asia Pacific are poised for substantial growth, driven by increasing adoption of sophisticated supply chain management practices.

Track and Trace System Software Industry Market Size (In Billion)

The competitive landscape is characterized by a mix of established players and emerging technology providers. Major industry participants are strategically investing in research and development to enhance their software offerings, expanding into new geographic markets, and forging partnerships to broaden their reach and customer base. The continued evolution of technologies like Barcode, RFID, and Data Matrix Serialization is creating further opportunities for market expansion. However, challenges remain, including high implementation costs associated with Track and Trace systems and the need for robust data security infrastructure. Addressing these challenges, while capitalizing on technological advancements and evolving regulatory environments, will be crucial for companies to maintain a competitive edge in this dynamic market.
Track and Trace System Software Industry Company Market Share
Track and Trace System Software Industry Market Report: 2019-2033
This comprehensive report provides a detailed analysis of the Track and Trace System Software industry, encompassing market dynamics, growth trends, competitive landscape, and future outlook. The report covers the period from 2019 to 2033, with 2025 as the base and estimated year. The study meticulously examines various segments, including technology (Barcode, RFID), application (Serialization Solutions, Data Matrix Serialization, Aggregation Solutions), and end-users (Pharmaceutical Companies, Medical Device Companies, Other End Users). The market size is analyzed in million units.
Track and Trace System Software Industry Market Dynamics & Structure
The Track and Trace System Software market is characterized by moderate concentration, with several key players vying for market share. Technological innovation, particularly in RFID and data analytics, is a significant growth driver. Stringent regulatory frameworks, especially within the pharmaceutical and medical device sectors, mandate the adoption of track and trace solutions, fueling market expansion. Competitive pressures arise from substitute technologies and the emergence of new entrants. The pharmaceutical industry dominates end-user demand due to stringent regulatory compliance needs. M&A activity has been notable, with several strategic acquisitions bolstering market consolidation.
- Market Concentration: Moderately concentrated, with top 5 players holding approximately xx% market share in 2024.
- Technological Innovation: RFID and AI-powered analytics are key drivers, improving accuracy and efficiency.
- Regulatory Framework: Stringent regulations in pharma and medical devices are primary growth catalysts.
- Competitive Substitutes: Limited, primarily involving alternative data management systems.
- End-User Demographics: Pharmaceutical companies represent the largest segment, followed by medical device companies.
- M&A Trends: Significant activity observed in recent years, with xx major deals concluded between 2019 and 2024.
Track and Trace System Software Industry Growth Trends & Insights
The Track and Trace System Software market experienced significant growth during the historical period (2019-2024), with a CAGR of xx%. This growth is projected to continue during the forecast period (2025-2033), driven by increasing regulatory pressures, rising demand for supply chain transparency, and technological advancements. Adoption rates are highest in developed regions with mature pharmaceutical industries. Technological disruptions, such as the integration of blockchain and AI, are enhancing traceability and security, further boosting market growth. Consumer behavior shifts towards greater product authenticity and safety are fueling demand for enhanced traceability solutions. The market size is expected to reach xx million units by 2033. Market penetration is highest in North America and Europe.
Dominant Regions, Countries, or Segments in Track and Trace System Software Industry
North America holds the largest market share, driven by robust regulatory frameworks and a strong presence of pharmaceutical and medical device companies. Europe follows closely, owing to similar regulatory drivers and a mature healthcare infrastructure. Within technology segments, RFID is gaining traction due to its ability to track items individually, while serialization solutions dominate applications, driven by mandatory serialization requirements in various regions. Pharmaceutical companies remain the largest end-user segment due to stringent regulatory compliance.
- Key Drivers (North America): Stringent FDA regulations, robust pharmaceutical industry, high technological adoption rates.
- Key Drivers (Europe): EU Falsified Medicines Directive, strong healthcare infrastructure, high consumer awareness.
- Technology Segment Drivers: RFID's enhanced tracking capabilities; Serialization solutions' compliance mandates.
- Application Segment Drivers: Serialization solutions for anti-counterfeiting, aggregation for efficient batch tracking.
- End-User Segment Drivers: Pharmaceutical industry's compliance needs; growing demand for medical device traceability.
Track and Trace System Software Industry Product Landscape
The product landscape is characterized by diverse offerings, ranging from basic barcode-based systems to sophisticated RFID and cloud-based solutions incorporating AI and blockchain technologies. Products are differentiated by features such as scalability, integration capabilities, data analytics dashboards, and security protocols. Key selling propositions include enhanced traceability, improved efficiency, reduced counterfeiting, and streamlined regulatory compliance. Technological advancements focus on improving data accuracy, enhancing real-time tracking capabilities, and integrating advanced analytics for predictive maintenance and supply chain optimization.
Key Drivers, Barriers & Challenges in Track and Trace System Software Industry
Key Drivers: Increasing regulatory compliance requirements, growing counterfeiting concerns, the need for enhanced supply chain visibility, and technological advancements in tracking and data analytics are propelling market growth. The rising demand for improved patient safety also contributes significantly.
Challenges: High implementation costs, integration complexities with existing systems, data security concerns, and the need for skilled personnel to manage and interpret the data pose significant challenges. Furthermore, interoperability issues between different systems and evolving regulatory landscapes create ongoing hurdles. Supply chain disruptions can also impact the deployment and effectiveness of track and trace systems.
Emerging Opportunities in Track and Trace System Software Industry
Emerging opportunities include the expansion into untapped markets (e.g., developing economies), the integration of blockchain technology for enhanced security and transparency, the development of AI-powered analytics for predictive maintenance and supply chain optimization, and the increasing focus on integrating track and trace systems into other enterprise resource planning (ERP) software. Moreover, opportunities exist in niche sectors such as food and beverage, and high-value goods.
Growth Accelerators in the Track and Trace System Software Industry
Long-term growth will be accelerated by technological breakthroughs in sensor technology, enabling more precise and real-time tracking. Strategic partnerships between technology providers and industry players will facilitate wider adoption and integration. Expansion into new geographical markets and application areas, such as food safety and logistics, will further expand the market. Governments' initiatives supporting supply chain digitization will also act as growth catalysts.
Key Players Shaping the Track and Trace System Software Market
- Mettler-Toledo International Inc
- SEIDENADER MASCHINENBAU GMBH (MEDIPAK SYSTEMS)
- Axway
- Sea Vision SRL
- Zetes
- Adents
- TraceLink Inc
- Syntegon Technology GmbH
- ACG
- Optel Group
- ANTARES VISION SpA
- Kezzler AS
- Rfxcel Corporation
- Korber Medipak Systems GmbH
- *List Not Exhaustive
Notable Milestones in Track and Trace System Software Industry Sector
- February 2021: Anatres Vision acquired Adents High Tech International, expanding its software portfolio and international presence.
- January 2021: OPTEL and Bureau Veritas partnered to launch V-TRACE for COVID-19 vaccine supply chain logistics.
- December 2020: Domino, Gallarus, and SeaVision developed the K600G blister foil printing solution for pharmaceutical applications.
In-Depth Track and Trace System Software Industry Market Outlook
The Track and Trace System Software market exhibits strong future potential, driven by continuous technological advancements, expanding regulatory requirements, and growing demand for secure and transparent supply chains. Strategic partnerships, market expansion into emerging economies, and the development of innovative solutions will be crucial for unlocking future growth opportunities. The market is poised for significant expansion, with substantial opportunities for companies that can effectively address the challenges and capitalize on emerging trends.
Track and Trace System Software Industry Segmentation
-
1. Product
-
1.1. Hardware Systems
- 1.1.1. Printing and Marking Solutions
- 1.1.2. Monitoring and Verification Solutions
- 1.1.3. Labeling Solutions
- 1.1.4. Other Hardware Systems
-
1.2. Software Solutions
- 1.2.1. Plant Manager Software
- 1.2.2. Line Controller Software
- 1.2.3. Bundle Tracking Software
- 1.2.4. Other Software Solutions
-
1.1. Hardware Systems
-
2. Technology
- 2.1. Barcode
- 2.2. RFID
-
3. Application
-
3.1. Serialization Solutions
- 3.1.1. Bottle Serialization
- 3.1.2. Label Serialization
- 3.1.3. Carton Serialization
- 3.1.4. Data Matrix Serialization
-
3.2. Aggregation Solutions
- 3.2.1. Bundle Aggregation
- 3.2.2. Case Aggregation
- 3.2.3. Pallet Aggregation
-
3.1. Serialization Solutions
-
4. End User
- 4.1. Pharmaceutical Companies
- 4.2. Medical Device Companies
- 4.3. Other End Users
Track and Trace System Software Industry Segmentation By Geography
-
1. North America
- 1.1. United States
- 1.2. Canada
- 1.3. Mexico
-
2. Europe
- 2.1. Germany
- 2.2. United Kingdom
- 2.3. France
- 2.4. Italy
- 2.5. Spain
- 2.6. Rest of Europe
-
3. Asia Pacific
- 3.1. China
- 3.2. Japan
- 3.3. India
- 3.4. Australia
- 3.5. South Korea
- 3.6. Rest of Asia Pacific
-
4. Middle East and Africa
- 4.1. GCC
- 4.2. South Africa
- 4.3. Rest of Middle East and Africa
-
5. South America
- 5.1. Brazil
- 5.2. Argentina
- 5.3. Rest of South America

Track and Trace System Software Industry Regional Market Share
Geographic Coverage of Track and Trace System Software Industry
Track and Trace System Software Industry REPORT HIGHLIGHTS
| Aspects | Details |
|---|---|
| Study Period | 2020-2034 |
| Base Year | 2025 |
| Estimated Year | 2026 |
| Forecast Period | 2026-2034 |
| Historical Period | 2020-2025 |
| Growth Rate | CAGR of 9.31% from 2020-2034 |
| Segmentation |
|
Table of Contents
- 1. Introduction
- 1.1. Research Scope
- 1.2. Market Segmentation
- 1.3. Research Methodology
- 1.4. Definitions and Assumptions
- 2. Executive Summary
- 2.1. Introduction
- 3. Market Dynamics
- 3.1. Introduction
- 3.2. Market Drivers
- 3.2.1. Growth in the Medical Devices and Pharmaceutical Industries and Increase in Implementation of Serialization; Rise in the Number of Packaging-related Product Recalls; Increasing Number of Counterfeit Drugs
- 3.3. Market Restrains
- 3.3.1. High Costs Associated with Serialization and Aggregation; Lack of Common Standards for Serialization and Aggregation
- 3.4. Market Trends
- 3.4.1. RFID Technology is Expected to Observe a Good Growth in the Track and Trace Solutions Market
- 4. Market Factor Analysis
- 4.1. Porters Five Forces
- 4.2. Supply/Value Chain
- 4.3. PESTEL analysis
- 4.4. Market Entropy
- 4.5. Patent/Trademark Analysis
- 5. Global Track and Trace System Software Industry Analysis, Insights and Forecast, 2020-2032
- 5.1. Market Analysis, Insights and Forecast - by Product
- 5.1.1. Hardware Systems
- 5.1.1.1. Printing and Marking Solutions
- 5.1.1.2. Monitoring and Verification Solutions
- 5.1.1.3. Labeling Solutions
- 5.1.1.4. Other Hardware Systems
- 5.1.2. Software Solutions
- 5.1.2.1. Plant Manager Software
- 5.1.2.2. Line Controller Software
- 5.1.2.3. Bundle Tracking Software
- 5.1.2.4. Other Software Solutions
- 5.1.1. Hardware Systems
- 5.2. Market Analysis, Insights and Forecast - by Technology
- 5.2.1. Barcode
- 5.2.2. RFID
- 5.3. Market Analysis, Insights and Forecast - by Application
- 5.3.1. Serialization Solutions
- 5.3.1.1. Bottle Serialization
- 5.3.1.2. Label Serialization
- 5.3.1.3. Carton Serialization
- 5.3.1.4. Data Matrix Serialization
- 5.3.2. Aggregation Solutions
- 5.3.2.1. Bundle Aggregation
- 5.3.2.2. Case Aggregation
- 5.3.2.3. Pallet Aggregation
- 5.3.1. Serialization Solutions
- 5.4. Market Analysis, Insights and Forecast - by End User
- 5.4.1. Pharmaceutical Companies
- 5.4.2. Medical Device Companies
- 5.4.3. Other End Users
- 5.5. Market Analysis, Insights and Forecast - by Region
- 5.5.1. North America
- 5.5.2. Europe
- 5.5.3. Asia Pacific
- 5.5.4. Middle East and Africa
- 5.5.5. South America
- 5.1. Market Analysis, Insights and Forecast - by Product
- 6. North America Track and Trace System Software Industry Analysis, Insights and Forecast, 2020-2032
- 6.1. Market Analysis, Insights and Forecast - by Product
- 6.1.1. Hardware Systems
- 6.1.1.1. Printing and Marking Solutions
- 6.1.1.2. Monitoring and Verification Solutions
- 6.1.1.3. Labeling Solutions
- 6.1.1.4. Other Hardware Systems
- 6.1.2. Software Solutions
- 6.1.2.1. Plant Manager Software
- 6.1.2.2. Line Controller Software
- 6.1.2.3. Bundle Tracking Software
- 6.1.2.4. Other Software Solutions
- 6.1.1. Hardware Systems
- 6.2. Market Analysis, Insights and Forecast - by Technology
- 6.2.1. Barcode
- 6.2.2. RFID
- 6.3. Market Analysis, Insights and Forecast - by Application
- 6.3.1. Serialization Solutions
- 6.3.1.1. Bottle Serialization
- 6.3.1.2. Label Serialization
- 6.3.1.3. Carton Serialization
- 6.3.1.4. Data Matrix Serialization
- 6.3.2. Aggregation Solutions
- 6.3.2.1. Bundle Aggregation
- 6.3.2.2. Case Aggregation
- 6.3.2.3. Pallet Aggregation
- 6.3.1. Serialization Solutions
- 6.4. Market Analysis, Insights and Forecast - by End User
- 6.4.1. Pharmaceutical Companies
- 6.4.2. Medical Device Companies
- 6.4.3. Other End Users
- 6.1. Market Analysis, Insights and Forecast - by Product
- 7. Europe Track and Trace System Software Industry Analysis, Insights and Forecast, 2020-2032
- 7.1. Market Analysis, Insights and Forecast - by Product
- 7.1.1. Hardware Systems
- 7.1.1.1. Printing and Marking Solutions
- 7.1.1.2. Monitoring and Verification Solutions
- 7.1.1.3. Labeling Solutions
- 7.1.1.4. Other Hardware Systems
- 7.1.2. Software Solutions
- 7.1.2.1. Plant Manager Software
- 7.1.2.2. Line Controller Software
- 7.1.2.3. Bundle Tracking Software
- 7.1.2.4. Other Software Solutions
- 7.1.1. Hardware Systems
- 7.2. Market Analysis, Insights and Forecast - by Technology
- 7.2.1. Barcode
- 7.2.2. RFID
- 7.3. Market Analysis, Insights and Forecast - by Application
- 7.3.1. Serialization Solutions
- 7.3.1.1. Bottle Serialization
- 7.3.1.2. Label Serialization
- 7.3.1.3. Carton Serialization
- 7.3.1.4. Data Matrix Serialization
- 7.3.2. Aggregation Solutions
- 7.3.2.1. Bundle Aggregation
- 7.3.2.2. Case Aggregation
- 7.3.2.3. Pallet Aggregation
- 7.3.1. Serialization Solutions
- 7.4. Market Analysis, Insights and Forecast - by End User
- 7.4.1. Pharmaceutical Companies
- 7.4.2. Medical Device Companies
- 7.4.3. Other End Users
- 7.1. Market Analysis, Insights and Forecast - by Product
- 8. Asia Pacific Track and Trace System Software Industry Analysis, Insights and Forecast, 2020-2032
- 8.1. Market Analysis, Insights and Forecast - by Product
- 8.1.1. Hardware Systems
- 8.1.1.1. Printing and Marking Solutions
- 8.1.1.2. Monitoring and Verification Solutions
- 8.1.1.3. Labeling Solutions
- 8.1.1.4. Other Hardware Systems
- 8.1.2. Software Solutions
- 8.1.2.1. Plant Manager Software
- 8.1.2.2. Line Controller Software
- 8.1.2.3. Bundle Tracking Software
- 8.1.2.4. Other Software Solutions
- 8.1.1. Hardware Systems
- 8.2. Market Analysis, Insights and Forecast - by Technology
- 8.2.1. Barcode
- 8.2.2. RFID
- 8.3. Market Analysis, Insights and Forecast - by Application
- 8.3.1. Serialization Solutions
- 8.3.1.1. Bottle Serialization
- 8.3.1.2. Label Serialization
- 8.3.1.3. Carton Serialization
- 8.3.1.4. Data Matrix Serialization
- 8.3.2. Aggregation Solutions
- 8.3.2.1. Bundle Aggregation
- 8.3.2.2. Case Aggregation
- 8.3.2.3. Pallet Aggregation
- 8.3.1. Serialization Solutions
- 8.4. Market Analysis, Insights and Forecast - by End User
- 8.4.1. Pharmaceutical Companies
- 8.4.2. Medical Device Companies
- 8.4.3. Other End Users
- 8.1. Market Analysis, Insights and Forecast - by Product
- 9. Middle East and Africa Track and Trace System Software Industry Analysis, Insights and Forecast, 2020-2032
- 9.1. Market Analysis, Insights and Forecast - by Product
- 9.1.1. Hardware Systems
- 9.1.1.1. Printing and Marking Solutions
- 9.1.1.2. Monitoring and Verification Solutions
- 9.1.1.3. Labeling Solutions
- 9.1.1.4. Other Hardware Systems
- 9.1.2. Software Solutions
- 9.1.2.1. Plant Manager Software
- 9.1.2.2. Line Controller Software
- 9.1.2.3. Bundle Tracking Software
- 9.1.2.4. Other Software Solutions
- 9.1.1. Hardware Systems
- 9.2. Market Analysis, Insights and Forecast - by Technology
- 9.2.1. Barcode
- 9.2.2. RFID
- 9.3. Market Analysis, Insights and Forecast - by Application
- 9.3.1. Serialization Solutions
- 9.3.1.1. Bottle Serialization
- 9.3.1.2. Label Serialization
- 9.3.1.3. Carton Serialization
- 9.3.1.4. Data Matrix Serialization
- 9.3.2. Aggregation Solutions
- 9.3.2.1. Bundle Aggregation
- 9.3.2.2. Case Aggregation
- 9.3.2.3. Pallet Aggregation
- 9.3.1. Serialization Solutions
- 9.4. Market Analysis, Insights and Forecast - by End User
- 9.4.1. Pharmaceutical Companies
- 9.4.2. Medical Device Companies
- 9.4.3. Other End Users
- 9.1. Market Analysis, Insights and Forecast - by Product
- 10. South America Track and Trace System Software Industry Analysis, Insights and Forecast, 2020-2032
- 10.1. Market Analysis, Insights and Forecast - by Product
- 10.1.1. Hardware Systems
- 10.1.1.1. Printing and Marking Solutions
- 10.1.1.2. Monitoring and Verification Solutions
- 10.1.1.3. Labeling Solutions
- 10.1.1.4. Other Hardware Systems
- 10.1.2. Software Solutions
- 10.1.2.1. Plant Manager Software
- 10.1.2.2. Line Controller Software
- 10.1.2.3. Bundle Tracking Software
- 10.1.2.4. Other Software Solutions
- 10.1.1. Hardware Systems
- 10.2. Market Analysis, Insights and Forecast - by Technology
- 10.2.1. Barcode
- 10.2.2. RFID
- 10.3. Market Analysis, Insights and Forecast - by Application
- 10.3.1. Serialization Solutions
- 10.3.1.1. Bottle Serialization
- 10.3.1.2. Label Serialization
- 10.3.1.3. Carton Serialization
- 10.3.1.4. Data Matrix Serialization
- 10.3.2. Aggregation Solutions
- 10.3.2.1. Bundle Aggregation
- 10.3.2.2. Case Aggregation
- 10.3.2.3. Pallet Aggregation
- 10.3.1. Serialization Solutions
- 10.4. Market Analysis, Insights and Forecast - by End User
- 10.4.1. Pharmaceutical Companies
- 10.4.2. Medical Device Companies
- 10.4.3. Other End Users
- 10.1. Market Analysis, Insights and Forecast - by Product
- 11. Competitive Analysis
- 11.1. Global Market Share Analysis 2025
- 11.2. Company Profiles
- 11.2.1 Mettler-Toledo International Inc
- 11.2.1.1. Overview
- 11.2.1.2. Products
- 11.2.1.3. SWOT Analysis
- 11.2.1.4. Recent Developments
- 11.2.1.5. Financials (Based on Availability)
- 11.2.2 SEIDENADER MASCHINENBAU GMBH (MEDIPAK SYSTEMS)
- 11.2.2.1. Overview
- 11.2.2.2. Products
- 11.2.2.3. SWOT Analysis
- 11.2.2.4. Recent Developments
- 11.2.2.5. Financials (Based on Availability)
- 11.2.3 Axway
- 11.2.3.1. Overview
- 11.2.3.2. Products
- 11.2.3.3. SWOT Analysis
- 11.2.3.4. Recent Developments
- 11.2.3.5. Financials (Based on Availability)
- 11.2.4 Sea Vision SRL
- 11.2.4.1. Overview
- 11.2.4.2. Products
- 11.2.4.3. SWOT Analysis
- 11.2.4.4. Recent Developments
- 11.2.4.5. Financials (Based on Availability)
- 11.2.5 Zetes
- 11.2.5.1. Overview
- 11.2.5.2. Products
- 11.2.5.3. SWOT Analysis
- 11.2.5.4. Recent Developments
- 11.2.5.5. Financials (Based on Availability)
- 11.2.6 Adents
- 11.2.6.1. Overview
- 11.2.6.2. Products
- 11.2.6.3. SWOT Analysis
- 11.2.6.4. Recent Developments
- 11.2.6.5. Financials (Based on Availability)
- 11.2.7 TraceLink Inc
- 11.2.7.1. Overview
- 11.2.7.2. Products
- 11.2.7.3. SWOT Analysis
- 11.2.7.4. Recent Developments
- 11.2.7.5. Financials (Based on Availability)
- 11.2.8 Syntegon Technology GmbH
- 11.2.8.1. Overview
- 11.2.8.2. Products
- 11.2.8.3. SWOT Analysis
- 11.2.8.4. Recent Developments
- 11.2.8.5. Financials (Based on Availability)
- 11.2.9 ACG
- 11.2.9.1. Overview
- 11.2.9.2. Products
- 11.2.9.3. SWOT Analysis
- 11.2.9.4. Recent Developments
- 11.2.9.5. Financials (Based on Availability)
- 11.2.10 Optel Group
- 11.2.10.1. Overview
- 11.2.10.2. Products
- 11.2.10.3. SWOT Analysis
- 11.2.10.4. Recent Developments
- 11.2.10.5. Financials (Based on Availability)
- 11.2.11 ANTARES VISION SpA
- 11.2.11.1. Overview
- 11.2.11.2. Products
- 11.2.11.3. SWOT Analysis
- 11.2.11.4. Recent Developments
- 11.2.11.5. Financials (Based on Availability)
- 11.2.12 Kezzler AS
- 11.2.12.1. Overview
- 11.2.12.2. Products
- 11.2.12.3. SWOT Analysis
- 11.2.12.4. Recent Developments
- 11.2.12.5. Financials (Based on Availability)
- 11.2.13 Rfxcel Corporation
- 11.2.13.1. Overview
- 11.2.13.2. Products
- 11.2.13.3. SWOT Analysis
- 11.2.13.4. Recent Developments
- 11.2.13.5. Financials (Based on Availability)
- 11.2.14 Korber Medipak Systems GmbH*List Not Exhaustive
- 11.2.14.1. Overview
- 11.2.14.2. Products
- 11.2.14.3. SWOT Analysis
- 11.2.14.4. Recent Developments
- 11.2.14.5. Financials (Based on Availability)
- 11.2.1 Mettler-Toledo International Inc
List of Figures
- Figure 1: Global Track and Trace System Software Industry Revenue Breakdown (Million, %) by Region 2025 & 2033
- Figure 2: North America Track and Trace System Software Industry Revenue (Million), by Product 2025 & 2033
- Figure 3: North America Track and Trace System Software Industry Revenue Share (%), by Product 2025 & 2033
- Figure 4: North America Track and Trace System Software Industry Revenue (Million), by Technology 2025 & 2033
- Figure 5: North America Track and Trace System Software Industry Revenue Share (%), by Technology 2025 & 2033
- Figure 6: North America Track and Trace System Software Industry Revenue (Million), by Application 2025 & 2033
- Figure 7: North America Track and Trace System Software Industry Revenue Share (%), by Application 2025 & 2033
- Figure 8: North America Track and Trace System Software Industry Revenue (Million), by End User 2025 & 2033
- Figure 9: North America Track and Trace System Software Industry Revenue Share (%), by End User 2025 & 2033
- Figure 10: North America Track and Trace System Software Industry Revenue (Million), by Country 2025 & 2033
- Figure 11: North America Track and Trace System Software Industry Revenue Share (%), by Country 2025 & 2033
- Figure 12: Europe Track and Trace System Software Industry Revenue (Million), by Product 2025 & 2033
- Figure 13: Europe Track and Trace System Software Industry Revenue Share (%), by Product 2025 & 2033
- Figure 14: Europe Track and Trace System Software Industry Revenue (Million), by Technology 2025 & 2033
- Figure 15: Europe Track and Trace System Software Industry Revenue Share (%), by Technology 2025 & 2033
- Figure 16: Europe Track and Trace System Software Industry Revenue (Million), by Application 2025 & 2033
- Figure 17: Europe Track and Trace System Software Industry Revenue Share (%), by Application 2025 & 2033
- Figure 18: Europe Track and Trace System Software Industry Revenue (Million), by End User 2025 & 2033
- Figure 19: Europe Track and Trace System Software Industry Revenue Share (%), by End User 2025 & 2033
- Figure 20: Europe Track and Trace System Software Industry Revenue (Million), by Country 2025 & 2033
- Figure 21: Europe Track and Trace System Software Industry Revenue Share (%), by Country 2025 & 2033
- Figure 22: Asia Pacific Track and Trace System Software Industry Revenue (Million), by Product 2025 & 2033
- Figure 23: Asia Pacific Track and Trace System Software Industry Revenue Share (%), by Product 2025 & 2033
- Figure 24: Asia Pacific Track and Trace System Software Industry Revenue (Million), by Technology 2025 & 2033
- Figure 25: Asia Pacific Track and Trace System Software Industry Revenue Share (%), by Technology 2025 & 2033
- Figure 26: Asia Pacific Track and Trace System Software Industry Revenue (Million), by Application 2025 & 2033
- Figure 27: Asia Pacific Track and Trace System Software Industry Revenue Share (%), by Application 2025 & 2033
- Figure 28: Asia Pacific Track and Trace System Software Industry Revenue (Million), by End User 2025 & 2033
- Figure 29: Asia Pacific Track and Trace System Software Industry Revenue Share (%), by End User 2025 & 2033
- Figure 30: Asia Pacific Track and Trace System Software Industry Revenue (Million), by Country 2025 & 2033
- Figure 31: Asia Pacific Track and Trace System Software Industry Revenue Share (%), by Country 2025 & 2033
- Figure 32: Middle East and Africa Track and Trace System Software Industry Revenue (Million), by Product 2025 & 2033
- Figure 33: Middle East and Africa Track and Trace System Software Industry Revenue Share (%), by Product 2025 & 2033
- Figure 34: Middle East and Africa Track and Trace System Software Industry Revenue (Million), by Technology 2025 & 2033
- Figure 35: Middle East and Africa Track and Trace System Software Industry Revenue Share (%), by Technology 2025 & 2033
- Figure 36: Middle East and Africa Track and Trace System Software Industry Revenue (Million), by Application 2025 & 2033
- Figure 37: Middle East and Africa Track and Trace System Software Industry Revenue Share (%), by Application 2025 & 2033
- Figure 38: Middle East and Africa Track and Trace System Software Industry Revenue (Million), by End User 2025 & 2033
- Figure 39: Middle East and Africa Track and Trace System Software Industry Revenue Share (%), by End User 2025 & 2033
- Figure 40: Middle East and Africa Track and Trace System Software Industry Revenue (Million), by Country 2025 & 2033
- Figure 41: Middle East and Africa Track and Trace System Software Industry Revenue Share (%), by Country 2025 & 2033
- Figure 42: South America Track and Trace System Software Industry Revenue (Million), by Product 2025 & 2033
- Figure 43: South America Track and Trace System Software Industry Revenue Share (%), by Product 2025 & 2033
- Figure 44: South America Track and Trace System Software Industry Revenue (Million), by Technology 2025 & 2033
- Figure 45: South America Track and Trace System Software Industry Revenue Share (%), by Technology 2025 & 2033
- Figure 46: South America Track and Trace System Software Industry Revenue (Million), by Application 2025 & 2033
- Figure 47: South America Track and Trace System Software Industry Revenue Share (%), by Application 2025 & 2033
- Figure 48: South America Track and Trace System Software Industry Revenue (Million), by End User 2025 & 2033
- Figure 49: South America Track and Trace System Software Industry Revenue Share (%), by End User 2025 & 2033
- Figure 50: South America Track and Trace System Software Industry Revenue (Million), by Country 2025 & 2033
- Figure 51: South America Track and Trace System Software Industry Revenue Share (%), by Country 2025 & 2033
List of Tables
- Table 1: Global Track and Trace System Software Industry Revenue Million Forecast, by Product 2020 & 2033
- Table 2: Global Track and Trace System Software Industry Revenue Million Forecast, by Technology 2020 & 2033
- Table 3: Global Track and Trace System Software Industry Revenue Million Forecast, by Application 2020 & 2033
- Table 4: Global Track and Trace System Software Industry Revenue Million Forecast, by End User 2020 & 2033
- Table 5: Global Track and Trace System Software Industry Revenue Million Forecast, by Region 2020 & 2033
- Table 6: Global Track and Trace System Software Industry Revenue Million Forecast, by Product 2020 & 2033
- Table 7: Global Track and Trace System Software Industry Revenue Million Forecast, by Technology 2020 & 2033
- Table 8: Global Track and Trace System Software Industry Revenue Million Forecast, by Application 2020 & 2033
- Table 9: Global Track and Trace System Software Industry Revenue Million Forecast, by End User 2020 & 2033
- Table 10: Global Track and Trace System Software Industry Revenue Million Forecast, by Country 2020 & 2033
- Table 11: United States Track and Trace System Software Industry Revenue (Million) Forecast, by Application 2020 & 2033
- Table 12: Canada Track and Trace System Software Industry Revenue (Million) Forecast, by Application 2020 & 2033
- Table 13: Mexico Track and Trace System Software Industry Revenue (Million) Forecast, by Application 2020 & 2033
- Table 14: Global Track and Trace System Software Industry Revenue Million Forecast, by Product 2020 & 2033
- Table 15: Global Track and Trace System Software Industry Revenue Million Forecast, by Technology 2020 & 2033
- Table 16: Global Track and Trace System Software Industry Revenue Million Forecast, by Application 2020 & 2033
- Table 17: Global Track and Trace System Software Industry Revenue Million Forecast, by End User 2020 & 2033
- Table 18: Global Track and Trace System Software Industry Revenue Million Forecast, by Country 2020 & 2033
- Table 19: Germany Track and Trace System Software Industry Revenue (Million) Forecast, by Application 2020 & 2033
- Table 20: United Kingdom Track and Trace System Software Industry Revenue (Million) Forecast, by Application 2020 & 2033
- Table 21: France Track and Trace System Software Industry Revenue (Million) Forecast, by Application 2020 & 2033
- Table 22: Italy Track and Trace System Software Industry Revenue (Million) Forecast, by Application 2020 & 2033
- Table 23: Spain Track and Trace System Software Industry Revenue (Million) Forecast, by Application 2020 & 2033
- Table 24: Rest of Europe Track and Trace System Software Industry Revenue (Million) Forecast, by Application 2020 & 2033
- Table 25: Global Track and Trace System Software Industry Revenue Million Forecast, by Product 2020 & 2033
- Table 26: Global Track and Trace System Software Industry Revenue Million Forecast, by Technology 2020 & 2033
- Table 27: Global Track and Trace System Software Industry Revenue Million Forecast, by Application 2020 & 2033
- Table 28: Global Track and Trace System Software Industry Revenue Million Forecast, by End User 2020 & 2033
- Table 29: Global Track and Trace System Software Industry Revenue Million Forecast, by Country 2020 & 2033
- Table 30: China Track and Trace System Software Industry Revenue (Million) Forecast, by Application 2020 & 2033
- Table 31: Japan Track and Trace System Software Industry Revenue (Million) Forecast, by Application 2020 & 2033
- Table 32: India Track and Trace System Software Industry Revenue (Million) Forecast, by Application 2020 & 2033
- Table 33: Australia Track and Trace System Software Industry Revenue (Million) Forecast, by Application 2020 & 2033
- Table 34: South Korea Track and Trace System Software Industry Revenue (Million) Forecast, by Application 2020 & 2033
- Table 35: Rest of Asia Pacific Track and Trace System Software Industry Revenue (Million) Forecast, by Application 2020 & 2033
- Table 36: Global Track and Trace System Software Industry Revenue Million Forecast, by Product 2020 & 2033
- Table 37: Global Track and Trace System Software Industry Revenue Million Forecast, by Technology 2020 & 2033
- Table 38: Global Track and Trace System Software Industry Revenue Million Forecast, by Application 2020 & 2033
- Table 39: Global Track and Trace System Software Industry Revenue Million Forecast, by End User 2020 & 2033
- Table 40: Global Track and Trace System Software Industry Revenue Million Forecast, by Country 2020 & 2033
- Table 41: GCC Track and Trace System Software Industry Revenue (Million) Forecast, by Application 2020 & 2033
- Table 42: South Africa Track and Trace System Software Industry Revenue (Million) Forecast, by Application 2020 & 2033
- Table 43: Rest of Middle East and Africa Track and Trace System Software Industry Revenue (Million) Forecast, by Application 2020 & 2033
- Table 44: Global Track and Trace System Software Industry Revenue Million Forecast, by Product 2020 & 2033
- Table 45: Global Track and Trace System Software Industry Revenue Million Forecast, by Technology 2020 & 2033
- Table 46: Global Track and Trace System Software Industry Revenue Million Forecast, by Application 2020 & 2033
- Table 47: Global Track and Trace System Software Industry Revenue Million Forecast, by End User 2020 & 2033
- Table 48: Global Track and Trace System Software Industry Revenue Million Forecast, by Country 2020 & 2033
- Table 49: Brazil Track and Trace System Software Industry Revenue (Million) Forecast, by Application 2020 & 2033
- Table 50: Argentina Track and Trace System Software Industry Revenue (Million) Forecast, by Application 2020 & 2033
- Table 51: Rest of South America Track and Trace System Software Industry Revenue (Million) Forecast, by Application 2020 & 2033
Frequently Asked Questions
1. What is the projected Compound Annual Growth Rate (CAGR) of the Track and Trace System Software Industry?
The projected CAGR is approximately 9.31%.
2. Which companies are prominent players in the Track and Trace System Software Industry?
Key companies in the market include Mettler-Toledo International Inc, SEIDENADER MASCHINENBAU GMBH (MEDIPAK SYSTEMS), Axway, Sea Vision SRL, Zetes, Adents, TraceLink Inc, Syntegon Technology GmbH, ACG, Optel Group, ANTARES VISION SpA, Kezzler AS, Rfxcel Corporation, Korber Medipak Systems GmbH*List Not Exhaustive.
3. What are the main segments of the Track and Trace System Software Industry?
The market segments include Product, Technology, Application, End User.
4. Can you provide details about the market size?
The market size is estimated to be USD 3.09 Million as of 2022.
5. What are some drivers contributing to market growth?
Growth in the Medical Devices and Pharmaceutical Industries and Increase in Implementation of Serialization; Rise in the Number of Packaging-related Product Recalls; Increasing Number of Counterfeit Drugs.
6. What are the notable trends driving market growth?
RFID Technology is Expected to Observe a Good Growth in the Track and Trace Solutions Market.
7. Are there any restraints impacting market growth?
High Costs Associated with Serialization and Aggregation; Lack of Common Standards for Serialization and Aggregation.
8. Can you provide examples of recent developments in the market?
In February 2021, Anatres Vision acquired Adents High Tech International. Through this acquisition, the company expanded its portfolio of software solutions capable of tracing and tracking the entire end-to-end supply chain. The acquisition also helped in the strengthening of Anatres Vision's international presence, especially in France.
9. What pricing options are available for accessing the report?
Pricing options include single-user, multi-user, and enterprise licenses priced at USD 4750, USD 5250, and USD 8750 respectively.
10. Is the market size provided in terms of value or volume?
The market size is provided in terms of value, measured in Million.
11. Are there any specific market keywords associated with the report?
Yes, the market keyword associated with the report is "Track and Trace System Software Industry," which aids in identifying and referencing the specific market segment covered.
12. How do I determine which pricing option suits my needs best?
The pricing options vary based on user requirements and access needs. Individual users may opt for single-user licenses, while businesses requiring broader access may choose multi-user or enterprise licenses for cost-effective access to the report.
13. Are there any additional resources or data provided in the Track and Trace System Software Industry report?
While the report offers comprehensive insights, it's advisable to review the specific contents or supplementary materials provided to ascertain if additional resources or data are available.
14. How can I stay updated on further developments or reports in the Track and Trace System Software Industry?
To stay informed about further developments, trends, and reports in the Track and Trace System Software Industry, consider subscribing to industry newsletters, following relevant companies and organizations, or regularly checking reputable industry news sources and publications.
Methodology
Step 1 - Identification of Relevant Samples Size from Population Database


Step 2 - Approaches for Defining Global Market Size (Value, Volume* & Price*)

Note*: In applicable scenarios
Step 3 - Data Sources
Primary Research
- Web Analytics
- Survey Reports
- Research Institute
- Latest Research Reports
- Opinion Leaders
Secondary Research
- Annual Reports
- White Paper
- Latest Press Release
- Industry Association
- Paid Database
- Investor Presentations

Step 4 - Data Triangulation
Involves using different sources of information in order to increase the validity of a study
These sources are likely to be stakeholders in a program - participants, other researchers, program staff, other community members, and so on.
Then we put all data in single framework & apply various statistical tools to find out the dynamic on the market.
During the analysis stage, feedback from the stakeholder groups would be compared to determine areas of agreement as well as areas of divergence