
Key Insights
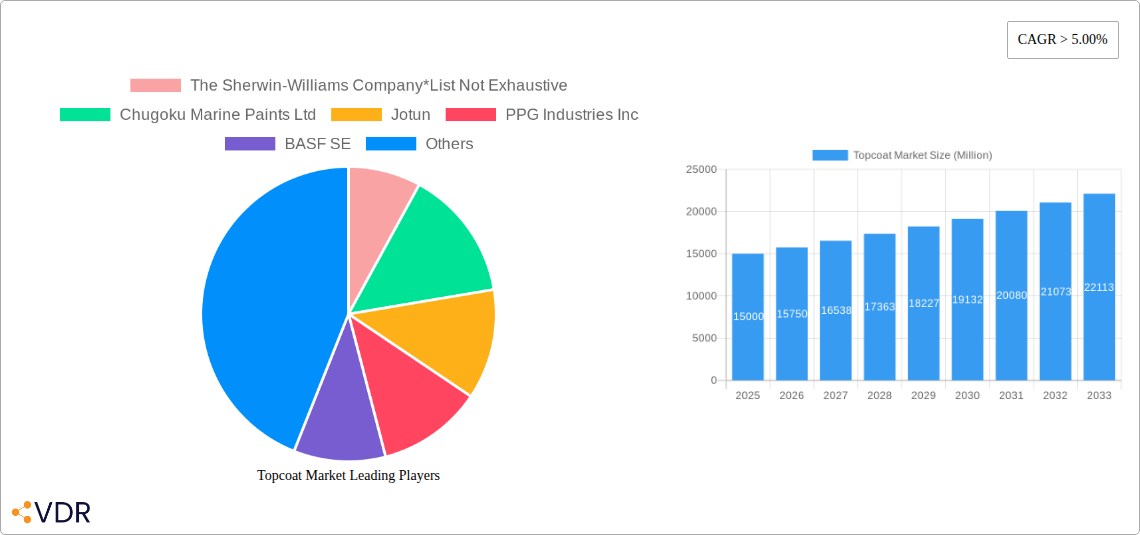
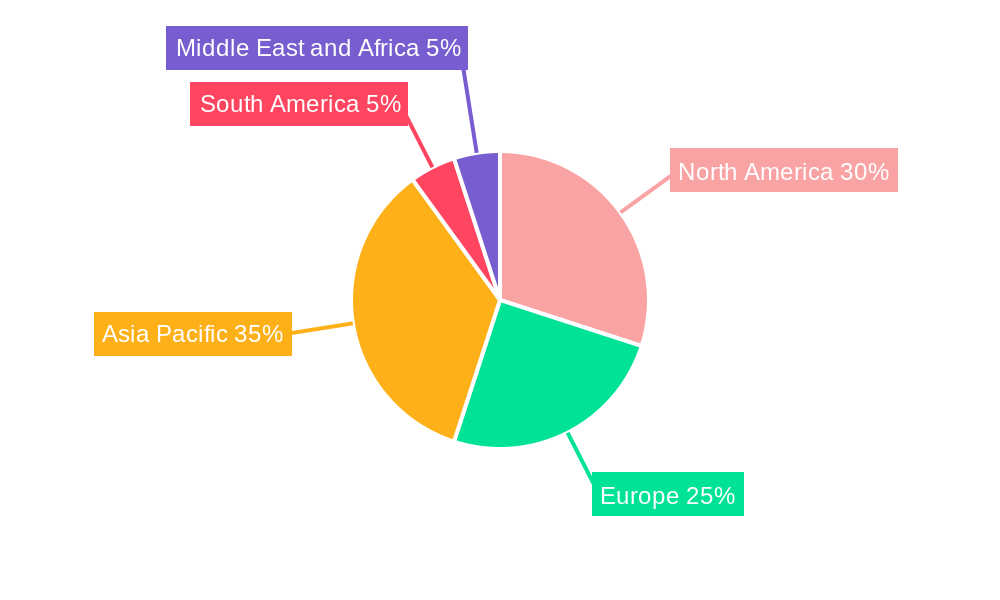
The global topcoat market is experiencing robust growth, projected to maintain a Compound Annual Growth Rate (CAGR) exceeding 5% from 2025 to 2033. This expansion is driven by several key factors. Firstly, the burgeoning automotive and aerospace industries are significantly boosting demand for high-performance, durable topcoats. These industries require coatings with exceptional resistance to weathering, abrasion, and chemicals, fueling innovation and market growth. Secondly, increasing consumer awareness of environmentally friendly coatings is driving demand for water-based and low-VOC (volatile organic compound) alternatives. Manufacturers are responding by developing sustainable topcoat solutions that meet both performance and environmental standards. Finally, the marine industry’s consistent need for corrosion-resistant coatings for ships and offshore structures contributes significantly to the market's overall growth. The market is segmented by resin type (polyurethane, acrylic, epoxy, and others) and end-user industry (automotive, aerospace, marine, and others), with polyurethane currently holding a dominant market share due to its superior performance characteristics. Regional growth varies, with Asia Pacific anticipated to be a significant contributor due to rapid industrialization and infrastructure development in countries like China and India. However, North America and Europe also represent substantial markets, driven by high per capita consumption and strong regulatory frameworks promoting environmentally sustainable coatings.
While the market exhibits considerable potential, certain restraints may influence future growth. Fluctuations in raw material prices, particularly for resins and solvents, can impact profitability and overall market expansion. Additionally, stringent environmental regulations regarding VOC emissions necessitate ongoing technological advancements to meet compliance requirements, potentially increasing production costs. Competitive intensity from established players like Sherwin-Williams, PPG Industries, BASF, Akzo Nobel, and Jotun, alongside emerging regional players, will further shape the market landscape. Nevertheless, the overall outlook for the topcoat market remains positive, driven by consistent demand from diverse end-use sectors and a growing preference for high-performance, eco-friendly coatings. The market’s steady growth trajectory suggests considerable investment opportunities and expansion potential for existing and new players alike.
Topcoat Market Report: 2019-2033 - A Comprehensive Analysis
This comprehensive report provides a detailed analysis of the Topcoat market, encompassing market dynamics, growth trends, regional dominance, product landscape, key players, and future outlook. The study period covers 2019-2033, with 2025 as the base and estimated year, and a forecast period of 2025-2033. The report segments the market by resin type (Polyurethane, Acrylic, Epoxy, Other Resin Types) and end-user industry (Automotive, Aerospace, Marine, Other End-user Industries), offering granular insights into market behavior and potential. The report is crucial for industry professionals, investors, and strategic decision-makers seeking a clear understanding of this evolving market. Market size is presented in Million units.
Topcoat Market Market Dynamics & Structure
This section delves into the intricate structure of the topcoat market, analyzing market concentration, technological innovation, regulatory landscapes, competitive substitutions, end-user demographics, and merger & acquisition (M&A) trends. We explore the competitive intensity, examining market share held by key players like The Sherwin-Williams Company, Chugoku Marine Paints Ltd, Jotun, PPG Industries Inc, BASF SE, Hempel A/S, Akzo Nobel N V, NIPPON PAINT, and Kansai Paint Co Ltd. The report quantifies market concentration using indices like the Herfindahl-Hirschman Index (HHI) and provides insights into the frequency and value of M&A activities within the period 2019-2024. Further, we analyze the impact of technological innovations, such as advancements in UV-curable coatings and water-based topcoats, on market dynamics. Regulatory frameworks concerning VOC emissions and environmental compliance are thoroughly examined, along with the emergence of bio-based and sustainable topcoat alternatives. The analysis also incorporates insights into end-user preferences and the influence of demographic trends on demand.
- Market Concentration: xx% held by top 5 players in 2024.
- M&A Activity (2019-2024): xx deals totaling xx Million units.
- Technological Innovation Drivers: Advancements in UV curing, water-based formulations, and nanotechnology.
- Regulatory Landscape: Stringent environmental regulations driving adoption of eco-friendly coatings.
- Competitive Substitutes: Growing interest in powder coatings and other alternatives.
Topcoat Market Growth Trends & Insights
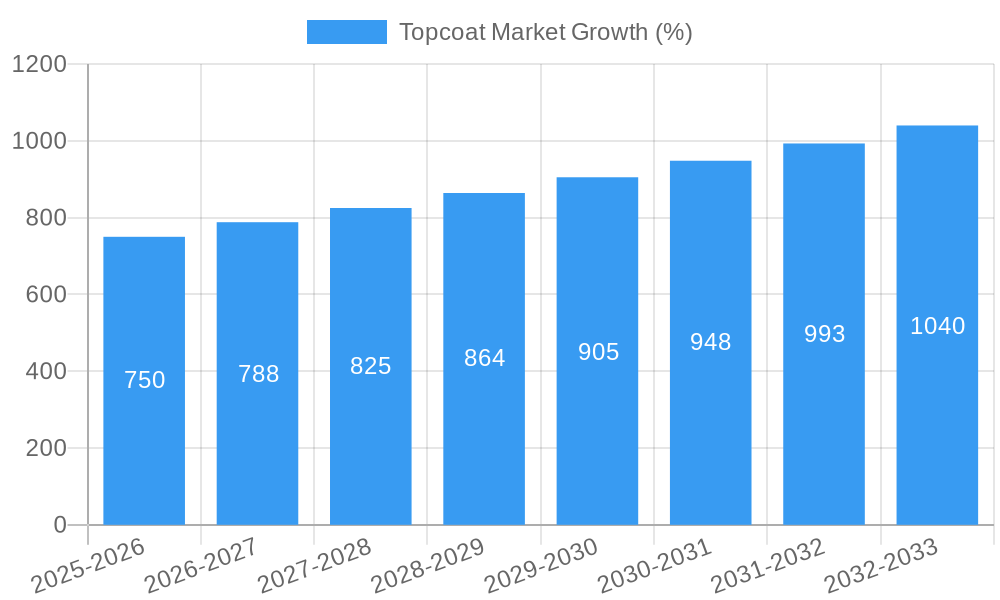
This section provides a comprehensive analysis of the Topcoat market's growth trajectory, leveraging historical data and projected forecasts to illustrate its evolution. We examine factors influencing market size, adoption rates, technological disruptions, and shifts in consumer behavior between 2019 and 2033. The analysis incorporates detailed metrics, including Compound Annual Growth Rate (CAGR), market penetration rates across different segments, and regional variations in growth patterns. We discuss the impact of technological advancements on market expansion, including the adoption of high-performance coatings, improved application techniques, and advancements in formulation chemistry. The analysis also considers consumer demand shifts towards sustainable and environmentally friendly products.
- Historical Market Size (2019-2024): Growth from xx Million units to xx Million units.
- Estimated Market Size (2025): xx Million units
- Forecast Market Size (2033): xx Million units
- CAGR (2025-2033): xx%
- Market Penetration: xx% in key end-user segments by 2033.
Dominant Regions, Countries, or Segments in Topcoat Market
This section pinpoints the leading geographical regions, countries, and market segments within the topcoat industry, focusing on Resin Type (Polyurethane, Acrylic, Epoxy, Other) and End-user Industry (Automotive, Aerospace, Marine, Other). The analysis identifies the dominant players and explores the underlying factors contributing to their leading positions. We examine regional economic conditions, infrastructural development, government policies, and the competitive landscape in each region. The assessment includes market share analysis, growth potential forecasts, and specific drivers influencing each segment’s dominance.
- Dominant Region: Asia-Pacific (driven by automotive and construction sectors).
- Leading Resin Type: Polyurethane (due to its superior performance characteristics).
- Fastest-Growing End-User Segment: Aerospace (fueled by increasing aircraft production).
- Key Drivers: Stringent emission regulations and increasing demand for corrosion-resistant coatings.
Topcoat Market Product Landscape
This section details the product innovations, applications, and performance metrics of various topcoat types. We analyze the unique selling propositions and technological advancements contributing to the competitive edge of specific products. The discussion includes the performance characteristics of different topcoats in various applications and the ongoing trends shaping the product landscape. This includes discussions of UV-cured topcoats, waterborne topcoats, and high-performance coatings with enhanced durability and resistance properties.
Key Drivers, Barriers & Challenges in Topcoat Market
This section identifies the key factors driving market growth, encompassing technological advancements, economic conditions, and supportive government policies. Examples include the rising demand for durable and aesthetically pleasing coatings across various industries and the increasing adoption of advanced application techniques.
- Key Drivers: Growing construction and automotive sectors; advancements in coating technology; increasing demand for high-performance coatings.
Conversely, the section also addresses the challenges hindering market expansion, such as supply chain disruptions, regulatory hurdles, and intense competition. This includes quantifiable impacts of these challenges on market growth.
- Key Challenges: Fluctuations in raw material prices; environmental regulations; intense competition among manufacturers.
Emerging Opportunities in Topcoat Market
This section highlights emerging trends and promising opportunities within the topcoat market. This encompasses the exploration of untapped markets, innovative applications (such as self-healing coatings), and evolving consumer preferences towards sustainable and eco-friendly solutions.
Growth Accelerators in the Topcoat Market Industry
Technological breakthroughs, strategic partnerships, and market expansion strategies are key catalysts driving long-term growth. Advancements in coating technology, like the development of bio-based and water-based coatings, are significantly influencing the market. Strategic collaborations between manufacturers and end-users are crucial for innovation and market penetration. Market expansion into new geographical regions and diversification into new applications also fuel market growth.
Key Players Shaping the Topcoat Market Market
- The Sherwin-Williams Company
- Chugoku Marine Paints Ltd
- Jotun
- PPG Industries Inc
- BASF SE
- Hempel A/S
- Akzo Nobel N V
- NIPPON PAINT
- Kansai Paint Co Ltd
Notable Milestones in Topcoat Market Sector
- 2021: Launch of a new generation of UV-curable topcoat by PPG Industries Inc.
- 2022: Acquisition of a smaller coatings company by Akzo Nobel N V.
- 2023: Introduction of a sustainable, bio-based topcoat by BASF SE.
- (Further milestones to be added based on available data)
In-Depth Topcoat Market Market Outlook
The topcoat market shows strong potential for growth, driven by continuous technological innovation, expansion into new applications, and increasing demand from key end-user industries. Strategic collaborations and sustainable product development will be critical for success in the coming years. The focus on eco-friendly solutions and high-performance coatings is expected to shape the market's trajectory, offering significant opportunities for established players and new entrants alike.
Topcoat Market Segmentation
-
1. Resin Type
- 1.1. Polyurethane
- 1.2. Acrylic
- 1.3. Epoxy
- 1.4. Other Resin Types
-
2. End-user Industry
- 2.1. Automotive
- 2.2. Aerospace
- 2.3. Marine
- 2.4. Other End-user Industries
Topcoat Market Segmentation By Geography
-
1. Asia Pacific
- 1.1. China
- 1.2. India
- 1.3. Japan
- 1.4. South Korea
- 1.5. Rest of Asia Pacific
-
2. North America
- 2.1. United States
- 2.2. Canada
- 2.3. Mexico
-
3. Europe
- 3.1. United Kingdom
- 3.2. France
- 3.3. Germany
- 3.4. Italy
- 3.5. Rest of Europe
-
4. South America
- 4.1. Brazil
- 4.2. Argentina
- 4.3. Rest of South America
-
5. Middle East and Africa
- 5.1. South Africa
- 5.2. Saudi Arabia
- 5.3. Rest of Middle East and Africa
Topcoat Market REPORT HIGHLIGHTS
| Aspects | Details |
|---|---|
| Study Period | 2019-2033 |
| Base Year | 2024 |
| Estimated Year | 2025 |
| Forecast Period | 2025-2033 |
| Historical Period | 2019-2024 |
| Growth Rate | CAGR of > 5.00% from 2019-2033 |
| Segmentation |
|
Table of Contents
- 1. Introduction
- 1.1. Research Scope
- 1.2. Market Segmentation
- 1.3. Research Methodology
- 1.4. Definitions and Assumptions
- 2. Executive Summary
- 2.1. Introduction
- 3. Market Dynamics
- 3.1. Introduction
- 3.2. Market Drivers
- 3.2.1. ; Increasing Demand From Aerospace Industry; Other Driver
- 3.3. Market Restrains
- 3.3.1. ; Decline in Automotive Industry; Impact of COVID-19 Pandemic
- 3.4. Market Trends
- 3.4.1. Automotive Industry Dominated the Market
- 4. Market Factor Analysis
- 4.1. Porters Five Forces
- 4.2. Supply/Value Chain
- 4.3. PESTEL analysis
- 4.4. Market Entropy
- 4.5. Patent/Trademark Analysis
- 5. Global Topcoat Market Analysis, Insights and Forecast, 2019-2031
- 5.1. Market Analysis, Insights and Forecast - by Resin Type
- 5.1.1. Polyurethane
- 5.1.2. Acrylic
- 5.1.3. Epoxy
- 5.1.4. Other Resin Types
- 5.2. Market Analysis, Insights and Forecast - by End-user Industry
- 5.2.1. Automotive
- 5.2.2. Aerospace
- 5.2.3. Marine
- 5.2.4. Other End-user Industries
- 5.3. Market Analysis, Insights and Forecast - by Region
- 5.3.1. Asia Pacific
- 5.3.2. North America
- 5.3.3. Europe
- 5.3.4. South America
- 5.3.5. Middle East and Africa
- 5.1. Market Analysis, Insights and Forecast - by Resin Type
- 6. Asia Pacific Topcoat Market Analysis, Insights and Forecast, 2019-2031
- 6.1. Market Analysis, Insights and Forecast - by Resin Type
- 6.1.1. Polyurethane
- 6.1.2. Acrylic
- 6.1.3. Epoxy
- 6.1.4. Other Resin Types
- 6.2. Market Analysis, Insights and Forecast - by End-user Industry
- 6.2.1. Automotive
- 6.2.2. Aerospace
- 6.2.3. Marine
- 6.2.4. Other End-user Industries
- 6.1. Market Analysis, Insights and Forecast - by Resin Type
- 7. North America Topcoat Market Analysis, Insights and Forecast, 2019-2031
- 7.1. Market Analysis, Insights and Forecast - by Resin Type
- 7.1.1. Polyurethane
- 7.1.2. Acrylic
- 7.1.3. Epoxy
- 7.1.4. Other Resin Types
- 7.2. Market Analysis, Insights and Forecast - by End-user Industry
- 7.2.1. Automotive
- 7.2.2. Aerospace
- 7.2.3. Marine
- 7.2.4. Other End-user Industries
- 7.1. Market Analysis, Insights and Forecast - by Resin Type
- 8. Europe Topcoat Market Analysis, Insights and Forecast, 2019-2031
- 8.1. Market Analysis, Insights and Forecast - by Resin Type
- 8.1.1. Polyurethane
- 8.1.2. Acrylic
- 8.1.3. Epoxy
- 8.1.4. Other Resin Types
- 8.2. Market Analysis, Insights and Forecast - by End-user Industry
- 8.2.1. Automotive
- 8.2.2. Aerospace
- 8.2.3. Marine
- 8.2.4. Other End-user Industries
- 8.1. Market Analysis, Insights and Forecast - by Resin Type
- 9. South America Topcoat Market Analysis, Insights and Forecast, 2019-2031
- 9.1. Market Analysis, Insights and Forecast - by Resin Type
- 9.1.1. Polyurethane
- 9.1.2. Acrylic
- 9.1.3. Epoxy
- 9.1.4. Other Resin Types
- 9.2. Market Analysis, Insights and Forecast - by End-user Industry
- 9.2.1. Automotive
- 9.2.2. Aerospace
- 9.2.3. Marine
- 9.2.4. Other End-user Industries
- 9.1. Market Analysis, Insights and Forecast - by Resin Type
- 10. Middle East and Africa Topcoat Market Analysis, Insights and Forecast, 2019-2031
- 10.1. Market Analysis, Insights and Forecast - by Resin Type
- 10.1.1. Polyurethane
- 10.1.2. Acrylic
- 10.1.3. Epoxy
- 10.1.4. Other Resin Types
- 10.2. Market Analysis, Insights and Forecast - by End-user Industry
- 10.2.1. Automotive
- 10.2.2. Aerospace
- 10.2.3. Marine
- 10.2.4. Other End-user Industries
- 10.1. Market Analysis, Insights and Forecast - by Resin Type
- 11. Asia Pacific Topcoat Market Analysis, Insights and Forecast, 2019-2031
- 11.1. Market Analysis, Insights and Forecast - By Country/Sub-region
- 11.1.1 China
- 11.1.2 India
- 11.1.3 Japan
- 11.1.4 South Korea
- 11.1.5 Rest of Asia Pacific
- 12. North America Topcoat Market Analysis, Insights and Forecast, 2019-2031
- 12.1. Market Analysis, Insights and Forecast - By Country/Sub-region
- 12.1.1 United States
- 12.1.2 Canada
- 12.1.3 Mexico
- 13. Europe Topcoat Market Analysis, Insights and Forecast, 2019-2031
- 13.1. Market Analysis, Insights and Forecast - By Country/Sub-region
- 13.1.1 United Kingdom
- 13.1.2 France
- 13.1.3 Germany
- 13.1.4 Italy
- 13.1.5 Rest of Europe
- 14. South America Topcoat Market Analysis, Insights and Forecast, 2019-2031
- 14.1. Market Analysis, Insights and Forecast - By Country/Sub-region
- 14.1.1 Brazil
- 14.1.2 Argentina
- 14.1.3 Rest of South America
- 15. Middle East and Africa Topcoat Market Analysis, Insights and Forecast, 2019-2031
- 15.1. Market Analysis, Insights and Forecast - By Country/Sub-region
- 15.1.1 South Africa
- 15.1.2 Saudi Arabia
- 15.1.3 Rest of Middle East and Africa
- 16. Competitive Analysis
- 16.1. Global Market Share Analysis 2024
- 16.2. Company Profiles
- 16.2.1 The Sherwin-Williams Company*List Not Exhaustive
- 16.2.1.1. Overview
- 16.2.1.2. Products
- 16.2.1.3. SWOT Analysis
- 16.2.1.4. Recent Developments
- 16.2.1.5. Financials (Based on Availability)
- 16.2.2 Chugoku Marine Paints Ltd
- 16.2.2.1. Overview
- 16.2.2.2. Products
- 16.2.2.3. SWOT Analysis
- 16.2.2.4. Recent Developments
- 16.2.2.5. Financials (Based on Availability)
- 16.2.3 Jotun
- 16.2.3.1. Overview
- 16.2.3.2. Products
- 16.2.3.3. SWOT Analysis
- 16.2.3.4. Recent Developments
- 16.2.3.5. Financials (Based on Availability)
- 16.2.4 PPG Industries Inc
- 16.2.4.1. Overview
- 16.2.4.2. Products
- 16.2.4.3. SWOT Analysis
- 16.2.4.4. Recent Developments
- 16.2.4.5. Financials (Based on Availability)
- 16.2.5 BASF SE
- 16.2.5.1. Overview
- 16.2.5.2. Products
- 16.2.5.3. SWOT Analysis
- 16.2.5.4. Recent Developments
- 16.2.5.5. Financials (Based on Availability)
- 16.2.6 Hempel A/S
- 16.2.6.1. Overview
- 16.2.6.2. Products
- 16.2.6.3. SWOT Analysis
- 16.2.6.4. Recent Developments
- 16.2.6.5. Financials (Based on Availability)
- 16.2.7 Akzo Nobel N V
- 16.2.7.1. Overview
- 16.2.7.2. Products
- 16.2.7.3. SWOT Analysis
- 16.2.7.4. Recent Developments
- 16.2.7.5. Financials (Based on Availability)
- 16.2.8 NIPPON PAINT
- 16.2.8.1. Overview
- 16.2.8.2. Products
- 16.2.8.3. SWOT Analysis
- 16.2.8.4. Recent Developments
- 16.2.8.5. Financials (Based on Availability)
- 16.2.9 Kansai Paint Co Ltd
- 16.2.9.1. Overview
- 16.2.9.2. Products
- 16.2.9.3. SWOT Analysis
- 16.2.9.4. Recent Developments
- 16.2.9.5. Financials (Based on Availability)
- 16.2.1 The Sherwin-Williams Company*List Not Exhaustive
List of Figures
- Figure 1: Global Topcoat Market Revenue Breakdown (Million, %) by Region 2024 & 2032
- Figure 2: Global Topcoat Market Volume Breakdown (liter per unit, %) by Region 2024 & 2032
- Figure 3: Asia Pacific Topcoat Market Revenue (Million), by Country 2024 & 2032
- Figure 4: Asia Pacific Topcoat Market Volume (liter per unit), by Country 2024 & 2032
- Figure 5: Asia Pacific Topcoat Market Revenue Share (%), by Country 2024 & 2032
- Figure 6: Asia Pacific Topcoat Market Volume Share (%), by Country 2024 & 2032
- Figure 7: North America Topcoat Market Revenue (Million), by Country 2024 & 2032
- Figure 8: North America Topcoat Market Volume (liter per unit), by Country 2024 & 2032
- Figure 9: North America Topcoat Market Revenue Share (%), by Country 2024 & 2032
- Figure 10: North America Topcoat Market Volume Share (%), by Country 2024 & 2032
- Figure 11: Europe Topcoat Market Revenue (Million), by Country 2024 & 2032
- Figure 12: Europe Topcoat Market Volume (liter per unit), by Country 2024 & 2032
- Figure 13: Europe Topcoat Market Revenue Share (%), by Country 2024 & 2032
- Figure 14: Europe Topcoat Market Volume Share (%), by Country 2024 & 2032
- Figure 15: South America Topcoat Market Revenue (Million), by Country 2024 & 2032
- Figure 16: South America Topcoat Market Volume (liter per unit), by Country 2024 & 2032
- Figure 17: South America Topcoat Market Revenue Share (%), by Country 2024 & 2032
- Figure 18: South America Topcoat Market Volume Share (%), by Country 2024 & 2032
- Figure 19: Middle East and Africa Topcoat Market Revenue (Million), by Country 2024 & 2032
- Figure 20: Middle East and Africa Topcoat Market Volume (liter per unit), by Country 2024 & 2032
- Figure 21: Middle East and Africa Topcoat Market Revenue Share (%), by Country 2024 & 2032
- Figure 22: Middle East and Africa Topcoat Market Volume Share (%), by Country 2024 & 2032
- Figure 23: Asia Pacific Topcoat Market Revenue (Million), by Resin Type 2024 & 2032
- Figure 24: Asia Pacific Topcoat Market Volume (liter per unit), by Resin Type 2024 & 2032
- Figure 25: Asia Pacific Topcoat Market Revenue Share (%), by Resin Type 2024 & 2032
- Figure 26: Asia Pacific Topcoat Market Volume Share (%), by Resin Type 2024 & 2032
- Figure 27: Asia Pacific Topcoat Market Revenue (Million), by End-user Industry 2024 & 2032
- Figure 28: Asia Pacific Topcoat Market Volume (liter per unit), by End-user Industry 2024 & 2032
- Figure 29: Asia Pacific Topcoat Market Revenue Share (%), by End-user Industry 2024 & 2032
- Figure 30: Asia Pacific Topcoat Market Volume Share (%), by End-user Industry 2024 & 2032
- Figure 31: Asia Pacific Topcoat Market Revenue (Million), by Country 2024 & 2032
- Figure 32: Asia Pacific Topcoat Market Volume (liter per unit), by Country 2024 & 2032
- Figure 33: Asia Pacific Topcoat Market Revenue Share (%), by Country 2024 & 2032
- Figure 34: Asia Pacific Topcoat Market Volume Share (%), by Country 2024 & 2032
- Figure 35: North America Topcoat Market Revenue (Million), by Resin Type 2024 & 2032
- Figure 36: North America Topcoat Market Volume (liter per unit), by Resin Type 2024 & 2032
- Figure 37: North America Topcoat Market Revenue Share (%), by Resin Type 2024 & 2032
- Figure 38: North America Topcoat Market Volume Share (%), by Resin Type 2024 & 2032
- Figure 39: North America Topcoat Market Revenue (Million), by End-user Industry 2024 & 2032
- Figure 40: North America Topcoat Market Volume (liter per unit), by End-user Industry 2024 & 2032
- Figure 41: North America Topcoat Market Revenue Share (%), by End-user Industry 2024 & 2032
- Figure 42: North America Topcoat Market Volume Share (%), by End-user Industry 2024 & 2032
- Figure 43: North America Topcoat Market Revenue (Million), by Country 2024 & 2032
- Figure 44: North America Topcoat Market Volume (liter per unit), by Country 2024 & 2032
- Figure 45: North America Topcoat Market Revenue Share (%), by Country 2024 & 2032
- Figure 46: North America Topcoat Market Volume Share (%), by Country 2024 & 2032
- Figure 47: Europe Topcoat Market Revenue (Million), by Resin Type 2024 & 2032
- Figure 48: Europe Topcoat Market Volume (liter per unit), by Resin Type 2024 & 2032
- Figure 49: Europe Topcoat Market Revenue Share (%), by Resin Type 2024 & 2032
- Figure 50: Europe Topcoat Market Volume Share (%), by Resin Type 2024 & 2032
- Figure 51: Europe Topcoat Market Revenue (Million), by End-user Industry 2024 & 2032
- Figure 52: Europe Topcoat Market Volume (liter per unit), by End-user Industry 2024 & 2032
- Figure 53: Europe Topcoat Market Revenue Share (%), by End-user Industry 2024 & 2032
- Figure 54: Europe Topcoat Market Volume Share (%), by End-user Industry 2024 & 2032
- Figure 55: Europe Topcoat Market Revenue (Million), by Country 2024 & 2032
- Figure 56: Europe Topcoat Market Volume (liter per unit), by Country 2024 & 2032
- Figure 57: Europe Topcoat Market Revenue Share (%), by Country 2024 & 2032
- Figure 58: Europe Topcoat Market Volume Share (%), by Country 2024 & 2032
- Figure 59: South America Topcoat Market Revenue (Million), by Resin Type 2024 & 2032
- Figure 60: South America Topcoat Market Volume (liter per unit), by Resin Type 2024 & 2032
- Figure 61: South America Topcoat Market Revenue Share (%), by Resin Type 2024 & 2032
- Figure 62: South America Topcoat Market Volume Share (%), by Resin Type 2024 & 2032
- Figure 63: South America Topcoat Market Revenue (Million), by End-user Industry 2024 & 2032
- Figure 64: South America Topcoat Market Volume (liter per unit), by End-user Industry 2024 & 2032
- Figure 65: South America Topcoat Market Revenue Share (%), by End-user Industry 2024 & 2032
- Figure 66: South America Topcoat Market Volume Share (%), by End-user Industry 2024 & 2032
- Figure 67: South America Topcoat Market Revenue (Million), by Country 2024 & 2032
- Figure 68: South America Topcoat Market Volume (liter per unit), by Country 2024 & 2032
- Figure 69: South America Topcoat Market Revenue Share (%), by Country 2024 & 2032
- Figure 70: South America Topcoat Market Volume Share (%), by Country 2024 & 2032
- Figure 71: Middle East and Africa Topcoat Market Revenue (Million), by Resin Type 2024 & 2032
- Figure 72: Middle East and Africa Topcoat Market Volume (liter per unit), by Resin Type 2024 & 2032
- Figure 73: Middle East and Africa Topcoat Market Revenue Share (%), by Resin Type 2024 & 2032
- Figure 74: Middle East and Africa Topcoat Market Volume Share (%), by Resin Type 2024 & 2032
- Figure 75: Middle East and Africa Topcoat Market Revenue (Million), by End-user Industry 2024 & 2032
- Figure 76: Middle East and Africa Topcoat Market Volume (liter per unit), by End-user Industry 2024 & 2032
- Figure 77: Middle East and Africa Topcoat Market Revenue Share (%), by End-user Industry 2024 & 2032
- Figure 78: Middle East and Africa Topcoat Market Volume Share (%), by End-user Industry 2024 & 2032
- Figure 79: Middle East and Africa Topcoat Market Revenue (Million), by Country 2024 & 2032
- Figure 80: Middle East and Africa Topcoat Market Volume (liter per unit), by Country 2024 & 2032
- Figure 81: Middle East and Africa Topcoat Market Revenue Share (%), by Country 2024 & 2032
- Figure 82: Middle East and Africa Topcoat Market Volume Share (%), by Country 2024 & 2032
List of Tables
- Table 1: Global Topcoat Market Revenue Million Forecast, by Region 2019 & 2032
- Table 2: Global Topcoat Market Volume liter per unit Forecast, by Region 2019 & 2032
- Table 3: Global Topcoat Market Revenue Million Forecast, by Resin Type 2019 & 2032
- Table 4: Global Topcoat Market Volume liter per unit Forecast, by Resin Type 2019 & 2032
- Table 5: Global Topcoat Market Revenue Million Forecast, by End-user Industry 2019 & 2032
- Table 6: Global Topcoat Market Volume liter per unit Forecast, by End-user Industry 2019 & 2032
- Table 7: Global Topcoat Market Revenue Million Forecast, by Region 2019 & 2032
- Table 8: Global Topcoat Market Volume liter per unit Forecast, by Region 2019 & 2032
- Table 9: Global Topcoat Market Revenue Million Forecast, by Country 2019 & 2032
- Table 10: Global Topcoat Market Volume liter per unit Forecast, by Country 2019 & 2032
- Table 11: China Topcoat Market Revenue (Million) Forecast, by Application 2019 & 2032
- Table 12: China Topcoat Market Volume (liter per unit) Forecast, by Application 2019 & 2032
- Table 13: India Topcoat Market Revenue (Million) Forecast, by Application 2019 & 2032
- Table 14: India Topcoat Market Volume (liter per unit) Forecast, by Application 2019 & 2032
- Table 15: Japan Topcoat Market Revenue (Million) Forecast, by Application 2019 & 2032
- Table 16: Japan Topcoat Market Volume (liter per unit) Forecast, by Application 2019 & 2032
- Table 17: South Korea Topcoat Market Revenue (Million) Forecast, by Application 2019 & 2032
- Table 18: South Korea Topcoat Market Volume (liter per unit) Forecast, by Application 2019 & 2032
- Table 19: Rest of Asia Pacific Topcoat Market Revenue (Million) Forecast, by Application 2019 & 2032
- Table 20: Rest of Asia Pacific Topcoat Market Volume (liter per unit) Forecast, by Application 2019 & 2032
- Table 21: Global Topcoat Market Revenue Million Forecast, by Country 2019 & 2032
- Table 22: Global Topcoat Market Volume liter per unit Forecast, by Country 2019 & 2032
- Table 23: United States Topcoat Market Revenue (Million) Forecast, by Application 2019 & 2032
- Table 24: United States Topcoat Market Volume (liter per unit) Forecast, by Application 2019 & 2032
- Table 25: Canada Topcoat Market Revenue (Million) Forecast, by Application 2019 & 2032
- Table 26: Canada Topcoat Market Volume (liter per unit) Forecast, by Application 2019 & 2032
- Table 27: Mexico Topcoat Market Revenue (Million) Forecast, by Application 2019 & 2032
- Table 28: Mexico Topcoat Market Volume (liter per unit) Forecast, by Application 2019 & 2032
- Table 29: Global Topcoat Market Revenue Million Forecast, by Country 2019 & 2032
- Table 30: Global Topcoat Market Volume liter per unit Forecast, by Country 2019 & 2032
- Table 31: United Kingdom Topcoat Market Revenue (Million) Forecast, by Application 2019 & 2032
- Table 32: United Kingdom Topcoat Market Volume (liter per unit) Forecast, by Application 2019 & 2032
- Table 33: France Topcoat Market Revenue (Million) Forecast, by Application 2019 & 2032
- Table 34: France Topcoat Market Volume (liter per unit) Forecast, by Application 2019 & 2032
- Table 35: Germany Topcoat Market Revenue (Million) Forecast, by Application 2019 & 2032
- Table 36: Germany Topcoat Market Volume (liter per unit) Forecast, by Application 2019 & 2032
- Table 37: Italy Topcoat Market Revenue (Million) Forecast, by Application 2019 & 2032
- Table 38: Italy Topcoat Market Volume (liter per unit) Forecast, by Application 2019 & 2032
- Table 39: Rest of Europe Topcoat Market Revenue (Million) Forecast, by Application 2019 & 2032
- Table 40: Rest of Europe Topcoat Market Volume (liter per unit) Forecast, by Application 2019 & 2032
- Table 41: Global Topcoat Market Revenue Million Forecast, by Country 2019 & 2032
- Table 42: Global Topcoat Market Volume liter per unit Forecast, by Country 2019 & 2032
- Table 43: Brazil Topcoat Market Revenue (Million) Forecast, by Application 2019 & 2032
- Table 44: Brazil Topcoat Market Volume (liter per unit) Forecast, by Application 2019 & 2032
- Table 45: Argentina Topcoat Market Revenue (Million) Forecast, by Application 2019 & 2032
- Table 46: Argentina Topcoat Market Volume (liter per unit) Forecast, by Application 2019 & 2032
- Table 47: Rest of South America Topcoat Market Revenue (Million) Forecast, by Application 2019 & 2032
- Table 48: Rest of South America Topcoat Market Volume (liter per unit) Forecast, by Application 2019 & 2032
- Table 49: Global Topcoat Market Revenue Million Forecast, by Country 2019 & 2032
- Table 50: Global Topcoat Market Volume liter per unit Forecast, by Country 2019 & 2032
- Table 51: South Africa Topcoat Market Revenue (Million) Forecast, by Application 2019 & 2032
- Table 52: South Africa Topcoat Market Volume (liter per unit) Forecast, by Application 2019 & 2032
- Table 53: Saudi Arabia Topcoat Market Revenue (Million) Forecast, by Application 2019 & 2032
- Table 54: Saudi Arabia Topcoat Market Volume (liter per unit) Forecast, by Application 2019 & 2032
- Table 55: Rest of Middle East and Africa Topcoat Market Revenue (Million) Forecast, by Application 2019 & 2032
- Table 56: Rest of Middle East and Africa Topcoat Market Volume (liter per unit) Forecast, by Application 2019 & 2032
- Table 57: Global Topcoat Market Revenue Million Forecast, by Resin Type 2019 & 2032
- Table 58: Global Topcoat Market Volume liter per unit Forecast, by Resin Type 2019 & 2032
- Table 59: Global Topcoat Market Revenue Million Forecast, by End-user Industry 2019 & 2032
- Table 60: Global Topcoat Market Volume liter per unit Forecast, by End-user Industry 2019 & 2032
- Table 61: Global Topcoat Market Revenue Million Forecast, by Country 2019 & 2032
- Table 62: Global Topcoat Market Volume liter per unit Forecast, by Country 2019 & 2032
- Table 63: China Topcoat Market Revenue (Million) Forecast, by Application 2019 & 2032
- Table 64: China Topcoat Market Volume (liter per unit) Forecast, by Application 2019 & 2032
- Table 65: India Topcoat Market Revenue (Million) Forecast, by Application 2019 & 2032
- Table 66: India Topcoat Market Volume (liter per unit) Forecast, by Application 2019 & 2032
- Table 67: Japan Topcoat Market Revenue (Million) Forecast, by Application 2019 & 2032
- Table 68: Japan Topcoat Market Volume (liter per unit) Forecast, by Application 2019 & 2032
- Table 69: South Korea Topcoat Market Revenue (Million) Forecast, by Application 2019 & 2032
- Table 70: South Korea Topcoat Market Volume (liter per unit) Forecast, by Application 2019 & 2032
- Table 71: Rest of Asia Pacific Topcoat Market Revenue (Million) Forecast, by Application 2019 & 2032
- Table 72: Rest of Asia Pacific Topcoat Market Volume (liter per unit) Forecast, by Application 2019 & 2032
- Table 73: Global Topcoat Market Revenue Million Forecast, by Resin Type 2019 & 2032
- Table 74: Global Topcoat Market Volume liter per unit Forecast, by Resin Type 2019 & 2032
- Table 75: Global Topcoat Market Revenue Million Forecast, by End-user Industry 2019 & 2032
- Table 76: Global Topcoat Market Volume liter per unit Forecast, by End-user Industry 2019 & 2032
- Table 77: Global Topcoat Market Revenue Million Forecast, by Country 2019 & 2032
- Table 78: Global Topcoat Market Volume liter per unit Forecast, by Country 2019 & 2032
- Table 79: United States Topcoat Market Revenue (Million) Forecast, by Application 2019 & 2032
- Table 80: United States Topcoat Market Volume (liter per unit) Forecast, by Application 2019 & 2032
- Table 81: Canada Topcoat Market Revenue (Million) Forecast, by Application 2019 & 2032
- Table 82: Canada Topcoat Market Volume (liter per unit) Forecast, by Application 2019 & 2032
- Table 83: Mexico Topcoat Market Revenue (Million) Forecast, by Application 2019 & 2032
- Table 84: Mexico Topcoat Market Volume (liter per unit) Forecast, by Application 2019 & 2032
- Table 85: Global Topcoat Market Revenue Million Forecast, by Resin Type 2019 & 2032
- Table 86: Global Topcoat Market Volume liter per unit Forecast, by Resin Type 2019 & 2032
- Table 87: Global Topcoat Market Revenue Million Forecast, by End-user Industry 2019 & 2032
- Table 88: Global Topcoat Market Volume liter per unit Forecast, by End-user Industry 2019 & 2032
- Table 89: Global Topcoat Market Revenue Million Forecast, by Country 2019 & 2032
- Table 90: Global Topcoat Market Volume liter per unit Forecast, by Country 2019 & 2032
- Table 91: United Kingdom Topcoat Market Revenue (Million) Forecast, by Application 2019 & 2032
- Table 92: United Kingdom Topcoat Market Volume (liter per unit) Forecast, by Application 2019 & 2032
- Table 93: France Topcoat Market Revenue (Million) Forecast, by Application 2019 & 2032
- Table 94: France Topcoat Market Volume (liter per unit) Forecast, by Application 2019 & 2032
- Table 95: Germany Topcoat Market Revenue (Million) Forecast, by Application 2019 & 2032
- Table 96: Germany Topcoat Market Volume (liter per unit) Forecast, by Application 2019 & 2032
- Table 97: Italy Topcoat Market Revenue (Million) Forecast, by Application 2019 & 2032
- Table 98: Italy Topcoat Market Volume (liter per unit) Forecast, by Application 2019 & 2032
- Table 99: Rest of Europe Topcoat Market Revenue (Million) Forecast, by Application 2019 & 2032
- Table 100: Rest of Europe Topcoat Market Volume (liter per unit) Forecast, by Application 2019 & 2032
- Table 101: Global Topcoat Market Revenue Million Forecast, by Resin Type 2019 & 2032
- Table 102: Global Topcoat Market Volume liter per unit Forecast, by Resin Type 2019 & 2032
- Table 103: Global Topcoat Market Revenue Million Forecast, by End-user Industry 2019 & 2032
- Table 104: Global Topcoat Market Volume liter per unit Forecast, by End-user Industry 2019 & 2032
- Table 105: Global Topcoat Market Revenue Million Forecast, by Country 2019 & 2032
- Table 106: Global Topcoat Market Volume liter per unit Forecast, by Country 2019 & 2032
- Table 107: Brazil Topcoat Market Revenue (Million) Forecast, by Application 2019 & 2032
- Table 108: Brazil Topcoat Market Volume (liter per unit) Forecast, by Application 2019 & 2032
- Table 109: Argentina Topcoat Market Revenue (Million) Forecast, by Application 2019 & 2032
- Table 110: Argentina Topcoat Market Volume (liter per unit) Forecast, by Application 2019 & 2032
- Table 111: Rest of South America Topcoat Market Revenue (Million) Forecast, by Application 2019 & 2032
- Table 112: Rest of South America Topcoat Market Volume (liter per unit) Forecast, by Application 2019 & 2032
- Table 113: Global Topcoat Market Revenue Million Forecast, by Resin Type 2019 & 2032
- Table 114: Global Topcoat Market Volume liter per unit Forecast, by Resin Type 2019 & 2032
- Table 115: Global Topcoat Market Revenue Million Forecast, by End-user Industry 2019 & 2032
- Table 116: Global Topcoat Market Volume liter per unit Forecast, by End-user Industry 2019 & 2032
- Table 117: Global Topcoat Market Revenue Million Forecast, by Country 2019 & 2032
- Table 118: Global Topcoat Market Volume liter per unit Forecast, by Country 2019 & 2032
- Table 119: South Africa Topcoat Market Revenue (Million) Forecast, by Application 2019 & 2032
- Table 120: South Africa Topcoat Market Volume (liter per unit) Forecast, by Application 2019 & 2032
- Table 121: Saudi Arabia Topcoat Market Revenue (Million) Forecast, by Application 2019 & 2032
- Table 122: Saudi Arabia Topcoat Market Volume (liter per unit) Forecast, by Application 2019 & 2032
- Table 123: Rest of Middle East and Africa Topcoat Market Revenue (Million) Forecast, by Application 2019 & 2032
- Table 124: Rest of Middle East and Africa Topcoat Market Volume (liter per unit) Forecast, by Application 2019 & 2032
Frequently Asked Questions
1. What is the projected Compound Annual Growth Rate (CAGR) of the Topcoat Market?
The projected CAGR is approximately > 5.00%.
2. Which companies are prominent players in the Topcoat Market?
Key companies in the market include The Sherwin-Williams Company*List Not Exhaustive, Chugoku Marine Paints Ltd, Jotun, PPG Industries Inc, BASF SE, Hempel A/S, Akzo Nobel N V, NIPPON PAINT, Kansai Paint Co Ltd.
3. What are the main segments of the Topcoat Market?
The market segments include Resin Type, End-user Industry.
4. Can you provide details about the market size?
The market size is estimated to be USD XX Million as of 2022.
5. What are some drivers contributing to market growth?
; Increasing Demand From Aerospace Industry; Other Driver.
6. What are the notable trends driving market growth?
Automotive Industry Dominated the Market.
7. Are there any restraints impacting market growth?
; Decline in Automotive Industry; Impact of COVID-19 Pandemic.
8. Can you provide examples of recent developments in the market?
N/A
9. What pricing options are available for accessing the report?
Pricing options include single-user, multi-user, and enterprise licenses priced at USD 4750, USD 5250, and USD 8750 respectively.
10. Is the market size provided in terms of value or volume?
The market size is provided in terms of value, measured in Million and volume, measured in liter per unit.
11. Are there any specific market keywords associated with the report?
Yes, the market keyword associated with the report is "Topcoat Market," which aids in identifying and referencing the specific market segment covered.
12. How do I determine which pricing option suits my needs best?
The pricing options vary based on user requirements and access needs. Individual users may opt for single-user licenses, while businesses requiring broader access may choose multi-user or enterprise licenses for cost-effective access to the report.
13. Are there any additional resources or data provided in the Topcoat Market report?
While the report offers comprehensive insights, it's advisable to review the specific contents or supplementary materials provided to ascertain if additional resources or data are available.
14. How can I stay updated on further developments or reports in the Topcoat Market?
To stay informed about further developments, trends, and reports in the Topcoat Market, consider subscribing to industry newsletters, following relevant companies and organizations, or regularly checking reputable industry news sources and publications.
Methodology
Step 1 - Identification of Relevant Samples Size from Population Database


Step 2 - Approaches for Defining Global Market Size (Value, Volume* & Price*)

Note*: In applicable scenarios
Step 3 - Data Sources
Primary Research
- Web Analytics
- Survey Reports
- Research Institute
- Latest Research Reports
- Opinion Leaders
Secondary Research
- Annual Reports
- White Paper
- Latest Press Release
- Industry Association
- Paid Database
- Investor Presentations

Step 4 - Data Triangulation
Involves using different sources of information in order to increase the validity of a study
These sources are likely to be stakeholders in a program - participants, other researchers, program staff, other community members, and so on.
Then we put all data in single framework & apply various statistical tools to find out the dynamic on the market.
During the analysis stage, feedback from the stakeholder groups would be compared to determine areas of agreement as well as areas of divergence


