
Key Insights
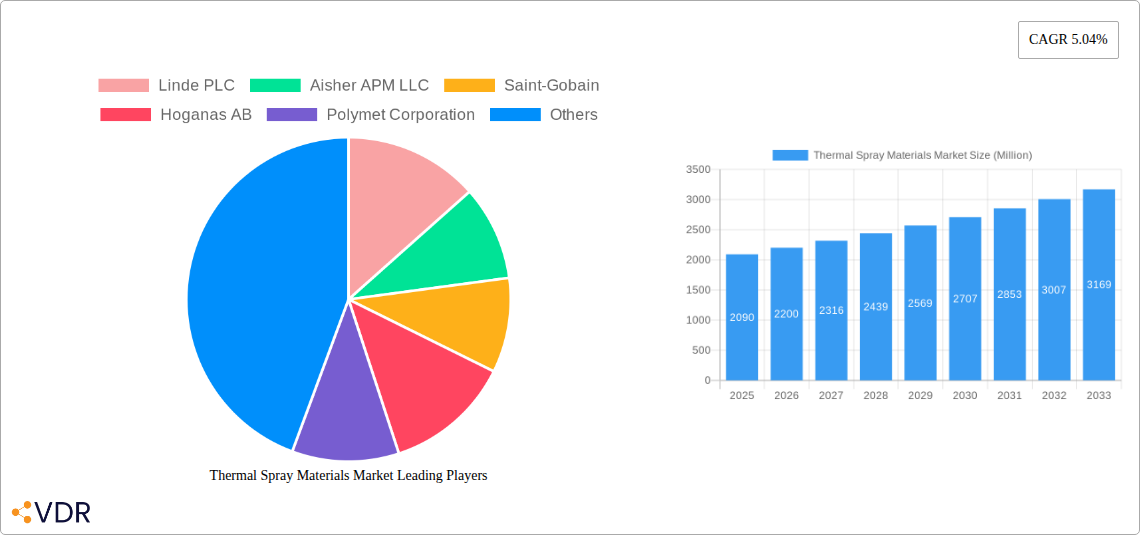
The global thermal spray materials market, valued at $2.09 billion in 2025, is projected to experience robust growth, driven by increasing demand across diverse end-user industries. A Compound Annual Growth Rate (CAGR) of 5.04% from 2025 to 2033 indicates a significant expansion in market size. Key growth drivers include the rising adoption of thermal spray coatings in aerospace and industrial gas turbine applications for enhanced performance and durability. The automotive industry's demand for lightweight and corrosion-resistant components further fuels market expansion. Technological advancements in coating materials, such as the development of advanced ceramics and metal alloys with improved properties, contribute to market growth. The market is segmented by material type (carbides, metals, ceramics, etc.), process type (combustion, electric energy), and end-user industry, reflecting the diverse applications of thermal spray technology. While the market faces potential restraints from fluctuating raw material prices and environmental regulations, the overall outlook remains positive, driven by ongoing innovation and expanding applications in emerging sectors like energy and power generation, and medical devices.
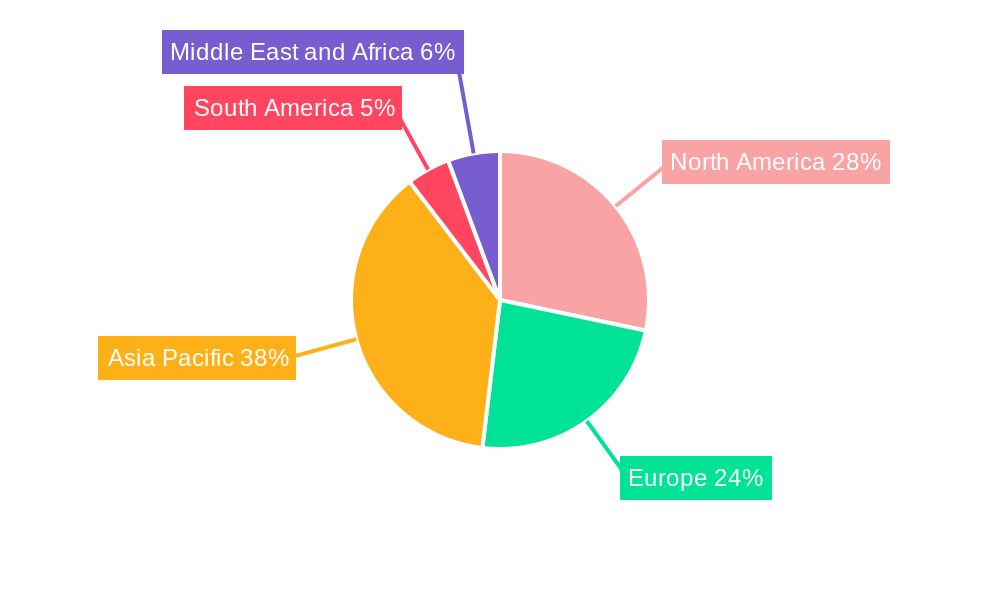
The market's regional distribution is expected to show varying growth rates. Asia-Pacific, particularly China and India, is likely to dominate due to rapid industrialization and significant investments in infrastructure development. North America and Europe will also contribute substantially, driven by advanced manufacturing sectors and technological innovation. Competitive landscape analysis reveals a mix of established players and emerging companies, emphasizing the importance of technological innovation and strategic partnerships for market success. The forecast period (2025-2033) promises consistent growth, fueled by ongoing investments in research and development and expanding applications across various industries. Specific segments such as advanced ceramic oxides and electric energy-based processes are likely to witness faster growth compared to the overall market average.
Thermal Spray Materials Market: A Comprehensive Report (2019-2033)
This in-depth report provides a comprehensive analysis of the Thermal Spray Materials market, encompassing market dynamics, growth trends, regional dominance, product landscapes, key players, and future outlooks. The study period covers 2019-2033, with 2025 as the base and estimated year. The report segments the market by parent markets (Process Type, End-user Industry, Product Type) and child markets (Carbides (including Cermets), Metals, MCrAlY, Other Coating Materials, Ceramic Oxides etc.) to offer a granular understanding of this dynamic sector. The total market size is projected to reach xx Million by 2033.
Thermal Spray Materials Market Dynamics & Structure
The Thermal Spray Materials market is characterized by moderate concentration, with several key players holding significant market share. Technological innovation, particularly in powder metallurgy and coating techniques, is a major driver. Stringent regulatory frameworks concerning environmental impact and material safety influence market dynamics. Competitive pressures arise from substitutes like other surface treatment technologies. The end-user demographics are diverse, spanning aerospace, automotive, and energy sectors, impacting market demand patterns. Significant M&A activity further shapes the market landscape.
- Market Concentration: Moderately concentrated, with top 5 players holding approximately xx% market share in 2024.
- Technological Innovation: Focus on developing high-performance, durable, and environmentally friendly coatings.
- Regulatory Frameworks: Compliance with environmental regulations (e.g., RoHS, REACH) impacts material choices and manufacturing processes.
- Competitive Substitutes: Alternative surface treatment methods (e.g., electroplating, CVD) pose competitive challenges.
- End-user Demographics: Diverse end-user industries contribute to market growth, with Aerospace and Industrial Gas Turbines currently leading.
- M&A Trends: Significant M&A activity observed in recent years, indicating consolidation and expansion strategies among market players (e.g., Oerlikon Metco's acquisition of Inglass S.p.A in 2021, Hoganas divestment in 2022). The volume of deals is estimated at xx in the past five years.
Thermal Spray Materials Market Growth Trends & Insights
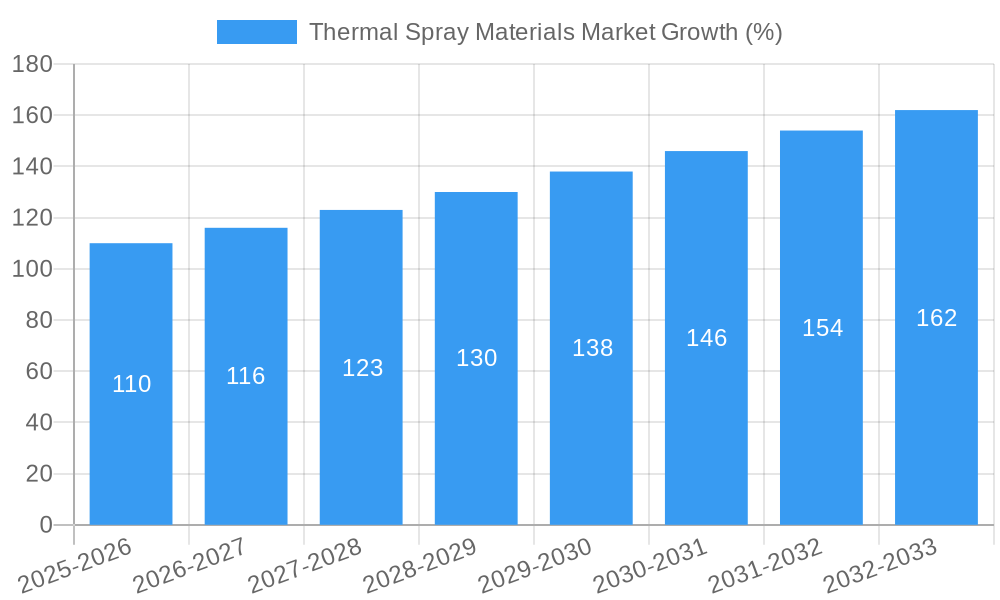
The Thermal Spray Materials market experienced steady growth during the historical period (2019-2024), driven by increasing demand from key end-user industries. The market is projected to witness robust expansion during the forecast period (2025-2033), fueled by technological advancements, rising adoption rates in emerging applications (e.g., medical implants, electronics), and increasing investments in infrastructure development. The compound annual growth rate (CAGR) is estimated at xx% for the forecast period. Market penetration is expected to increase significantly, particularly in developing economies experiencing rapid industrialization. This growth is also supported by the continuous improvements in process efficiency and the development of novel materials.
Dominant Regions, Countries, or Segments in Thermal Spray Materials Market
The North American region currently dominates the Thermal Spray Materials market, driven by a strong presence of key players and significant demand from the aerospace and automotive sectors. However, Asia-Pacific is expected to witness the fastest growth rate due to rapid industrialization and expansion of manufacturing bases.
- Leading Regions: North America currently holds the largest market share (xx%), followed by Europe (xx%) and Asia-Pacific (xx%).
- High-Growth Regions: Asia-Pacific is projected to exhibit the highest growth rate during the forecast period.
- Dominant Segments: Aerospace, Industrial Gas Turbines and Automotive industries are major consumers of thermal spray materials. Among product types, Metal powders currently hold the largest market share, while Ceramic Oxides segment shows promising growth.
- Key Drivers: Favorable economic policies, investments in infrastructure development (particularly in emerging economies), and government support for technological advancements are key drivers of regional growth.
Thermal Spray Materials Market Product Landscape
The Thermal Spray Materials market offers a diverse range of products, including various powders (ceramics, metals, polymers), coating materials, and auxiliary materials. Recent innovations focus on improving coating performance (e.g., enhanced wear resistance, corrosion protection, thermal stability), developing environmentally friendly materials, and optimizing process efficiency. Unique selling propositions often involve specialized material compositions, superior coating properties, and customized application solutions for specific end-user needs. Advances in additive manufacturing technologies are further expanding the application possibilities of thermal spray materials.
Key Drivers, Barriers & Challenges in Thermal Spray Materials Market
Key Drivers:
- Increasing demand from key end-user industries (e.g., aerospace, automotive, energy).
- Technological advancements leading to improved coating performance and efficiency.
- Government initiatives promoting sustainable manufacturing practices.
Challenges & Restraints:
- Fluctuations in raw material prices and supply chain disruptions.
- Stringent environmental regulations increasing production costs.
- Intense competition from substitute technologies. Estimated impact of supply chain issues on market growth: xx%.
Emerging Opportunities in Thermal Spray Materials Market
- Expanding applications in emerging industries (e.g., medical devices, electronics).
- Growing demand for sustainable and environmentally friendly materials.
- Development of advanced coating technologies with enhanced performance characteristics.
Growth Accelerators in the Thermal Spray Materials Market Industry
Strategic partnerships and collaborations among market players are crucial for driving long-term growth. Technological breakthroughs, such as the development of novel materials and improved coating techniques, are vital. Expanding into new and emerging markets, particularly in developing economies, offers significant growth opportunities.
Key Players Shaping the Thermal Spray Materials Market Market
- Linde PLC
- Aisher APM LLC
- Saint-Gobain
- Hoganas AB
- Polymet Corporation
- Castolin Eutectic
- Metallisation Limited
- OC Oerlikon Management AG
- LSN Diffusion Ltd
- Sandvik AB
- Metallizing Equipment Co Pvt Ltd
- Ametek Inc
- Global Tungsten & Powders Corp
- Hunter Chemical LLC
- Aimtek Inc
- C&M Technologies GmbH
- Thermion
- CenterLine (Windsor) Limited
- HAI Inc
- HC Starck GmbH
- CRS Holdings Inc
- Fisher Barton
- Kennametal Stellite
- Powder Alloy Corporation
Notable Milestones in Thermal Spray Materials Market Sector
- August 2022: Hoganas divested its binder-jetting AM technology producer (Digital Metal), signaling a shift towards increased investment in metal powder technologies.
- June 2021: Oerlikon Metco acquired Inglass S.p.A, expanding its presence in high-growth markets with innovative hot runner system technologies.
In-Depth Thermal Spray Materials Market Market Outlook
The Thermal Spray Materials market is poised for sustained growth driven by continuous technological advancements, increasing demand from various industries, and strategic expansion initiatives by key players. Future market potential is significant, with opportunities in emerging applications and regions. Strategic partnerships and investments in research and development will be key to realizing this potential, emphasizing the development of sustainable and high-performance coating solutions.
Thermal Spray Materials Market Segmentation
-
1. Product Type
-
1.1. Coating Materials
-
1.1.1. Powders
-
1.1.1.1. Ceramics
-
1.1.1.1.1. Ceramic Oxides
- 1.1.1.1.1.1. Alumina
- 1.1.1.1.1.2. Titania
- 1.1.1.1.1.3. Zirconia
- 1.1.1.1.1.4. Chromia and Other Ceramic Oxides
-
1.1.1.1.2. Carbides (including Cermets)
- 1.1.1.1.2.1. Chromium Carbides
- 1.1.1.1.2.2. Tungsten Carbides
-
1.1.1.1.1. Ceramic Oxides
-
1.1.1.2. Metals
- 1.1.1.2.1. Pure Metal and Alloys
- 1.1.1.2.2. Precious Metals
- 1.1.1.2.3. MCrAlY
- 1.1.1.3. Polymer and Other Coating Materials
-
1.1.1.1. Ceramics
- 1.1.2. Wires/Rods
- 1.1.3. Other Coating Materials (Liquid)
-
1.1.1. Powders
- 1.2. Supplementary Materials (Auxiliary Materials)
-
1.1. Coating Materials
-
2. Process Type
- 2.1. Combustion
- 2.2. Electric Energy
-
3. End-user Industry
- 3.1. Aerospace
- 3.2. Industrial Gas Turbines
- 3.3. Automotive
- 3.4. Electronics
- 3.5. Oil and Gas
- 3.6. Medical Devices
- 3.7. Energy and Power
- 3.8. Other End-user Industries
Thermal Spray Materials Market Segmentation By Geography
-
1. Asia Pacific
- 1.1. China
- 1.2. India
- 1.3. Japan
- 1.4. South Korea
- 1.5. ASEAN Countries
- 1.6. Rest of Asia Pacific
-
2. North America
- 2.1. United States
- 2.2. Canada
- 2.3. Mexico
-
3. Europe
- 3.1. Germany
- 3.2. United Kingdom
- 3.3. France
- 3.4. Italy
- 3.5. Rest of Europe
-
4. South America
- 4.1. Brazil
- 4.2. Argentina
- 4.3. Rest of South America
-
5. Middle East and Africa
- 5.1. Saudi Arabia
- 5.2. South Africa
- 5.3. Rest of Middle East and Africa
Thermal Spray Materials Market REPORT HIGHLIGHTS
| Aspects | Details |
|---|---|
| Study Period | 2019-2033 |
| Base Year | 2024 |
| Estimated Year | 2025 |
| Forecast Period | 2025-2033 |
| Historical Period | 2019-2024 |
| Growth Rate | CAGR of 5.04% from 2019-2033 |
| Segmentation |
|
Table of Contents
- 1. Introduction
- 1.1. Research Scope
- 1.2. Market Segmentation
- 1.3. Research Methodology
- 1.4. Definitions and Assumptions
- 2. Executive Summary
- 2.1. Introduction
- 3. Market Dynamics
- 3.1. Introduction
- 3.2. Market Drivers
- 3.2.1. Increasing Usage of Thermal Spray Coating in Medical Device Manufacturing; Rising Demand of Thermal Spray Ceramic Coatings; Extensive Consumption in Anti-corrosion Applications; Evolution in the Asia-Pacific Wind Power Sector
- 3.3. Market Restrains
- 3.3.1. Emergence of Alternate Substitutes
- 3.4. Market Trends
- 3.4.1. Aerospace Industry to Dominate the Market
- 4. Market Factor Analysis
- 4.1. Porters Five Forces
- 4.2. Supply/Value Chain
- 4.3. PESTEL analysis
- 4.4. Market Entropy
- 4.5. Patent/Trademark Analysis
- 5. Global Thermal Spray Materials Market Analysis, Insights and Forecast, 2019-2031
- 5.1. Market Analysis, Insights and Forecast - by Product Type
- 5.1.1. Coating Materials
- 5.1.1.1. Powders
- 5.1.1.1.1. Ceramics
- 5.1.1.1.1.1. Ceramic Oxides
- 5.1.1.1.1.1.1. Alumina
- 5.1.1.1.1.1.2. Titania
- 5.1.1.1.1.1.3. Zirconia
- 5.1.1.1.1.1.4. Chromia and Other Ceramic Oxides
- 5.1.1.1.1.2. Carbides (including Cermets)
- 5.1.1.1.1.2.1. Chromium Carbides
- 5.1.1.1.1.2.2. Tungsten Carbides
- 5.1.1.1.1.1. Ceramic Oxides
- 5.1.1.1.2. Metals
- 5.1.1.1.2.1. Pure Metal and Alloys
- 5.1.1.1.2.2. Precious Metals
- 5.1.1.1.2.3. MCrAlY
- 5.1.1.1.3. Polymer and Other Coating Materials
- 5.1.1.1.1. Ceramics
- 5.1.1.2. Wires/Rods
- 5.1.1.3. Other Coating Materials (Liquid)
- 5.1.1.1. Powders
- 5.1.2. Supplementary Materials (Auxiliary Materials)
- 5.1.1. Coating Materials
- 5.2. Market Analysis, Insights and Forecast - by Process Type
- 5.2.1. Combustion
- 5.2.2. Electric Energy
- 5.3. Market Analysis, Insights and Forecast - by End-user Industry
- 5.3.1. Aerospace
- 5.3.2. Industrial Gas Turbines
- 5.3.3. Automotive
- 5.3.4. Electronics
- 5.3.5. Oil and Gas
- 5.3.6. Medical Devices
- 5.3.7. Energy and Power
- 5.3.8. Other End-user Industries
- 5.4. Market Analysis, Insights and Forecast - by Region
- 5.4.1. Asia Pacific
- 5.4.2. North America
- 5.4.3. Europe
- 5.4.4. South America
- 5.4.5. Middle East and Africa
- 5.1. Market Analysis, Insights and Forecast - by Product Type
- 6. Asia Pacific Thermal Spray Materials Market Analysis, Insights and Forecast, 2019-2031
- 6.1. Market Analysis, Insights and Forecast - by Product Type
- 6.1.1. Coating Materials
- 6.1.1.1. Powders
- 6.1.1.1.1. Ceramics
- 6.1.1.1.1.1. Ceramic Oxides
- 6.1.1.1.1.1.1. Alumina
- 6.1.1.1.1.1.2. Titania
- 6.1.1.1.1.1.3. Zirconia
- 6.1.1.1.1.1.4. Chromia and Other Ceramic Oxides
- 6.1.1.1.1.2. Carbides (including Cermets)
- 6.1.1.1.1.2.1. Chromium Carbides
- 6.1.1.1.1.2.2. Tungsten Carbides
- 6.1.1.1.1.1. Ceramic Oxides
- 6.1.1.1.2. Metals
- 6.1.1.1.2.1. Pure Metal and Alloys
- 6.1.1.1.2.2. Precious Metals
- 6.1.1.1.2.3. MCrAlY
- 6.1.1.1.3. Polymer and Other Coating Materials
- 6.1.1.1.1. Ceramics
- 6.1.1.2. Wires/Rods
- 6.1.1.3. Other Coating Materials (Liquid)
- 6.1.1.1. Powders
- 6.1.2. Supplementary Materials (Auxiliary Materials)
- 6.1.1. Coating Materials
- 6.2. Market Analysis, Insights and Forecast - by Process Type
- 6.2.1. Combustion
- 6.2.2. Electric Energy
- 6.3. Market Analysis, Insights and Forecast - by End-user Industry
- 6.3.1. Aerospace
- 6.3.2. Industrial Gas Turbines
- 6.3.3. Automotive
- 6.3.4. Electronics
- 6.3.5. Oil and Gas
- 6.3.6. Medical Devices
- 6.3.7. Energy and Power
- 6.3.8. Other End-user Industries
- 6.1. Market Analysis, Insights and Forecast - by Product Type
- 7. North America Thermal Spray Materials Market Analysis, Insights and Forecast, 2019-2031
- 7.1. Market Analysis, Insights and Forecast - by Product Type
- 7.1.1. Coating Materials
- 7.1.1.1. Powders
- 7.1.1.1.1. Ceramics
- 7.1.1.1.1.1. Ceramic Oxides
- 7.1.1.1.1.1.1. Alumina
- 7.1.1.1.1.1.2. Titania
- 7.1.1.1.1.1.3. Zirconia
- 7.1.1.1.1.1.4. Chromia and Other Ceramic Oxides
- 7.1.1.1.1.2. Carbides (including Cermets)
- 7.1.1.1.1.2.1. Chromium Carbides
- 7.1.1.1.1.2.2. Tungsten Carbides
- 7.1.1.1.1.1. Ceramic Oxides
- 7.1.1.1.2. Metals
- 7.1.1.1.2.1. Pure Metal and Alloys
- 7.1.1.1.2.2. Precious Metals
- 7.1.1.1.2.3. MCrAlY
- 7.1.1.1.3. Polymer and Other Coating Materials
- 7.1.1.1.1. Ceramics
- 7.1.1.2. Wires/Rods
- 7.1.1.3. Other Coating Materials (Liquid)
- 7.1.1.1. Powders
- 7.1.2. Supplementary Materials (Auxiliary Materials)
- 7.1.1. Coating Materials
- 7.2. Market Analysis, Insights and Forecast - by Process Type
- 7.2.1. Combustion
- 7.2.2. Electric Energy
- 7.3. Market Analysis, Insights and Forecast - by End-user Industry
- 7.3.1. Aerospace
- 7.3.2. Industrial Gas Turbines
- 7.3.3. Automotive
- 7.3.4. Electronics
- 7.3.5. Oil and Gas
- 7.3.6. Medical Devices
- 7.3.7. Energy and Power
- 7.3.8. Other End-user Industries
- 7.1. Market Analysis, Insights and Forecast - by Product Type
- 8. Europe Thermal Spray Materials Market Analysis, Insights and Forecast, 2019-2031
- 8.1. Market Analysis, Insights and Forecast - by Product Type
- 8.1.1. Coating Materials
- 8.1.1.1. Powders
- 8.1.1.1.1. Ceramics
- 8.1.1.1.1.1. Ceramic Oxides
- 8.1.1.1.1.1.1. Alumina
- 8.1.1.1.1.1.2. Titania
- 8.1.1.1.1.1.3. Zirconia
- 8.1.1.1.1.1.4. Chromia and Other Ceramic Oxides
- 8.1.1.1.1.2. Carbides (including Cermets)
- 8.1.1.1.1.2.1. Chromium Carbides
- 8.1.1.1.1.2.2. Tungsten Carbides
- 8.1.1.1.1.1. Ceramic Oxides
- 8.1.1.1.2. Metals
- 8.1.1.1.2.1. Pure Metal and Alloys
- 8.1.1.1.2.2. Precious Metals
- 8.1.1.1.2.3. MCrAlY
- 8.1.1.1.3. Polymer and Other Coating Materials
- 8.1.1.1.1. Ceramics
- 8.1.1.2. Wires/Rods
- 8.1.1.3. Other Coating Materials (Liquid)
- 8.1.1.1. Powders
- 8.1.2. Supplementary Materials (Auxiliary Materials)
- 8.1.1. Coating Materials
- 8.2. Market Analysis, Insights and Forecast - by Process Type
- 8.2.1. Combustion
- 8.2.2. Electric Energy
- 8.3. Market Analysis, Insights and Forecast - by End-user Industry
- 8.3.1. Aerospace
- 8.3.2. Industrial Gas Turbines
- 8.3.3. Automotive
- 8.3.4. Electronics
- 8.3.5. Oil and Gas
- 8.3.6. Medical Devices
- 8.3.7. Energy and Power
- 8.3.8. Other End-user Industries
- 8.1. Market Analysis, Insights and Forecast - by Product Type
- 9. South America Thermal Spray Materials Market Analysis, Insights and Forecast, 2019-2031
- 9.1. Market Analysis, Insights and Forecast - by Product Type
- 9.1.1. Coating Materials
- 9.1.1.1. Powders
- 9.1.1.1.1. Ceramics
- 9.1.1.1.1.1. Ceramic Oxides
- 9.1.1.1.1.1.1. Alumina
- 9.1.1.1.1.1.2. Titania
- 9.1.1.1.1.1.3. Zirconia
- 9.1.1.1.1.1.4. Chromia and Other Ceramic Oxides
- 9.1.1.1.1.2. Carbides (including Cermets)
- 9.1.1.1.1.2.1. Chromium Carbides
- 9.1.1.1.1.2.2. Tungsten Carbides
- 9.1.1.1.1.1. Ceramic Oxides
- 9.1.1.1.2. Metals
- 9.1.1.1.2.1. Pure Metal and Alloys
- 9.1.1.1.2.2. Precious Metals
- 9.1.1.1.2.3. MCrAlY
- 9.1.1.1.3. Polymer and Other Coating Materials
- 9.1.1.1.1. Ceramics
- 9.1.1.2. Wires/Rods
- 9.1.1.3. Other Coating Materials (Liquid)
- 9.1.1.1. Powders
- 9.1.2. Supplementary Materials (Auxiliary Materials)
- 9.1.1. Coating Materials
- 9.2. Market Analysis, Insights and Forecast - by Process Type
- 9.2.1. Combustion
- 9.2.2. Electric Energy
- 9.3. Market Analysis, Insights and Forecast - by End-user Industry
- 9.3.1. Aerospace
- 9.3.2. Industrial Gas Turbines
- 9.3.3. Automotive
- 9.3.4. Electronics
- 9.3.5. Oil and Gas
- 9.3.6. Medical Devices
- 9.3.7. Energy and Power
- 9.3.8. Other End-user Industries
- 9.1. Market Analysis, Insights and Forecast - by Product Type
- 10. Middle East and Africa Thermal Spray Materials Market Analysis, Insights and Forecast, 2019-2031
- 10.1. Market Analysis, Insights and Forecast - by Product Type
- 10.1.1. Coating Materials
- 10.1.1.1. Powders
- 10.1.1.1.1. Ceramics
- 10.1.1.1.1.1. Ceramic Oxides
- 10.1.1.1.1.1.1. Alumina
- 10.1.1.1.1.1.2. Titania
- 10.1.1.1.1.1.3. Zirconia
- 10.1.1.1.1.1.4. Chromia and Other Ceramic Oxides
- 10.1.1.1.1.2. Carbides (including Cermets)
- 10.1.1.1.1.2.1. Chromium Carbides
- 10.1.1.1.1.2.2. Tungsten Carbides
- 10.1.1.1.1.1. Ceramic Oxides
- 10.1.1.1.2. Metals
- 10.1.1.1.2.1. Pure Metal and Alloys
- 10.1.1.1.2.2. Precious Metals
- 10.1.1.1.2.3. MCrAlY
- 10.1.1.1.3. Polymer and Other Coating Materials
- 10.1.1.1.1. Ceramics
- 10.1.1.2. Wires/Rods
- 10.1.1.3. Other Coating Materials (Liquid)
- 10.1.1.1. Powders
- 10.1.2. Supplementary Materials (Auxiliary Materials)
- 10.1.1. Coating Materials
- 10.2. Market Analysis, Insights and Forecast - by Process Type
- 10.2.1. Combustion
- 10.2.2. Electric Energy
- 10.3. Market Analysis, Insights and Forecast - by End-user Industry
- 10.3.1. Aerospace
- 10.3.2. Industrial Gas Turbines
- 10.3.3. Automotive
- 10.3.4. Electronics
- 10.3.5. Oil and Gas
- 10.3.6. Medical Devices
- 10.3.7. Energy and Power
- 10.3.8. Other End-user Industries
- 10.1. Market Analysis, Insights and Forecast - by Product Type
- 11. Asia Pacific Thermal Spray Materials Market Analysis, Insights and Forecast, 2019-2031
- 11.1. Market Analysis, Insights and Forecast - By Country/Sub-region
- 11.1.1 China
- 11.1.2 India
- 11.1.3 Japan
- 11.1.4 South Korea
- 11.1.5 ASEAN Countries
- 11.1.6 Rest of Asia Pacific
- 12. North America Thermal Spray Materials Market Analysis, Insights and Forecast, 2019-2031
- 12.1. Market Analysis, Insights and Forecast - By Country/Sub-region
- 12.1.1 United States
- 12.1.2 Canada
- 12.1.3 Mexico
- 13. Europe Thermal Spray Materials Market Analysis, Insights and Forecast, 2019-2031
- 13.1. Market Analysis, Insights and Forecast - By Country/Sub-region
- 13.1.1 Germany
- 13.1.2 United Kingdom
- 13.1.3 France
- 13.1.4 Italy
- 13.1.5 Rest of Europe
- 14. South America Thermal Spray Materials Market Analysis, Insights and Forecast, 2019-2031
- 14.1. Market Analysis, Insights and Forecast - By Country/Sub-region
- 14.1.1 Brazil
- 14.1.2 Argentina
- 14.1.3 Rest of South America
- 15. Middle East and Africa Thermal Spray Materials Market Analysis, Insights and Forecast, 2019-2031
- 15.1. Market Analysis, Insights and Forecast - By Country/Sub-region
- 15.1.1 Saudi Arabia
- 15.1.2 South Africa
- 15.1.3 Rest of Middle East and Africa
- 16. Competitive Analysis
- 16.1. Global Market Share Analysis 2024
- 16.2. Company Profiles
- 16.2.1 Linde PLC
- 16.2.1.1. Overview
- 16.2.1.2. Products
- 16.2.1.3. SWOT Analysis
- 16.2.1.4. Recent Developments
- 16.2.1.5. Financials (Based on Availability)
- 16.2.2 Aisher APM LLC
- 16.2.2.1. Overview
- 16.2.2.2. Products
- 16.2.2.3. SWOT Analysis
- 16.2.2.4. Recent Developments
- 16.2.2.5. Financials (Based on Availability)
- 16.2.3 Saint-Gobain
- 16.2.3.1. Overview
- 16.2.3.2. Products
- 16.2.3.3. SWOT Analysis
- 16.2.3.4. Recent Developments
- 16.2.3.5. Financials (Based on Availability)
- 16.2.4 Hoganas AB
- 16.2.4.1. Overview
- 16.2.4.2. Products
- 16.2.4.3. SWOT Analysis
- 16.2.4.4. Recent Developments
- 16.2.4.5. Financials (Based on Availability)
- 16.2.5 Polymet Corporation
- 16.2.5.1. Overview
- 16.2.5.2. Products
- 16.2.5.3. SWOT Analysis
- 16.2.5.4. Recent Developments
- 16.2.5.5. Financials (Based on Availability)
- 16.2.6 Castolin Eutectic
- 16.2.6.1. Overview
- 16.2.6.2. Products
- 16.2.6.3. SWOT Analysis
- 16.2.6.4. Recent Developments
- 16.2.6.5. Financials (Based on Availability)
- 16.2.7 Metallisation Limited
- 16.2.7.1. Overview
- 16.2.7.2. Products
- 16.2.7.3. SWOT Analysis
- 16.2.7.4. Recent Developments
- 16.2.7.5. Financials (Based on Availability)
- 16.2.8 OC Oerlikon Management AG
- 16.2.8.1. Overview
- 16.2.8.2. Products
- 16.2.8.3. SWOT Analysis
- 16.2.8.4. Recent Developments
- 16.2.8.5. Financials (Based on Availability)
- 16.2.9 LSN Diffusion Ltd
- 16.2.9.1. Overview
- 16.2.9.2. Products
- 16.2.9.3. SWOT Analysis
- 16.2.9.4. Recent Developments
- 16.2.9.5. Financials (Based on Availability)
- 16.2.10 Sandvik AB
- 16.2.10.1. Overview
- 16.2.10.2. Products
- 16.2.10.3. SWOT Analysis
- 16.2.10.4. Recent Developments
- 16.2.10.5. Financials (Based on Availability)
- 16.2.11 Metallizing Equipment Co Pvt Ltd
- 16.2.11.1. Overview
- 16.2.11.2. Products
- 16.2.11.3. SWOT Analysis
- 16.2.11.4. Recent Developments
- 16.2.11.5. Financials (Based on Availability)
- 16.2.12 Ametek Inc
- 16.2.12.1. Overview
- 16.2.12.2. Products
- 16.2.12.3. SWOT Analysis
- 16.2.12.4. Recent Developments
- 16.2.12.5. Financials (Based on Availability)
- 16.2.13 Global Tungsten & Powders Corp
- 16.2.13.1. Overview
- 16.2.13.2. Products
- 16.2.13.3. SWOT Analysis
- 16.2.13.4. Recent Developments
- 16.2.13.5. Financials (Based on Availability)
- 16.2.14 Hunter Chemical LLC
- 16.2.14.1. Overview
- 16.2.14.2. Products
- 16.2.14.3. SWOT Analysis
- 16.2.14.4. Recent Developments
- 16.2.14.5. Financials (Based on Availability)
- 16.2.15 Aimtek Inc
- 16.2.15.1. Overview
- 16.2.15.2. Products
- 16.2.15.3. SWOT Analysis
- 16.2.15.4. Recent Developments
- 16.2.15.5. Financials (Based on Availability)
- 16.2.16 C&M Technologies GmbH
- 16.2.16.1. Overview
- 16.2.16.2. Products
- 16.2.16.3. SWOT Analysis
- 16.2.16.4. Recent Developments
- 16.2.16.5. Financials (Based on Availability)
- 16.2.17 Thermion*List Not Exhaustive
- 16.2.17.1. Overview
- 16.2.17.2. Products
- 16.2.17.3. SWOT Analysis
- 16.2.17.4. Recent Developments
- 16.2.17.5. Financials (Based on Availability)
- 16.2.18 CenterLine (Windsor) Limited
- 16.2.18.1. Overview
- 16.2.18.2. Products
- 16.2.18.3. SWOT Analysis
- 16.2.18.4. Recent Developments
- 16.2.18.5. Financials (Based on Availability)
- 16.2.19 HAI Inc
- 16.2.19.1. Overview
- 16.2.19.2. Products
- 16.2.19.3. SWOT Analysis
- 16.2.19.4. Recent Developments
- 16.2.19.5. Financials (Based on Availability)
- 16.2.20 HC Starck GmbH
- 16.2.20.1. Overview
- 16.2.20.2. Products
- 16.2.20.3. SWOT Analysis
- 16.2.20.4. Recent Developments
- 16.2.20.5. Financials (Based on Availability)
- 16.2.21 CRS Holdings Inc
- 16.2.21.1. Overview
- 16.2.21.2. Products
- 16.2.21.3. SWOT Analysis
- 16.2.21.4. Recent Developments
- 16.2.21.5. Financials (Based on Availability)
- 16.2.22 Fisher Barton
- 16.2.22.1. Overview
- 16.2.22.2. Products
- 16.2.22.3. SWOT Analysis
- 16.2.22.4. Recent Developments
- 16.2.22.5. Financials (Based on Availability)
- 16.2.23 Kennametal Stellite
- 16.2.23.1. Overview
- 16.2.23.2. Products
- 16.2.23.3. SWOT Analysis
- 16.2.23.4. Recent Developments
- 16.2.23.5. Financials (Based on Availability)
- 16.2.24 Powder Alloy Corporation
- 16.2.24.1. Overview
- 16.2.24.2. Products
- 16.2.24.3. SWOT Analysis
- 16.2.24.4. Recent Developments
- 16.2.24.5. Financials (Based on Availability)
- 16.2.1 Linde PLC
List of Figures
- Figure 1: Global Thermal Spray Materials Market Revenue Breakdown (Million, %) by Region 2024 & 2032
- Figure 2: Global Thermal Spray Materials Market Volume Breakdown (K Tons, %) by Region 2024 & 2032
- Figure 3: Asia Pacific Thermal Spray Materials Market Revenue (Million), by Country 2024 & 2032
- Figure 4: Asia Pacific Thermal Spray Materials Market Volume (K Tons), by Country 2024 & 2032
- Figure 5: Asia Pacific Thermal Spray Materials Market Revenue Share (%), by Country 2024 & 2032
- Figure 6: Asia Pacific Thermal Spray Materials Market Volume Share (%), by Country 2024 & 2032
- Figure 7: North America Thermal Spray Materials Market Revenue (Million), by Country 2024 & 2032
- Figure 8: North America Thermal Spray Materials Market Volume (K Tons), by Country 2024 & 2032
- Figure 9: North America Thermal Spray Materials Market Revenue Share (%), by Country 2024 & 2032
- Figure 10: North America Thermal Spray Materials Market Volume Share (%), by Country 2024 & 2032
- Figure 11: Europe Thermal Spray Materials Market Revenue (Million), by Country 2024 & 2032
- Figure 12: Europe Thermal Spray Materials Market Volume (K Tons), by Country 2024 & 2032
- Figure 13: Europe Thermal Spray Materials Market Revenue Share (%), by Country 2024 & 2032
- Figure 14: Europe Thermal Spray Materials Market Volume Share (%), by Country 2024 & 2032
- Figure 15: South America Thermal Spray Materials Market Revenue (Million), by Country 2024 & 2032
- Figure 16: South America Thermal Spray Materials Market Volume (K Tons), by Country 2024 & 2032
- Figure 17: South America Thermal Spray Materials Market Revenue Share (%), by Country 2024 & 2032
- Figure 18: South America Thermal Spray Materials Market Volume Share (%), by Country 2024 & 2032
- Figure 19: Middle East and Africa Thermal Spray Materials Market Revenue (Million), by Country 2024 & 2032
- Figure 20: Middle East and Africa Thermal Spray Materials Market Volume (K Tons), by Country 2024 & 2032
- Figure 21: Middle East and Africa Thermal Spray Materials Market Revenue Share (%), by Country 2024 & 2032
- Figure 22: Middle East and Africa Thermal Spray Materials Market Volume Share (%), by Country 2024 & 2032
- Figure 23: Asia Pacific Thermal Spray Materials Market Revenue (Million), by Product Type 2024 & 2032
- Figure 24: Asia Pacific Thermal Spray Materials Market Volume (K Tons), by Product Type 2024 & 2032
- Figure 25: Asia Pacific Thermal Spray Materials Market Revenue Share (%), by Product Type 2024 & 2032
- Figure 26: Asia Pacific Thermal Spray Materials Market Volume Share (%), by Product Type 2024 & 2032
- Figure 27: Asia Pacific Thermal Spray Materials Market Revenue (Million), by Process Type 2024 & 2032
- Figure 28: Asia Pacific Thermal Spray Materials Market Volume (K Tons), by Process Type 2024 & 2032
- Figure 29: Asia Pacific Thermal Spray Materials Market Revenue Share (%), by Process Type 2024 & 2032
- Figure 30: Asia Pacific Thermal Spray Materials Market Volume Share (%), by Process Type 2024 & 2032
- Figure 31: Asia Pacific Thermal Spray Materials Market Revenue (Million), by End-user Industry 2024 & 2032
- Figure 32: Asia Pacific Thermal Spray Materials Market Volume (K Tons), by End-user Industry 2024 & 2032
- Figure 33: Asia Pacific Thermal Spray Materials Market Revenue Share (%), by End-user Industry 2024 & 2032
- Figure 34: Asia Pacific Thermal Spray Materials Market Volume Share (%), by End-user Industry 2024 & 2032
- Figure 35: Asia Pacific Thermal Spray Materials Market Revenue (Million), by Country 2024 & 2032
- Figure 36: Asia Pacific Thermal Spray Materials Market Volume (K Tons), by Country 2024 & 2032
- Figure 37: Asia Pacific Thermal Spray Materials Market Revenue Share (%), by Country 2024 & 2032
- Figure 38: Asia Pacific Thermal Spray Materials Market Volume Share (%), by Country 2024 & 2032
- Figure 39: North America Thermal Spray Materials Market Revenue (Million), by Product Type 2024 & 2032
- Figure 40: North America Thermal Spray Materials Market Volume (K Tons), by Product Type 2024 & 2032
- Figure 41: North America Thermal Spray Materials Market Revenue Share (%), by Product Type 2024 & 2032
- Figure 42: North America Thermal Spray Materials Market Volume Share (%), by Product Type 2024 & 2032
- Figure 43: North America Thermal Spray Materials Market Revenue (Million), by Process Type 2024 & 2032
- Figure 44: North America Thermal Spray Materials Market Volume (K Tons), by Process Type 2024 & 2032
- Figure 45: North America Thermal Spray Materials Market Revenue Share (%), by Process Type 2024 & 2032
- Figure 46: North America Thermal Spray Materials Market Volume Share (%), by Process Type 2024 & 2032
- Figure 47: North America Thermal Spray Materials Market Revenue (Million), by End-user Industry 2024 & 2032
- Figure 48: North America Thermal Spray Materials Market Volume (K Tons), by End-user Industry 2024 & 2032
- Figure 49: North America Thermal Spray Materials Market Revenue Share (%), by End-user Industry 2024 & 2032
- Figure 50: North America Thermal Spray Materials Market Volume Share (%), by End-user Industry 2024 & 2032
- Figure 51: North America Thermal Spray Materials Market Revenue (Million), by Country 2024 & 2032
- Figure 52: North America Thermal Spray Materials Market Volume (K Tons), by Country 2024 & 2032
- Figure 53: North America Thermal Spray Materials Market Revenue Share (%), by Country 2024 & 2032
- Figure 54: North America Thermal Spray Materials Market Volume Share (%), by Country 2024 & 2032
- Figure 55: Europe Thermal Spray Materials Market Revenue (Million), by Product Type 2024 & 2032
- Figure 56: Europe Thermal Spray Materials Market Volume (K Tons), by Product Type 2024 & 2032
- Figure 57: Europe Thermal Spray Materials Market Revenue Share (%), by Product Type 2024 & 2032
- Figure 58: Europe Thermal Spray Materials Market Volume Share (%), by Product Type 2024 & 2032
- Figure 59: Europe Thermal Spray Materials Market Revenue (Million), by Process Type 2024 & 2032
- Figure 60: Europe Thermal Spray Materials Market Volume (K Tons), by Process Type 2024 & 2032
- Figure 61: Europe Thermal Spray Materials Market Revenue Share (%), by Process Type 2024 & 2032
- Figure 62: Europe Thermal Spray Materials Market Volume Share (%), by Process Type 2024 & 2032
- Figure 63: Europe Thermal Spray Materials Market Revenue (Million), by End-user Industry 2024 & 2032
- Figure 64: Europe Thermal Spray Materials Market Volume (K Tons), by End-user Industry 2024 & 2032
- Figure 65: Europe Thermal Spray Materials Market Revenue Share (%), by End-user Industry 2024 & 2032
- Figure 66: Europe Thermal Spray Materials Market Volume Share (%), by End-user Industry 2024 & 2032
- Figure 67: Europe Thermal Spray Materials Market Revenue (Million), by Country 2024 & 2032
- Figure 68: Europe Thermal Spray Materials Market Volume (K Tons), by Country 2024 & 2032
- Figure 69: Europe Thermal Spray Materials Market Revenue Share (%), by Country 2024 & 2032
- Figure 70: Europe Thermal Spray Materials Market Volume Share (%), by Country 2024 & 2032
- Figure 71: South America Thermal Spray Materials Market Revenue (Million), by Product Type 2024 & 2032
- Figure 72: South America Thermal Spray Materials Market Volume (K Tons), by Product Type 2024 & 2032
- Figure 73: South America Thermal Spray Materials Market Revenue Share (%), by Product Type 2024 & 2032
- Figure 74: South America Thermal Spray Materials Market Volume Share (%), by Product Type 2024 & 2032
- Figure 75: South America Thermal Spray Materials Market Revenue (Million), by Process Type 2024 & 2032
- Figure 76: South America Thermal Spray Materials Market Volume (K Tons), by Process Type 2024 & 2032
- Figure 77: South America Thermal Spray Materials Market Revenue Share (%), by Process Type 2024 & 2032
- Figure 78: South America Thermal Spray Materials Market Volume Share (%), by Process Type 2024 & 2032
- Figure 79: South America Thermal Spray Materials Market Revenue (Million), by End-user Industry 2024 & 2032
- Figure 80: South America Thermal Spray Materials Market Volume (K Tons), by End-user Industry 2024 & 2032
- Figure 81: South America Thermal Spray Materials Market Revenue Share (%), by End-user Industry 2024 & 2032
- Figure 82: South America Thermal Spray Materials Market Volume Share (%), by End-user Industry 2024 & 2032
- Figure 83: South America Thermal Spray Materials Market Revenue (Million), by Country 2024 & 2032
- Figure 84: South America Thermal Spray Materials Market Volume (K Tons), by Country 2024 & 2032
- Figure 85: South America Thermal Spray Materials Market Revenue Share (%), by Country 2024 & 2032
- Figure 86: South America Thermal Spray Materials Market Volume Share (%), by Country 2024 & 2032
- Figure 87: Middle East and Africa Thermal Spray Materials Market Revenue (Million), by Product Type 2024 & 2032
- Figure 88: Middle East and Africa Thermal Spray Materials Market Volume (K Tons), by Product Type 2024 & 2032
- Figure 89: Middle East and Africa Thermal Spray Materials Market Revenue Share (%), by Product Type 2024 & 2032
- Figure 90: Middle East and Africa Thermal Spray Materials Market Volume Share (%), by Product Type 2024 & 2032
- Figure 91: Middle East and Africa Thermal Spray Materials Market Revenue (Million), by Process Type 2024 & 2032
- Figure 92: Middle East and Africa Thermal Spray Materials Market Volume (K Tons), by Process Type 2024 & 2032
- Figure 93: Middle East and Africa Thermal Spray Materials Market Revenue Share (%), by Process Type 2024 & 2032
- Figure 94: Middle East and Africa Thermal Spray Materials Market Volume Share (%), by Process Type 2024 & 2032
- Figure 95: Middle East and Africa Thermal Spray Materials Market Revenue (Million), by End-user Industry 2024 & 2032
- Figure 96: Middle East and Africa Thermal Spray Materials Market Volume (K Tons), by End-user Industry 2024 & 2032
- Figure 97: Middle East and Africa Thermal Spray Materials Market Revenue Share (%), by End-user Industry 2024 & 2032
- Figure 98: Middle East and Africa Thermal Spray Materials Market Volume Share (%), by End-user Industry 2024 & 2032
- Figure 99: Middle East and Africa Thermal Spray Materials Market Revenue (Million), by Country 2024 & 2032
- Figure 100: Middle East and Africa Thermal Spray Materials Market Volume (K Tons), by Country 2024 & 2032
- Figure 101: Middle East and Africa Thermal Spray Materials Market Revenue Share (%), by Country 2024 & 2032
- Figure 102: Middle East and Africa Thermal Spray Materials Market Volume Share (%), by Country 2024 & 2032
List of Tables
- Table 1: Global Thermal Spray Materials Market Revenue Million Forecast, by Region 2019 & 2032
- Table 2: Global Thermal Spray Materials Market Volume K Tons Forecast, by Region 2019 & 2032
- Table 3: Global Thermal Spray Materials Market Revenue Million Forecast, by Product Type 2019 & 2032
- Table 4: Global Thermal Spray Materials Market Volume K Tons Forecast, by Product Type 2019 & 2032
- Table 5: Global Thermal Spray Materials Market Revenue Million Forecast, by Process Type 2019 & 2032
- Table 6: Global Thermal Spray Materials Market Volume K Tons Forecast, by Process Type 2019 & 2032
- Table 7: Global Thermal Spray Materials Market Revenue Million Forecast, by End-user Industry 2019 & 2032
- Table 8: Global Thermal Spray Materials Market Volume K Tons Forecast, by End-user Industry 2019 & 2032
- Table 9: Global Thermal Spray Materials Market Revenue Million Forecast, by Region 2019 & 2032
- Table 10: Global Thermal Spray Materials Market Volume K Tons Forecast, by Region 2019 & 2032
- Table 11: Global Thermal Spray Materials Market Revenue Million Forecast, by Country 2019 & 2032
- Table 12: Global Thermal Spray Materials Market Volume K Tons Forecast, by Country 2019 & 2032
- Table 13: China Thermal Spray Materials Market Revenue (Million) Forecast, by Application 2019 & 2032
- Table 14: China Thermal Spray Materials Market Volume (K Tons) Forecast, by Application 2019 & 2032
- Table 15: India Thermal Spray Materials Market Revenue (Million) Forecast, by Application 2019 & 2032
- Table 16: India Thermal Spray Materials Market Volume (K Tons) Forecast, by Application 2019 & 2032
- Table 17: Japan Thermal Spray Materials Market Revenue (Million) Forecast, by Application 2019 & 2032
- Table 18: Japan Thermal Spray Materials Market Volume (K Tons) Forecast, by Application 2019 & 2032
- Table 19: South Korea Thermal Spray Materials Market Revenue (Million) Forecast, by Application 2019 & 2032
- Table 20: South Korea Thermal Spray Materials Market Volume (K Tons) Forecast, by Application 2019 & 2032
- Table 21: ASEAN Countries Thermal Spray Materials Market Revenue (Million) Forecast, by Application 2019 & 2032
- Table 22: ASEAN Countries Thermal Spray Materials Market Volume (K Tons) Forecast, by Application 2019 & 2032
- Table 23: Rest of Asia Pacific Thermal Spray Materials Market Revenue (Million) Forecast, by Application 2019 & 2032
- Table 24: Rest of Asia Pacific Thermal Spray Materials Market Volume (K Tons) Forecast, by Application 2019 & 2032
- Table 25: Global Thermal Spray Materials Market Revenue Million Forecast, by Country 2019 & 2032
- Table 26: Global Thermal Spray Materials Market Volume K Tons Forecast, by Country 2019 & 2032
- Table 27: United States Thermal Spray Materials Market Revenue (Million) Forecast, by Application 2019 & 2032
- Table 28: United States Thermal Spray Materials Market Volume (K Tons) Forecast, by Application 2019 & 2032
- Table 29: Canada Thermal Spray Materials Market Revenue (Million) Forecast, by Application 2019 & 2032
- Table 30: Canada Thermal Spray Materials Market Volume (K Tons) Forecast, by Application 2019 & 2032
- Table 31: Mexico Thermal Spray Materials Market Revenue (Million) Forecast, by Application 2019 & 2032
- Table 32: Mexico Thermal Spray Materials Market Volume (K Tons) Forecast, by Application 2019 & 2032
- Table 33: Global Thermal Spray Materials Market Revenue Million Forecast, by Country 2019 & 2032
- Table 34: Global Thermal Spray Materials Market Volume K Tons Forecast, by Country 2019 & 2032
- Table 35: Germany Thermal Spray Materials Market Revenue (Million) Forecast, by Application 2019 & 2032
- Table 36: Germany Thermal Spray Materials Market Volume (K Tons) Forecast, by Application 2019 & 2032
- Table 37: United Kingdom Thermal Spray Materials Market Revenue (Million) Forecast, by Application 2019 & 2032
- Table 38: United Kingdom Thermal Spray Materials Market Volume (K Tons) Forecast, by Application 2019 & 2032
- Table 39: France Thermal Spray Materials Market Revenue (Million) Forecast, by Application 2019 & 2032
- Table 40: France Thermal Spray Materials Market Volume (K Tons) Forecast, by Application 2019 & 2032
- Table 41: Italy Thermal Spray Materials Market Revenue (Million) Forecast, by Application 2019 & 2032
- Table 42: Italy Thermal Spray Materials Market Volume (K Tons) Forecast, by Application 2019 & 2032
- Table 43: Rest of Europe Thermal Spray Materials Market Revenue (Million) Forecast, by Application 2019 & 2032
- Table 44: Rest of Europe Thermal Spray Materials Market Volume (K Tons) Forecast, by Application 2019 & 2032
- Table 45: Global Thermal Spray Materials Market Revenue Million Forecast, by Country 2019 & 2032
- Table 46: Global Thermal Spray Materials Market Volume K Tons Forecast, by Country 2019 & 2032
- Table 47: Brazil Thermal Spray Materials Market Revenue (Million) Forecast, by Application 2019 & 2032
- Table 48: Brazil Thermal Spray Materials Market Volume (K Tons) Forecast, by Application 2019 & 2032
- Table 49: Argentina Thermal Spray Materials Market Revenue (Million) Forecast, by Application 2019 & 2032
- Table 50: Argentina Thermal Spray Materials Market Volume (K Tons) Forecast, by Application 2019 & 2032
- Table 51: Rest of South America Thermal Spray Materials Market Revenue (Million) Forecast, by Application 2019 & 2032
- Table 52: Rest of South America Thermal Spray Materials Market Volume (K Tons) Forecast, by Application 2019 & 2032
- Table 53: Global Thermal Spray Materials Market Revenue Million Forecast, by Country 2019 & 2032
- Table 54: Global Thermal Spray Materials Market Volume K Tons Forecast, by Country 2019 & 2032
- Table 55: Saudi Arabia Thermal Spray Materials Market Revenue (Million) Forecast, by Application 2019 & 2032
- Table 56: Saudi Arabia Thermal Spray Materials Market Volume (K Tons) Forecast, by Application 2019 & 2032
- Table 57: South Africa Thermal Spray Materials Market Revenue (Million) Forecast, by Application 2019 & 2032
- Table 58: South Africa Thermal Spray Materials Market Volume (K Tons) Forecast, by Application 2019 & 2032
- Table 59: Rest of Middle East and Africa Thermal Spray Materials Market Revenue (Million) Forecast, by Application 2019 & 2032
- Table 60: Rest of Middle East and Africa Thermal Spray Materials Market Volume (K Tons) Forecast, by Application 2019 & 2032
- Table 61: Global Thermal Spray Materials Market Revenue Million Forecast, by Product Type 2019 & 2032
- Table 62: Global Thermal Spray Materials Market Volume K Tons Forecast, by Product Type 2019 & 2032
- Table 63: Global Thermal Spray Materials Market Revenue Million Forecast, by Process Type 2019 & 2032
- Table 64: Global Thermal Spray Materials Market Volume K Tons Forecast, by Process Type 2019 & 2032
- Table 65: Global Thermal Spray Materials Market Revenue Million Forecast, by End-user Industry 2019 & 2032
- Table 66: Global Thermal Spray Materials Market Volume K Tons Forecast, by End-user Industry 2019 & 2032
- Table 67: Global Thermal Spray Materials Market Revenue Million Forecast, by Country 2019 & 2032
- Table 68: Global Thermal Spray Materials Market Volume K Tons Forecast, by Country 2019 & 2032
- Table 69: China Thermal Spray Materials Market Revenue (Million) Forecast, by Application 2019 & 2032
- Table 70: China Thermal Spray Materials Market Volume (K Tons) Forecast, by Application 2019 & 2032
- Table 71: India Thermal Spray Materials Market Revenue (Million) Forecast, by Application 2019 & 2032
- Table 72: India Thermal Spray Materials Market Volume (K Tons) Forecast, by Application 2019 & 2032
- Table 73: Japan Thermal Spray Materials Market Revenue (Million) Forecast, by Application 2019 & 2032
- Table 74: Japan Thermal Spray Materials Market Volume (K Tons) Forecast, by Application 2019 & 2032
- Table 75: South Korea Thermal Spray Materials Market Revenue (Million) Forecast, by Application 2019 & 2032
- Table 76: South Korea Thermal Spray Materials Market Volume (K Tons) Forecast, by Application 2019 & 2032
- Table 77: ASEAN Countries Thermal Spray Materials Market Revenue (Million) Forecast, by Application 2019 & 2032
- Table 78: ASEAN Countries Thermal Spray Materials Market Volume (K Tons) Forecast, by Application 2019 & 2032
- Table 79: Rest of Asia Pacific Thermal Spray Materials Market Revenue (Million) Forecast, by Application 2019 & 2032
- Table 80: Rest of Asia Pacific Thermal Spray Materials Market Volume (K Tons) Forecast, by Application 2019 & 2032
- Table 81: Global Thermal Spray Materials Market Revenue Million Forecast, by Product Type 2019 & 2032
- Table 82: Global Thermal Spray Materials Market Volume K Tons Forecast, by Product Type 2019 & 2032
- Table 83: Global Thermal Spray Materials Market Revenue Million Forecast, by Process Type 2019 & 2032
- Table 84: Global Thermal Spray Materials Market Volume K Tons Forecast, by Process Type 2019 & 2032
- Table 85: Global Thermal Spray Materials Market Revenue Million Forecast, by End-user Industry 2019 & 2032
- Table 86: Global Thermal Spray Materials Market Volume K Tons Forecast, by End-user Industry 2019 & 2032
- Table 87: Global Thermal Spray Materials Market Revenue Million Forecast, by Country 2019 & 2032
- Table 88: Global Thermal Spray Materials Market Volume K Tons Forecast, by Country 2019 & 2032
- Table 89: United States Thermal Spray Materials Market Revenue (Million) Forecast, by Application 2019 & 2032
- Table 90: United States Thermal Spray Materials Market Volume (K Tons) Forecast, by Application 2019 & 2032
- Table 91: Canada Thermal Spray Materials Market Revenue (Million) Forecast, by Application 2019 & 2032
- Table 92: Canada Thermal Spray Materials Market Volume (K Tons) Forecast, by Application 2019 & 2032
- Table 93: Mexico Thermal Spray Materials Market Revenue (Million) Forecast, by Application 2019 & 2032
- Table 94: Mexico Thermal Spray Materials Market Volume (K Tons) Forecast, by Application 2019 & 2032
- Table 95: Global Thermal Spray Materials Market Revenue Million Forecast, by Product Type 2019 & 2032
- Table 96: Global Thermal Spray Materials Market Volume K Tons Forecast, by Product Type 2019 & 2032
- Table 97: Global Thermal Spray Materials Market Revenue Million Forecast, by Process Type 2019 & 2032
- Table 98: Global Thermal Spray Materials Market Volume K Tons Forecast, by Process Type 2019 & 2032
- Table 99: Global Thermal Spray Materials Market Revenue Million Forecast, by End-user Industry 2019 & 2032
- Table 100: Global Thermal Spray Materials Market Volume K Tons Forecast, by End-user Industry 2019 & 2032
- Table 101: Global Thermal Spray Materials Market Revenue Million Forecast, by Country 2019 & 2032
- Table 102: Global Thermal Spray Materials Market Volume K Tons Forecast, by Country 2019 & 2032
- Table 103: Germany Thermal Spray Materials Market Revenue (Million) Forecast, by Application 2019 & 2032
- Table 104: Germany Thermal Spray Materials Market Volume (K Tons) Forecast, by Application 2019 & 2032
- Table 105: United Kingdom Thermal Spray Materials Market Revenue (Million) Forecast, by Application 2019 & 2032
- Table 106: United Kingdom Thermal Spray Materials Market Volume (K Tons) Forecast, by Application 2019 & 2032
- Table 107: France Thermal Spray Materials Market Revenue (Million) Forecast, by Application 2019 & 2032
- Table 108: France Thermal Spray Materials Market Volume (K Tons) Forecast, by Application 2019 & 2032
- Table 109: Italy Thermal Spray Materials Market Revenue (Million) Forecast, by Application 2019 & 2032
- Table 110: Italy Thermal Spray Materials Market Volume (K Tons) Forecast, by Application 2019 & 2032
- Table 111: Rest of Europe Thermal Spray Materials Market Revenue (Million) Forecast, by Application 2019 & 2032
- Table 112: Rest of Europe Thermal Spray Materials Market Volume (K Tons) Forecast, by Application 2019 & 2032
- Table 113: Global Thermal Spray Materials Market Revenue Million Forecast, by Product Type 2019 & 2032
- Table 114: Global Thermal Spray Materials Market Volume K Tons Forecast, by Product Type 2019 & 2032
- Table 115: Global Thermal Spray Materials Market Revenue Million Forecast, by Process Type 2019 & 2032
- Table 116: Global Thermal Spray Materials Market Volume K Tons Forecast, by Process Type 2019 & 2032
- Table 117: Global Thermal Spray Materials Market Revenue Million Forecast, by End-user Industry 2019 & 2032
- Table 118: Global Thermal Spray Materials Market Volume K Tons Forecast, by End-user Industry 2019 & 2032
- Table 119: Global Thermal Spray Materials Market Revenue Million Forecast, by Country 2019 & 2032
- Table 120: Global Thermal Spray Materials Market Volume K Tons Forecast, by Country 2019 & 2032
- Table 121: Brazil Thermal Spray Materials Market Revenue (Million) Forecast, by Application 2019 & 2032
- Table 122: Brazil Thermal Spray Materials Market Volume (K Tons) Forecast, by Application 2019 & 2032
- Table 123: Argentina Thermal Spray Materials Market Revenue (Million) Forecast, by Application 2019 & 2032
- Table 124: Argentina Thermal Spray Materials Market Volume (K Tons) Forecast, by Application 2019 & 2032
- Table 125: Rest of South America Thermal Spray Materials Market Revenue (Million) Forecast, by Application 2019 & 2032
- Table 126: Rest of South America Thermal Spray Materials Market Volume (K Tons) Forecast, by Application 2019 & 2032
- Table 127: Global Thermal Spray Materials Market Revenue Million Forecast, by Product Type 2019 & 2032
- Table 128: Global Thermal Spray Materials Market Volume K Tons Forecast, by Product Type 2019 & 2032
- Table 129: Global Thermal Spray Materials Market Revenue Million Forecast, by Process Type 2019 & 2032
- Table 130: Global Thermal Spray Materials Market Volume K Tons Forecast, by Process Type 2019 & 2032
- Table 131: Global Thermal Spray Materials Market Revenue Million Forecast, by End-user Industry 2019 & 2032
- Table 132: Global Thermal Spray Materials Market Volume K Tons Forecast, by End-user Industry 2019 & 2032
- Table 133: Global Thermal Spray Materials Market Revenue Million Forecast, by Country 2019 & 2032
- Table 134: Global Thermal Spray Materials Market Volume K Tons Forecast, by Country 2019 & 2032
- Table 135: Saudi Arabia Thermal Spray Materials Market Revenue (Million) Forecast, by Application 2019 & 2032
- Table 136: Saudi Arabia Thermal Spray Materials Market Volume (K Tons) Forecast, by Application 2019 & 2032
- Table 137: South Africa Thermal Spray Materials Market Revenue (Million) Forecast, by Application 2019 & 2032
- Table 138: South Africa Thermal Spray Materials Market Volume (K Tons) Forecast, by Application 2019 & 2032
- Table 139: Rest of Middle East and Africa Thermal Spray Materials Market Revenue (Million) Forecast, by Application 2019 & 2032
- Table 140: Rest of Middle East and Africa Thermal Spray Materials Market Volume (K Tons) Forecast, by Application 2019 & 2032
Frequently Asked Questions
1. What is the projected Compound Annual Growth Rate (CAGR) of the Thermal Spray Materials Market?
The projected CAGR is approximately 5.04%.
2. Which companies are prominent players in the Thermal Spray Materials Market?
Key companies in the market include Linde PLC, Aisher APM LLC, Saint-Gobain, Hoganas AB, Polymet Corporation, Castolin Eutectic, Metallisation Limited, OC Oerlikon Management AG, LSN Diffusion Ltd, Sandvik AB, Metallizing Equipment Co Pvt Ltd, Ametek Inc, Global Tungsten & Powders Corp, Hunter Chemical LLC, Aimtek Inc, C&M Technologies GmbH, Thermion*List Not Exhaustive, CenterLine (Windsor) Limited, HAI Inc, HC Starck GmbH, CRS Holdings Inc, Fisher Barton, Kennametal Stellite, Powder Alloy Corporation.
3. What are the main segments of the Thermal Spray Materials Market?
The market segments include Product Type, Process Type, End-user Industry.
4. Can you provide details about the market size?
The market size is estimated to be USD 2.09 Million as of 2022.
5. What are some drivers contributing to market growth?
Increasing Usage of Thermal Spray Coating in Medical Device Manufacturing; Rising Demand of Thermal Spray Ceramic Coatings; Extensive Consumption in Anti-corrosion Applications; Evolution in the Asia-Pacific Wind Power Sector.
6. What are the notable trends driving market growth?
Aerospace Industry to Dominate the Market.
7. Are there any restraints impacting market growth?
Emergence of Alternate Substitutes.
8. Can you provide examples of recent developments in the market?
In August 2022, Hogenas divested its binder-jetting AM technology producer (Digital Metal). This position will strengthen the company's work for increased investments and acquisitions in the metal powder space.
9. What pricing options are available for accessing the report?
Pricing options include single-user, multi-user, and enterprise licenses priced at USD 4750, USD 5250, and USD 8750 respectively.
10. Is the market size provided in terms of value or volume?
The market size is provided in terms of value, measured in Million and volume, measured in K Tons.
11. Are there any specific market keywords associated with the report?
Yes, the market keyword associated with the report is "Thermal Spray Materials Market," which aids in identifying and referencing the specific market segment covered.
12. How do I determine which pricing option suits my needs best?
The pricing options vary based on user requirements and access needs. Individual users may opt for single-user licenses, while businesses requiring broader access may choose multi-user or enterprise licenses for cost-effective access to the report.
13. Are there any additional resources or data provided in the Thermal Spray Materials Market report?
While the report offers comprehensive insights, it's advisable to review the specific contents or supplementary materials provided to ascertain if additional resources or data are available.
14. How can I stay updated on further developments or reports in the Thermal Spray Materials Market?
To stay informed about further developments, trends, and reports in the Thermal Spray Materials Market, consider subscribing to industry newsletters, following relevant companies and organizations, or regularly checking reputable industry news sources and publications.
Methodology
Step 1 - Identification of Relevant Samples Size from Population Database


Step 2 - Approaches for Defining Global Market Size (Value, Volume* & Price*)

Note*: In applicable scenarios
Step 3 - Data Sources
Primary Research
- Web Analytics
- Survey Reports
- Research Institute
- Latest Research Reports
- Opinion Leaders
Secondary Research
- Annual Reports
- White Paper
- Latest Press Release
- Industry Association
- Paid Database
- Investor Presentations

Step 4 - Data Triangulation
Involves using different sources of information in order to increase the validity of a study
These sources are likely to be stakeholders in a program - participants, other researchers, program staff, other community members, and so on.
Then we put all data in single framework & apply various statistical tools to find out the dynamic on the market.
During the analysis stage, feedback from the stakeholder groups would be compared to determine areas of agreement as well as areas of divergence


