

Key Insights
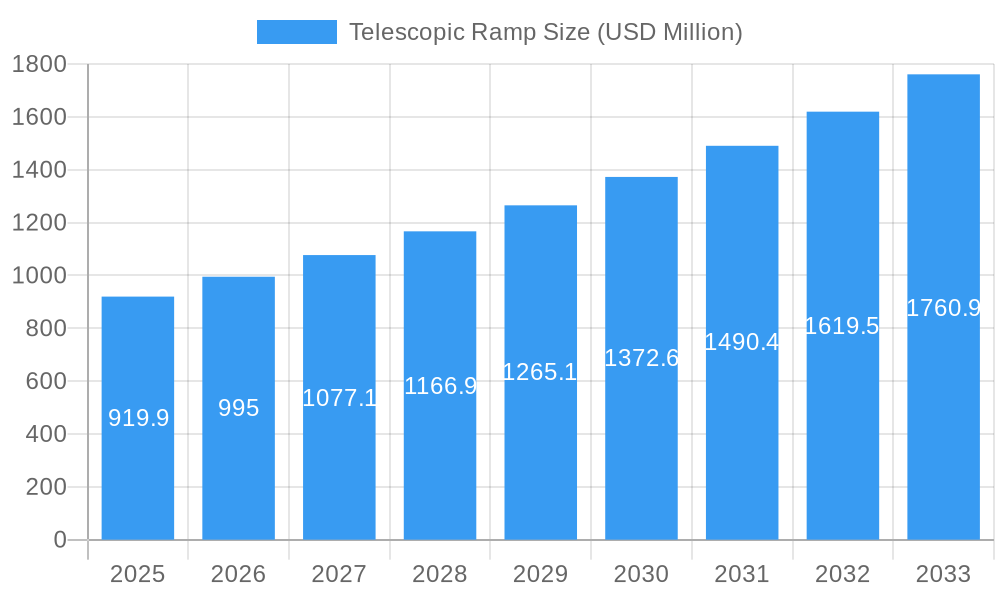
The global telescopic ramp market is poised for significant expansion, projected to reach an estimated $919.9 million in 2025. This growth is fueled by increasing demand for accessibility solutions across various transportation sectors, particularly in public transportation and passenger vehicles. The market is expected to witness a healthy Compound Annual Growth Rate (CAGR) of 8.1% from 2025 through 2033, indicating a robust upward trajectory. Key drivers for this expansion include government mandates and regulations promoting universal design and accessibility for individuals with disabilities, as well as the growing awareness and adoption of these technologies by vehicle manufacturers. The increasing focus on enhancing passenger experience and safety in buses and cars further contributes to the demand for advanced ramp solutions.
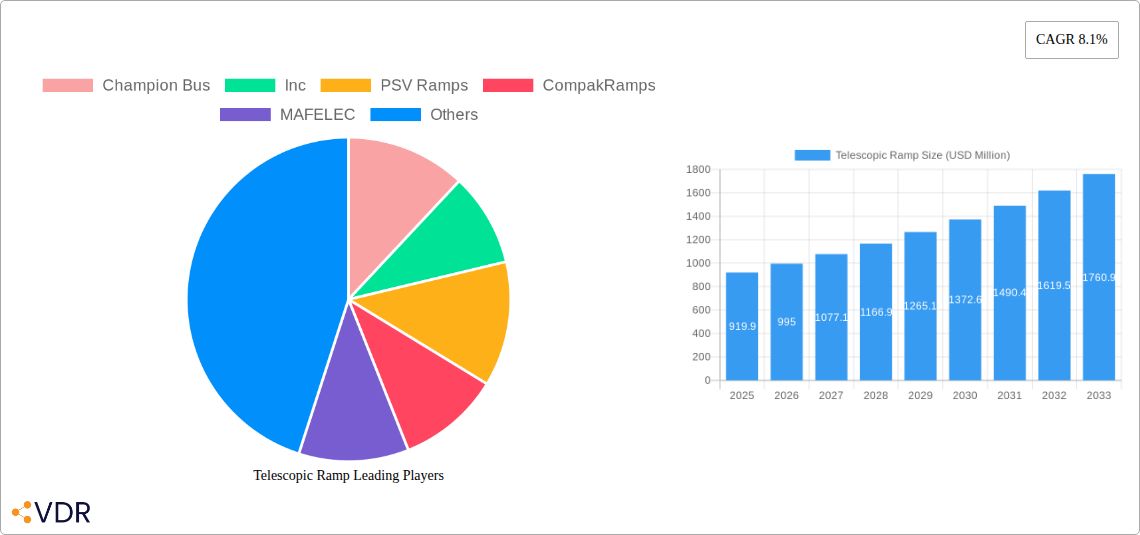
Telescopic Ramp Market Size (In Million)
The market's segmentation into applications like buses, passenger cars, and others, alongside types such as manual ramps, electric ramps, and folding ramps, highlights the diverse needs and preferences of end-users. Electric and folding ramp technologies are expected to gain traction due to their convenience and ease of operation, especially in compact spaces. Geographically, regions like Asia Pacific, driven by rapid urbanization and infrastructure development in countries like China and India, are anticipated to be major growth contributors. North America and Europe, with their established accessibility standards and a strong emphasis on inclusive transportation, will continue to hold substantial market share. Emerging trends include the integration of smart technologies for improved safety and user feedback, and the development of lighter, more durable materials to enhance product performance and cost-effectiveness. While the market shows strong growth potential, challenges such as the initial cost of advanced electric ramp systems and the need for standardized installation protocols across different vehicle models could present some restraints.
Telescopic Ramp Company Market Share
Telescopic Ramp Market Dynamics & Structure
The global telescopic ramp market is characterized by a moderately concentrated competitive landscape, with key players like Champion Bus, Inc., PSV Ramps, CompakRamps, MAFELEC, Crestline Coach Ltd, Xinfa Airport Equipment Ltd, Passenger Lift Services, Calmo Inc, and HÜBNER TRANSPORTATION GmbH vying for market share. Technological innovation, particularly in the development of lighter, more durable, and automated ramps, serves as a significant driver of market expansion. Regulatory frameworks mandating accessibility standards for public transportation and passenger vehicles are also crucial in shaping market dynamics, ensuring a steady demand for compliant solutions.
- Market Concentration: Top 5 players hold approximately 55% market share in 2025.
- Technological Innovation: Advancements in lightweight materials (e.g., carbon fiber composites) and smart deployment systems are key.
- Regulatory Frameworks: ADA (Americans with Disabilities Act) and similar global mandates are strong growth drivers.
- Competitive Product Substitutes: While direct substitutes are limited, the efficiency of traditional boarding methods in certain niche applications presents a mild competitive pressure.
- End-User Demographics: Growing elderly populations and increasing awareness of disability rights are expanding the user base.
- M&A Trends: Consolidation activities are observed as larger players acquire innovative smaller firms to enhance product portfolios and market reach. Potential M&A deal volume projected at 5-8 deals worth over $50 million annually during the forecast period.
Telescopic Ramp Growth Trends & Insights
The global telescopic ramp market is poised for robust growth, driven by an escalating demand for enhanced accessibility in various transportation sectors. The market size is projected to grow from approximately $500 million in 2019 to an estimated $1.2 billion by 2025, with a projected Compound Annual Growth Rate (CAGR) of 15.2% from 2025 to 2033. This significant expansion is fueled by a confluence of factors, including evolving societal attitudes towards inclusivity, stringent government regulations promoting universal design, and continuous technological advancements in ramp functionality and usability.
The adoption rates for telescopic ramps are particularly high in public transportation, where the need to accommodate passengers with mobility challenges is paramount. Bus and coach manufacturers are increasingly integrating these systems as standard features, recognizing their critical role in passenger satisfaction and regulatory compliance. Furthermore, the passenger car segment, especially for specialized mobility vehicles, is witnessing a surge in demand for compact and easy-to-deploy telescopic ramps. The "Others" application segment, encompassing areas like RVs and emergency vehicles, also presents significant untapped potential, with growing awareness of the benefits of portable and efficient boarding solutions.
Technological disruptions are playing a pivotal role in shaping consumer preferences and market trends. The shift from manual to electric and automated telescopic ramps is a prominent trend, offering greater convenience and ease of use for both operators and passengers. Innovations in smart deployment systems, voice activation, and integrated safety features are further enhancing the appeal of these products. Consumer behavior is also evolving, with a greater emphasis placed on safety, reliability, and seamless integration of accessibility features. This shift necessitates manufacturers to focus on user-centric designs and superior performance metrics. The market penetration of telescopic ramps in the bus segment is estimated to reach 70% by 2033, up from approximately 45% in 2025.
Dominant Regions, Countries, or Segments in Telescopic Ramp
The Bus application segment is currently the dominant force driving growth within the global telescopic ramp market, and is projected to maintain this leadership position throughout the forecast period. This dominance is underpinned by a confluence of critical factors, including stringent regulatory mandates for public transportation accessibility, a substantial existing fleet of buses requiring retrofitting or upgrade, and the continuous expansion of public transportation networks worldwide. The increasing global emphasis on passenger comfort and safety further bolsters the demand for efficient and reliable boarding solutions like telescopic ramps in this sector.
- Bus Application Dominance: Expected to account for over 60% of the total market revenue by 2033.
- Key Drivers in Bus Segment:
- Regulatory Mandates: Legislation like the Americans with Disabilities Act (ADA) in the US and similar directives across Europe and Asia mandate accessibility for public transport vehicles.
- Fleet Modernization: Ongoing upgrades and replacements of public bus fleets create continuous demand for integrated or retrofitted accessibility solutions.
- Passenger Experience: Enhanced passenger comfort and convenience for individuals with mobility impairments are key purchasing drivers for operators.
- Infrastructure Development: Expansion of urban public transport systems necessitates accessible vehicle solutions.
- Market Share and Growth Potential: The bus segment is estimated to have a market share of approximately $720 million in 2025, with a projected CAGR of 16.5% through 2033. This segment demonstrates high growth potential due to the large volume of vehicle sales and the consistent need for maintenance and upgrades.
While the bus segment leads, the Electric Ramp type is rapidly emerging as a significant growth accelerator, challenging the traditional dominance of manual systems. The convenience, speed, and reduced physical effort associated with electric ramps are highly attractive to both operators and end-users. This technological shift is particularly prominent in the premium bus and coach segments, as well as in specialized passenger car applications.
- Electric Ramp Growth: Projected to capture over 45% of the market share by 2033, up from approximately 25% in 2025.
- Drivers for Electric Ramp Adoption:
- Ease of Use: Significant reduction in operational effort, crucial for drivers and caregivers.
- Speed and Efficiency: Faster deployment and retraction times improve passenger throughput and operational efficiency.
- Technological Advancements: Integration with vehicle control systems and smart features enhances usability.
- Demand for Premium Features: Growing consumer expectation for advanced and convenient mobility solutions.
- Market Share and Growth Potential: The electric ramp segment is estimated to be valued at $300 million in 2025, with an anticipated CAGR of 18.0% during the forecast period. This segment represents a key area for innovation and market expansion.
The North America region is a dominant market for telescopic ramps, driven by strong regulatory enforcement, high disposable incomes, and a significant aging population.
- North America's Dominance: Expected to hold over 35% of the global market share in 2025.
- Key Drivers in North America:
- Strict Accessibility Laws: Proactive enforcement of ADA and other regional accessibility regulations.
- Aging Population: A demographic trend leading to increased demand for mobility aids and accessible transportation.
- Technological Adoption: High receptiveness to advanced and automated solutions.
- Robust Public Transportation Infrastructure: Significant investment in public transit systems.
- Market Share and Growth Potential: The North American market is estimated to be valued at $175 million in 2025, with a projected CAGR of 14.5% through 2033.
Telescopic Ramp Product Landscape
The telescopic ramp market is witnessing a surge in product innovation focused on enhancing user experience and operational efficiency. Manufacturers are developing lighter, more robust ramps utilizing advanced materials like aluminum alloys and carbon fiber composites. Key product advancements include integrated safety sensors, automated deployment/retraction systems with remote controls, and customizable platform sizes to suit diverse vehicle types and passenger needs. Performance metrics such as load capacity (typically ranging from 300kg to over 1000kg), deployment speed (averaging 10-30 seconds for electric models), and corrosion resistance are critical differentiating factors. Unique selling propositions often revolve around ease of installation, minimal maintenance requirements, and seamless integration with vehicle chassis.
Key Drivers, Barriers & Challenges in Telescopic Ramp
Key Drivers: The telescopic ramp market is propelled by significant drivers including stringent global regulations mandating accessibility for public transportation and personal vehicles, an increasing aging population requiring enhanced mobility solutions, and growing consumer awareness regarding the importance of inclusivity and independent living. Technological advancements in lightweight materials and automation further enhance product functionality and adoption.
Barriers & Challenges: Despite robust growth, the market faces challenges such as the high initial cost of advanced electric and automated telescopic ramps, which can be a barrier for some end-users and fleet operators. Supply chain disruptions and the fluctuating cost of raw materials can impact manufacturing profitability. Furthermore, the need for specialized installation and maintenance can pose logistical hurdles. Intense competition from alternative, albeit less sophisticated, manual ramps and the existing infrastructure in certain developing regions can also present a restraint.
Emerging Opportunities in Telescopic Ramp
Emerging opportunities in the telescopic ramp sector lie in the expansion of applications beyond traditional public transport. The growing adoption in recreational vehicles (RVs), private mobility vans, and even residential settings for home accessibility presents a significant untapped market. Furthermore, the development of smart ramps with IoT integration for real-time performance monitoring and predictive maintenance offers a novel avenue for service-based revenue streams. Innovation in ultra-lightweight and compact designs for smaller vehicles and emerging markets with rapidly developing infrastructure also represents a key opportunity.
Growth Accelerators in the Telescopic Ramp Industry
The long-term growth of the telescopic ramp industry is being accelerated by several key factors. Continuous technological breakthroughs in areas such as advanced robotics for deployment, AI-powered safety features, and the use of novel composite materials are enhancing product performance and reducing weight. Strategic partnerships between ramp manufacturers and vehicle OEMs are crucial for seamless integration and wider adoption. Furthermore, aggressive market expansion strategies targeting developing economies with growing infrastructure and increasing awareness of accessibility rights are acting as significant growth catalysts. The increasing focus on sustainability and eco-friendly manufacturing processes is also becoming a differentiator.
Key Players Shaping the Telescopic Ramp Market
Champion Bus, Inc. PSV Ramps CompakRamps MAFELEC Crestline Coach Ltd Xinfa Airport Equipment Ltd Passenger Lift Services Calmo Inc HÜBNER TRANSPORTATION GmbH
Notable Milestones in Telescopic Ramp Sector
- 2019: Introduction of advanced electric deployment systems with enhanced safety interlocks.
- 2020: Launch of ultra-lightweight composite telescopic ramps by several key manufacturers.
- 2021: Increased M&A activity, with larger players acquiring innovative start-ups in the accessibility tech space.
- 2022: Development of smart telescopic ramps with IoT capabilities for remote monitoring.
- 2023: Significant regulatory updates in several countries mandating higher accessibility standards for public transport.
- 2024: Focus on modular design for easier installation and maintenance across various vehicle types.
In-Depth Telescopic Ramp Market Outlook
The telescopic ramp market is set for sustained expansion, fueled by a powerful combination of regulatory tailwinds, demographic shifts, and technological innovation. Growth accelerators such as smart integration, lightweight material advancements, and strategic collaborations will continue to drive market penetration. The outlook suggests a dynamic landscape where accessibility is no longer an option but a fundamental requirement, presenting lucrative opportunities for companies investing in advanced, user-centric, and reliable telescopic ramp solutions across diverse applications. The focus will increasingly be on cost-effectiveness without compromising on safety and performance.
Telescopic Ramp Segmentation
-
1. Application
- 1.1. Bus
- 1.2. Passenger Car
- 1.3. Others
-
2. Types
- 2.1. Manual Ramp
- 2.2. Electric Ramp
- 2.3. Folding Ramp
Telescopic Ramp Segmentation By Geography
-
1. North America
- 1.1. United States
- 1.2. Canada
- 1.3. Mexico
-
2. South America
- 2.1. Brazil
- 2.2. Argentina
- 2.3. Rest of South America
-
3. Europe
- 3.1. United Kingdom
- 3.2. Germany
- 3.3. France
- 3.4. Italy
- 3.5. Spain
- 3.6. Russia
- 3.7. Benelux
- 3.8. Nordics
- 3.9. Rest of Europe
-
4. Middle East & Africa
- 4.1. Turkey
- 4.2. Israel
- 4.3. GCC
- 4.4. North Africa
- 4.5. South Africa
- 4.6. Rest of Middle East & Africa
-
5. Asia Pacific
- 5.1. China
- 5.2. India
- 5.3. Japan
- 5.4. South Korea
- 5.5. ASEAN
- 5.6. Oceania
- 5.7. Rest of Asia Pacific
Telescopic Ramp Regional Market Share
Geographic Coverage of Telescopic Ramp
Telescopic Ramp REPORT HIGHLIGHTS
| Aspects | Details |
|---|---|
| Study Period | 2020-2034 |
| Base Year | 2025 |
| Estimated Year | 2026 |
| Forecast Period | 2026-2034 |
| Historical Period | 2020-2025 |
| Growth Rate | CAGR of 8.1% from 2020-2034 |
| Segmentation |
|
Table of Contents
- 1. Introduction
- 1.1. Research Scope
- 1.2. Market Segmentation
- 1.3. Research Methodology
- 1.4. Definitions and Assumptions
- 2. Executive Summary
- 2.1. Introduction
- 3. Market Dynamics
- 3.1. Introduction
- 3.2. Market Drivers
- 3.3. Market Restrains
- 3.4. Market Trends
- 4. Market Factor Analysis
- 4.1. Porters Five Forces
- 4.2. Supply/Value Chain
- 4.3. PESTEL analysis
- 4.4. Market Entropy
- 4.5. Patent/Trademark Analysis
- 5. Global Telescopic Ramp Analysis, Insights and Forecast, 2020-2032
- 5.1. Market Analysis, Insights and Forecast - by Application
- 5.1.1. Bus
- 5.1.2. Passenger Car
- 5.1.3. Others
- 5.2. Market Analysis, Insights and Forecast - by Types
- 5.2.1. Manual Ramp
- 5.2.2. Electric Ramp
- 5.2.3. Folding Ramp
- 5.3. Market Analysis, Insights and Forecast - by Region
- 5.3.1. North America
- 5.3.2. South America
- 5.3.3. Europe
- 5.3.4. Middle East & Africa
- 5.3.5. Asia Pacific
- 5.1. Market Analysis, Insights and Forecast - by Application
- 6. North America Telescopic Ramp Analysis, Insights and Forecast, 2020-2032
- 6.1. Market Analysis, Insights and Forecast - by Application
- 6.1.1. Bus
- 6.1.2. Passenger Car
- 6.1.3. Others
- 6.2. Market Analysis, Insights and Forecast - by Types
- 6.2.1. Manual Ramp
- 6.2.2. Electric Ramp
- 6.2.3. Folding Ramp
- 6.1. Market Analysis, Insights and Forecast - by Application
- 7. South America Telescopic Ramp Analysis, Insights and Forecast, 2020-2032
- 7.1. Market Analysis, Insights and Forecast - by Application
- 7.1.1. Bus
- 7.1.2. Passenger Car
- 7.1.3. Others
- 7.2. Market Analysis, Insights and Forecast - by Types
- 7.2.1. Manual Ramp
- 7.2.2. Electric Ramp
- 7.2.3. Folding Ramp
- 7.1. Market Analysis, Insights and Forecast - by Application
- 8. Europe Telescopic Ramp Analysis, Insights and Forecast, 2020-2032
- 8.1. Market Analysis, Insights and Forecast - by Application
- 8.1.1. Bus
- 8.1.2. Passenger Car
- 8.1.3. Others
- 8.2. Market Analysis, Insights and Forecast - by Types
- 8.2.1. Manual Ramp
- 8.2.2. Electric Ramp
- 8.2.3. Folding Ramp
- 8.1. Market Analysis, Insights and Forecast - by Application
- 9. Middle East & Africa Telescopic Ramp Analysis, Insights and Forecast, 2020-2032
- 9.1. Market Analysis, Insights and Forecast - by Application
- 9.1.1. Bus
- 9.1.2. Passenger Car
- 9.1.3. Others
- 9.2. Market Analysis, Insights and Forecast - by Types
- 9.2.1. Manual Ramp
- 9.2.2. Electric Ramp
- 9.2.3. Folding Ramp
- 9.1. Market Analysis, Insights and Forecast - by Application
- 10. Asia Pacific Telescopic Ramp Analysis, Insights and Forecast, 2020-2032
- 10.1. Market Analysis, Insights and Forecast - by Application
- 10.1.1. Bus
- 10.1.2. Passenger Car
- 10.1.3. Others
- 10.2. Market Analysis, Insights and Forecast - by Types
- 10.2.1. Manual Ramp
- 10.2.2. Electric Ramp
- 10.2.3. Folding Ramp
- 10.1. Market Analysis, Insights and Forecast - by Application
- 11. Competitive Analysis
- 11.1. Global Market Share Analysis 2025
- 11.2. Company Profiles
- 11.2.1 Champion Bus
- 11.2.1.1. Overview
- 11.2.1.2. Products
- 11.2.1.3. SWOT Analysis
- 11.2.1.4. Recent Developments
- 11.2.1.5. Financials (Based on Availability)
- 11.2.2 Inc
- 11.2.2.1. Overview
- 11.2.2.2. Products
- 11.2.2.3. SWOT Analysis
- 11.2.2.4. Recent Developments
- 11.2.2.5. Financials (Based on Availability)
- 11.2.3 PSV Ramps
- 11.2.3.1. Overview
- 11.2.3.2. Products
- 11.2.3.3. SWOT Analysis
- 11.2.3.4. Recent Developments
- 11.2.3.5. Financials (Based on Availability)
- 11.2.4 CompakRamps
- 11.2.4.1. Overview
- 11.2.4.2. Products
- 11.2.4.3. SWOT Analysis
- 11.2.4.4. Recent Developments
- 11.2.4.5. Financials (Based on Availability)
- 11.2.5 MAFELEC
- 11.2.5.1. Overview
- 11.2.5.2. Products
- 11.2.5.3. SWOT Analysis
- 11.2.5.4. Recent Developments
- 11.2.5.5. Financials (Based on Availability)
- 11.2.6 Crestline Coach Ltd
- 11.2.6.1. Overview
- 11.2.6.2. Products
- 11.2.6.3. SWOT Analysis
- 11.2.6.4. Recent Developments
- 11.2.6.5. Financials (Based on Availability)
- 11.2.7 Xinfa Airport Equipment Ltd
- 11.2.7.1. Overview
- 11.2.7.2. Products
- 11.2.7.3. SWOT Analysis
- 11.2.7.4. Recent Developments
- 11.2.7.5. Financials (Based on Availability)
- 11.2.8 Passenger Lift Services
- 11.2.8.1. Overview
- 11.2.8.2. Products
- 11.2.8.3. SWOT Analysis
- 11.2.8.4. Recent Developments
- 11.2.8.5. Financials (Based on Availability)
- 11.2.9 Calmo Inc
- 11.2.9.1. Overview
- 11.2.9.2. Products
- 11.2.9.3. SWOT Analysis
- 11.2.9.4. Recent Developments
- 11.2.9.5. Financials (Based on Availability)
- 11.2.10 HÜBNER TRANSPORTATION GmbH
- 11.2.10.1. Overview
- 11.2.10.2. Products
- 11.2.10.3. SWOT Analysis
- 11.2.10.4. Recent Developments
- 11.2.10.5. Financials (Based on Availability)
- 11.2.1 Champion Bus
List of Figures
- Figure 1: Global Telescopic Ramp Revenue Breakdown (undefined, %) by Region 2025 & 2033
- Figure 2: Global Telescopic Ramp Volume Breakdown (K, %) by Region 2025 & 2033
- Figure 3: North America Telescopic Ramp Revenue (undefined), by Application 2025 & 2033
- Figure 4: North America Telescopic Ramp Volume (K), by Application 2025 & 2033
- Figure 5: North America Telescopic Ramp Revenue Share (%), by Application 2025 & 2033
- Figure 6: North America Telescopic Ramp Volume Share (%), by Application 2025 & 2033
- Figure 7: North America Telescopic Ramp Revenue (undefined), by Types 2025 & 2033
- Figure 8: North America Telescopic Ramp Volume (K), by Types 2025 & 2033
- Figure 9: North America Telescopic Ramp Revenue Share (%), by Types 2025 & 2033
- Figure 10: North America Telescopic Ramp Volume Share (%), by Types 2025 & 2033
- Figure 11: North America Telescopic Ramp Revenue (undefined), by Country 2025 & 2033
- Figure 12: North America Telescopic Ramp Volume (K), by Country 2025 & 2033
- Figure 13: North America Telescopic Ramp Revenue Share (%), by Country 2025 & 2033
- Figure 14: North America Telescopic Ramp Volume Share (%), by Country 2025 & 2033
- Figure 15: South America Telescopic Ramp Revenue (undefined), by Application 2025 & 2033
- Figure 16: South America Telescopic Ramp Volume (K), by Application 2025 & 2033
- Figure 17: South America Telescopic Ramp Revenue Share (%), by Application 2025 & 2033
- Figure 18: South America Telescopic Ramp Volume Share (%), by Application 2025 & 2033
- Figure 19: South America Telescopic Ramp Revenue (undefined), by Types 2025 & 2033
- Figure 20: South America Telescopic Ramp Volume (K), by Types 2025 & 2033
- Figure 21: South America Telescopic Ramp Revenue Share (%), by Types 2025 & 2033
- Figure 22: South America Telescopic Ramp Volume Share (%), by Types 2025 & 2033
- Figure 23: South America Telescopic Ramp Revenue (undefined), by Country 2025 & 2033
- Figure 24: South America Telescopic Ramp Volume (K), by Country 2025 & 2033
- Figure 25: South America Telescopic Ramp Revenue Share (%), by Country 2025 & 2033
- Figure 26: South America Telescopic Ramp Volume Share (%), by Country 2025 & 2033
- Figure 27: Europe Telescopic Ramp Revenue (undefined), by Application 2025 & 2033
- Figure 28: Europe Telescopic Ramp Volume (K), by Application 2025 & 2033
- Figure 29: Europe Telescopic Ramp Revenue Share (%), by Application 2025 & 2033
- Figure 30: Europe Telescopic Ramp Volume Share (%), by Application 2025 & 2033
- Figure 31: Europe Telescopic Ramp Revenue (undefined), by Types 2025 & 2033
- Figure 32: Europe Telescopic Ramp Volume (K), by Types 2025 & 2033
- Figure 33: Europe Telescopic Ramp Revenue Share (%), by Types 2025 & 2033
- Figure 34: Europe Telescopic Ramp Volume Share (%), by Types 2025 & 2033
- Figure 35: Europe Telescopic Ramp Revenue (undefined), by Country 2025 & 2033
- Figure 36: Europe Telescopic Ramp Volume (K), by Country 2025 & 2033
- Figure 37: Europe Telescopic Ramp Revenue Share (%), by Country 2025 & 2033
- Figure 38: Europe Telescopic Ramp Volume Share (%), by Country 2025 & 2033
- Figure 39: Middle East & Africa Telescopic Ramp Revenue (undefined), by Application 2025 & 2033
- Figure 40: Middle East & Africa Telescopic Ramp Volume (K), by Application 2025 & 2033
- Figure 41: Middle East & Africa Telescopic Ramp Revenue Share (%), by Application 2025 & 2033
- Figure 42: Middle East & Africa Telescopic Ramp Volume Share (%), by Application 2025 & 2033
- Figure 43: Middle East & Africa Telescopic Ramp Revenue (undefined), by Types 2025 & 2033
- Figure 44: Middle East & Africa Telescopic Ramp Volume (K), by Types 2025 & 2033
- Figure 45: Middle East & Africa Telescopic Ramp Revenue Share (%), by Types 2025 & 2033
- Figure 46: Middle East & Africa Telescopic Ramp Volume Share (%), by Types 2025 & 2033
- Figure 47: Middle East & Africa Telescopic Ramp Revenue (undefined), by Country 2025 & 2033
- Figure 48: Middle East & Africa Telescopic Ramp Volume (K), by Country 2025 & 2033
- Figure 49: Middle East & Africa Telescopic Ramp Revenue Share (%), by Country 2025 & 2033
- Figure 50: Middle East & Africa Telescopic Ramp Volume Share (%), by Country 2025 & 2033
- Figure 51: Asia Pacific Telescopic Ramp Revenue (undefined), by Application 2025 & 2033
- Figure 52: Asia Pacific Telescopic Ramp Volume (K), by Application 2025 & 2033
- Figure 53: Asia Pacific Telescopic Ramp Revenue Share (%), by Application 2025 & 2033
- Figure 54: Asia Pacific Telescopic Ramp Volume Share (%), by Application 2025 & 2033
- Figure 55: Asia Pacific Telescopic Ramp Revenue (undefined), by Types 2025 & 2033
- Figure 56: Asia Pacific Telescopic Ramp Volume (K), by Types 2025 & 2033
- Figure 57: Asia Pacific Telescopic Ramp Revenue Share (%), by Types 2025 & 2033
- Figure 58: Asia Pacific Telescopic Ramp Volume Share (%), by Types 2025 & 2033
- Figure 59: Asia Pacific Telescopic Ramp Revenue (undefined), by Country 2025 & 2033
- Figure 60: Asia Pacific Telescopic Ramp Volume (K), by Country 2025 & 2033
- Figure 61: Asia Pacific Telescopic Ramp Revenue Share (%), by Country 2025 & 2033
- Figure 62: Asia Pacific Telescopic Ramp Volume Share (%), by Country 2025 & 2033
List of Tables
- Table 1: Global Telescopic Ramp Revenue undefined Forecast, by Application 2020 & 2033
- Table 2: Global Telescopic Ramp Volume K Forecast, by Application 2020 & 2033
- Table 3: Global Telescopic Ramp Revenue undefined Forecast, by Types 2020 & 2033
- Table 4: Global Telescopic Ramp Volume K Forecast, by Types 2020 & 2033
- Table 5: Global Telescopic Ramp Revenue undefined Forecast, by Region 2020 & 2033
- Table 6: Global Telescopic Ramp Volume K Forecast, by Region 2020 & 2033
- Table 7: Global Telescopic Ramp Revenue undefined Forecast, by Application 2020 & 2033
- Table 8: Global Telescopic Ramp Volume K Forecast, by Application 2020 & 2033
- Table 9: Global Telescopic Ramp Revenue undefined Forecast, by Types 2020 & 2033
- Table 10: Global Telescopic Ramp Volume K Forecast, by Types 2020 & 2033
- Table 11: Global Telescopic Ramp Revenue undefined Forecast, by Country 2020 & 2033
- Table 12: Global Telescopic Ramp Volume K Forecast, by Country 2020 & 2033
- Table 13: United States Telescopic Ramp Revenue (undefined) Forecast, by Application 2020 & 2033
- Table 14: United States Telescopic Ramp Volume (K) Forecast, by Application 2020 & 2033
- Table 15: Canada Telescopic Ramp Revenue (undefined) Forecast, by Application 2020 & 2033
- Table 16: Canada Telescopic Ramp Volume (K) Forecast, by Application 2020 & 2033
- Table 17: Mexico Telescopic Ramp Revenue (undefined) Forecast, by Application 2020 & 2033
- Table 18: Mexico Telescopic Ramp Volume (K) Forecast, by Application 2020 & 2033
- Table 19: Global Telescopic Ramp Revenue undefined Forecast, by Application 2020 & 2033
- Table 20: Global Telescopic Ramp Volume K Forecast, by Application 2020 & 2033
- Table 21: Global Telescopic Ramp Revenue undefined Forecast, by Types 2020 & 2033
- Table 22: Global Telescopic Ramp Volume K Forecast, by Types 2020 & 2033
- Table 23: Global Telescopic Ramp Revenue undefined Forecast, by Country 2020 & 2033
- Table 24: Global Telescopic Ramp Volume K Forecast, by Country 2020 & 2033
- Table 25: Brazil Telescopic Ramp Revenue (undefined) Forecast, by Application 2020 & 2033
- Table 26: Brazil Telescopic Ramp Volume (K) Forecast, by Application 2020 & 2033
- Table 27: Argentina Telescopic Ramp Revenue (undefined) Forecast, by Application 2020 & 2033
- Table 28: Argentina Telescopic Ramp Volume (K) Forecast, by Application 2020 & 2033
- Table 29: Rest of South America Telescopic Ramp Revenue (undefined) Forecast, by Application 2020 & 2033
- Table 30: Rest of South America Telescopic Ramp Volume (K) Forecast, by Application 2020 & 2033
- Table 31: Global Telescopic Ramp Revenue undefined Forecast, by Application 2020 & 2033
- Table 32: Global Telescopic Ramp Volume K Forecast, by Application 2020 & 2033
- Table 33: Global Telescopic Ramp Revenue undefined Forecast, by Types 2020 & 2033
- Table 34: Global Telescopic Ramp Volume K Forecast, by Types 2020 & 2033
- Table 35: Global Telescopic Ramp Revenue undefined Forecast, by Country 2020 & 2033
- Table 36: Global Telescopic Ramp Volume K Forecast, by Country 2020 & 2033
- Table 37: United Kingdom Telescopic Ramp Revenue (undefined) Forecast, by Application 2020 & 2033
- Table 38: United Kingdom Telescopic Ramp Volume (K) Forecast, by Application 2020 & 2033
- Table 39: Germany Telescopic Ramp Revenue (undefined) Forecast, by Application 2020 & 2033
- Table 40: Germany Telescopic Ramp Volume (K) Forecast, by Application 2020 & 2033
- Table 41: France Telescopic Ramp Revenue (undefined) Forecast, by Application 2020 & 2033
- Table 42: France Telescopic Ramp Volume (K) Forecast, by Application 2020 & 2033
- Table 43: Italy Telescopic Ramp Revenue (undefined) Forecast, by Application 2020 & 2033
- Table 44: Italy Telescopic Ramp Volume (K) Forecast, by Application 2020 & 2033
- Table 45: Spain Telescopic Ramp Revenue (undefined) Forecast, by Application 2020 & 2033
- Table 46: Spain Telescopic Ramp Volume (K) Forecast, by Application 2020 & 2033
- Table 47: Russia Telescopic Ramp Revenue (undefined) Forecast, by Application 2020 & 2033
- Table 48: Russia Telescopic Ramp Volume (K) Forecast, by Application 2020 & 2033
- Table 49: Benelux Telescopic Ramp Revenue (undefined) Forecast, by Application 2020 & 2033
- Table 50: Benelux Telescopic Ramp Volume (K) Forecast, by Application 2020 & 2033
- Table 51: Nordics Telescopic Ramp Revenue (undefined) Forecast, by Application 2020 & 2033
- Table 52: Nordics Telescopic Ramp Volume (K) Forecast, by Application 2020 & 2033
- Table 53: Rest of Europe Telescopic Ramp Revenue (undefined) Forecast, by Application 2020 & 2033
- Table 54: Rest of Europe Telescopic Ramp Volume (K) Forecast, by Application 2020 & 2033
- Table 55: Global Telescopic Ramp Revenue undefined Forecast, by Application 2020 & 2033
- Table 56: Global Telescopic Ramp Volume K Forecast, by Application 2020 & 2033
- Table 57: Global Telescopic Ramp Revenue undefined Forecast, by Types 2020 & 2033
- Table 58: Global Telescopic Ramp Volume K Forecast, by Types 2020 & 2033
- Table 59: Global Telescopic Ramp Revenue undefined Forecast, by Country 2020 & 2033
- Table 60: Global Telescopic Ramp Volume K Forecast, by Country 2020 & 2033
- Table 61: Turkey Telescopic Ramp Revenue (undefined) Forecast, by Application 2020 & 2033
- Table 62: Turkey Telescopic Ramp Volume (K) Forecast, by Application 2020 & 2033
- Table 63: Israel Telescopic Ramp Revenue (undefined) Forecast, by Application 2020 & 2033
- Table 64: Israel Telescopic Ramp Volume (K) Forecast, by Application 2020 & 2033
- Table 65: GCC Telescopic Ramp Revenue (undefined) Forecast, by Application 2020 & 2033
- Table 66: GCC Telescopic Ramp Volume (K) Forecast, by Application 2020 & 2033
- Table 67: North Africa Telescopic Ramp Revenue (undefined) Forecast, by Application 2020 & 2033
- Table 68: North Africa Telescopic Ramp Volume (K) Forecast, by Application 2020 & 2033
- Table 69: South Africa Telescopic Ramp Revenue (undefined) Forecast, by Application 2020 & 2033
- Table 70: South Africa Telescopic Ramp Volume (K) Forecast, by Application 2020 & 2033
- Table 71: Rest of Middle East & Africa Telescopic Ramp Revenue (undefined) Forecast, by Application 2020 & 2033
- Table 72: Rest of Middle East & Africa Telescopic Ramp Volume (K) Forecast, by Application 2020 & 2033
- Table 73: Global Telescopic Ramp Revenue undefined Forecast, by Application 2020 & 2033
- Table 74: Global Telescopic Ramp Volume K Forecast, by Application 2020 & 2033
- Table 75: Global Telescopic Ramp Revenue undefined Forecast, by Types 2020 & 2033
- Table 76: Global Telescopic Ramp Volume K Forecast, by Types 2020 & 2033
- Table 77: Global Telescopic Ramp Revenue undefined Forecast, by Country 2020 & 2033
- Table 78: Global Telescopic Ramp Volume K Forecast, by Country 2020 & 2033
- Table 79: China Telescopic Ramp Revenue (undefined) Forecast, by Application 2020 & 2033
- Table 80: China Telescopic Ramp Volume (K) Forecast, by Application 2020 & 2033
- Table 81: India Telescopic Ramp Revenue (undefined) Forecast, by Application 2020 & 2033
- Table 82: India Telescopic Ramp Volume (K) Forecast, by Application 2020 & 2033
- Table 83: Japan Telescopic Ramp Revenue (undefined) Forecast, by Application 2020 & 2033
- Table 84: Japan Telescopic Ramp Volume (K) Forecast, by Application 2020 & 2033
- Table 85: South Korea Telescopic Ramp Revenue (undefined) Forecast, by Application 2020 & 2033
- Table 86: South Korea Telescopic Ramp Volume (K) Forecast, by Application 2020 & 2033
- Table 87: ASEAN Telescopic Ramp Revenue (undefined) Forecast, by Application 2020 & 2033
- Table 88: ASEAN Telescopic Ramp Volume (K) Forecast, by Application 2020 & 2033
- Table 89: Oceania Telescopic Ramp Revenue (undefined) Forecast, by Application 2020 & 2033
- Table 90: Oceania Telescopic Ramp Volume (K) Forecast, by Application 2020 & 2033
- Table 91: Rest of Asia Pacific Telescopic Ramp Revenue (undefined) Forecast, by Application 2020 & 2033
- Table 92: Rest of Asia Pacific Telescopic Ramp Volume (K) Forecast, by Application 2020 & 2033
Frequently Asked Questions
1. What is the projected Compound Annual Growth Rate (CAGR) of the Telescopic Ramp?
The projected CAGR is approximately 8.1%.
2. Which companies are prominent players in the Telescopic Ramp?
Key companies in the market include Champion Bus, Inc, PSV Ramps, CompakRamps, MAFELEC, Crestline Coach Ltd, Xinfa Airport Equipment Ltd, Passenger Lift Services, Calmo Inc, HÜBNER TRANSPORTATION GmbH.
3. What are the main segments of the Telescopic Ramp?
The market segments include Application, Types.
4. Can you provide details about the market size?
The market size is estimated to be USD XXX N/A as of 2022.
5. What are some drivers contributing to market growth?
N/A
6. What are the notable trends driving market growth?
N/A
7. Are there any restraints impacting market growth?
N/A
8. Can you provide examples of recent developments in the market?
N/A
9. What pricing options are available for accessing the report?
Pricing options include single-user, multi-user, and enterprise licenses priced at USD 3950.00, USD 5925.00, and USD 7900.00 respectively.
10. Is the market size provided in terms of value or volume?
The market size is provided in terms of value, measured in N/A and volume, measured in K.
11. Are there any specific market keywords associated with the report?
Yes, the market keyword associated with the report is "Telescopic Ramp," which aids in identifying and referencing the specific market segment covered.
12. How do I determine which pricing option suits my needs best?
The pricing options vary based on user requirements and access needs. Individual users may opt for single-user licenses, while businesses requiring broader access may choose multi-user or enterprise licenses for cost-effective access to the report.
13. Are there any additional resources or data provided in the Telescopic Ramp report?
While the report offers comprehensive insights, it's advisable to review the specific contents or supplementary materials provided to ascertain if additional resources or data are available.
14. How can I stay updated on further developments or reports in the Telescopic Ramp?
To stay informed about further developments, trends, and reports in the Telescopic Ramp, consider subscribing to industry newsletters, following relevant companies and organizations, or regularly checking reputable industry news sources and publications.
Methodology
Step 1 - Identification of Relevant Samples Size from Population Database


Step 2 - Approaches for Defining Global Market Size (Value, Volume* & Price*)

Note*: In applicable scenarios
Step 3 - Data Sources
Primary Research
- Web Analytics
- Survey Reports
- Research Institute
- Latest Research Reports
- Opinion Leaders
Secondary Research
- Annual Reports
- White Paper
- Latest Press Release
- Industry Association
- Paid Database
- Investor Presentations

Step 4 - Data Triangulation
Involves using different sources of information in order to increase the validity of a study
These sources are likely to be stakeholders in a program - participants, other researchers, program staff, other community members, and so on.
Then we put all data in single framework & apply various statistical tools to find out the dynamic on the market.
During the analysis stage, feedback from the stakeholder groups would be compared to determine areas of agreement as well as areas of divergence