
Key Insights
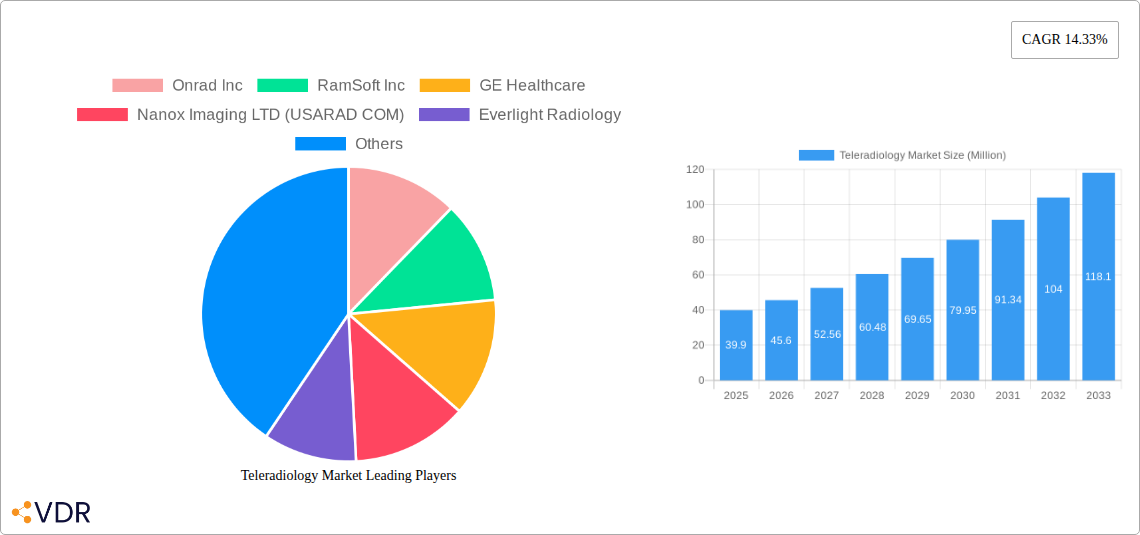
The teleradiology market, valued at $39.90 million in 2025, is projected to experience robust growth, driven by several key factors. The increasing prevalence of chronic diseases requiring frequent imaging, coupled with a global shortage of radiologists, fuels the demand for remote image interpretation services. Technological advancements, such as improved image quality through high-resolution scanners and faster internet speeds enabling seamless data transmission, are further accelerating market expansion. The integration of artificial intelligence (AI) in image analysis promises to enhance diagnostic accuracy and efficiency, leading to improved patient outcomes and workflow optimization for radiology departments. Growth is particularly strong in regions with limited access to specialized healthcare professionals, such as rural areas and developing nations. The market is segmented by component (hardware and software), end-user (hospitals, diagnostic centers, and other end-users), and imaging technique (X-rays, CT, ultrasound, MRI, nuclear imaging, and others). Each segment contributes uniquely to the overall market size and growth trajectory, with the software segment anticipated to show faster growth due to continuous innovation in AI-powered diagnostic tools and image management systems. Hospitals currently hold the largest market share among end users due to the high volume of imaging procedures performed.
Competitive dynamics within the teleradiology market are intense, with established players like GE Healthcare and Philips competing alongside emerging technology providers and specialized teleradiology service companies. Companies are focusing on strategic partnerships, acquisitions, and technological innovations to enhance their market positions. The market also faces certain restraints, such as concerns over data security and patient privacy, especially during data transmission and storage. Regulatory compliance and interoperability challenges across different healthcare systems also pose barriers to market expansion. However, ongoing efforts to establish robust security protocols and data protection frameworks, coupled with increasing regulatory support for telehealth, are expected to mitigate these challenges in the coming years. The forecast period (2025-2033) anticipates continued growth, with a projected CAGR significantly influenced by technological advancements and increasing healthcare expenditure globally.
Teleradiology Market Report: 2019-2033
This comprehensive report provides a detailed analysis of the Teleradiology market, encompassing market dynamics, growth trends, regional segmentation, product landscape, key players, and future outlook. The study period covers 2019-2033, with 2025 as the base and estimated year. This report is invaluable for industry professionals, investors, and stakeholders seeking a deep understanding of this rapidly evolving sector. The parent market is the broader Telehealth market, and this report delves into the specialized niche of teleradiology, providing detailed insights into its components, end-users, and imaging techniques.
Teleradiology Market Dynamics & Structure
The global teleradiology market is experiencing significant growth, driven by technological advancements, increasing demand for remote healthcare services, and favorable regulatory environments. The market structure is moderately fragmented, with several key players competing intensely. Market concentration is expected to decrease slightly over the forecast period due to continued technological innovation and increased entry of smaller players.
Market Concentration: The market exhibits moderate concentration, with the top 5 players holding an estimated xx% market share in 2025. This is anticipated to fall to xx% by 2033.
Technological Innovation: Advancements in AI, high-speed internet, and image processing technology are pivotal drivers. Barriers to innovation include high initial investment costs for advanced technologies, cybersecurity concerns, and the need for robust data infrastructure.
Regulatory Frameworks: Varying regulatory landscapes across different regions pose both opportunities and challenges. Streamlined regulations in certain regions accelerate market growth, while complex regulatory hurdles in others could impede adoption.
Competitive Product Substitutes: The primary substitute is in-person radiology services. However, teleradiology's convenience and cost-effectiveness is driving its adoption, particularly in underserved areas.
End-User Demographics: The market is primarily driven by hospitals and diagnostic centers, but growth is also seen in other end-users like private clinics and mobile health services. The aging global population and increase in chronic diseases are key demographic drivers.
M&A Trends: The number of M&A deals in the teleradiology market is estimated to be xx in 2025, projected to rise to xx by 2033. This reflects the market’s consolidation and the strategic moves of larger players to expand their market share.
Teleradiology Market Growth Trends & Insights
The global teleradiology market size is expected to reach xx million in 2025 and grow at a CAGR of xx% from 2025 to 2033, reaching xx million by 2033. This growth is fueled by the rising prevalence of chronic diseases, an aging population, increasing demand for efficient healthcare solutions, technological advancements, and expanding government support for telehealth initiatives. The market penetration rate for teleradiology is projected to increase from xx% in 2025 to xx% by 2033. Technological disruptions such as AI-powered image analysis are significantly accelerating market adoption, while changing consumer behavior toward remote healthcare access is further boosting growth. Increased adoption in rural and underserved regions and the integration of teleradiology into broader telehealth platforms are further contributing to market expansion.

Dominant Regions, Countries, or Segments in Teleradiology Market
North America currently holds the largest market share, driven by strong technological infrastructure, high adoption rates, and favorable regulatory environments. However, the Asia-Pacific region exhibits the highest growth potential due to increasing healthcare expenditure, expanding healthcare infrastructure, and a rising population.
Component Segment: The software segment is projected to hold the largest market share due to the increasing demand for advanced image analysis software and related services. Hardware segment is also growing owing to the increasing demand for specialized imaging devices.
End-User Segment: Hospitals and diagnostic centers remain the largest end-user segments, but growth in other end-users is substantial, indicating a wider market reach.
Imaging Technique Segment: X-rays and CT scans currently dominate, but growth in other imaging techniques, especially MRI and Ultrasound, presents significant opportunities.
- Key Drivers in North America: Strong healthcare infrastructure, high technological adoption, and established regulatory frameworks.
- Key Drivers in Asia-Pacific: Rising healthcare expenditure, government initiatives to improve healthcare access, and increasing prevalence of chronic diseases.
- Key Drivers in Europe: Growing adoption of telehealth initiatives and well-developed healthcare systems.
Teleradiology Market Product Landscape
Teleradiology products are continuously evolving, integrating advanced features such as AI-powered image analysis, enhanced security protocols, and improved user interfaces. The unique selling propositions include faster turnaround times for image interpretation, improved access to specialized radiologists, cost-effectiveness, and enhanced patient convenience. The latest advancements include cloud-based platforms for seamless image sharing and AI-driven tools that automate tasks, improving efficiency and accuracy.
Key Drivers, Barriers & Challenges in Teleradiology Market
Key Drivers:
- Rising prevalence of chronic diseases demanding increased diagnostic capabilities.
- Increasing demand for remote healthcare services, especially in rural areas.
- Technological advancements, including AI and cloud computing, improving efficiency and accuracy.
- Favorable government policies promoting telehealth adoption.
Key Barriers and Challenges:
- High initial investment costs associated with advanced technologies.
- Cybersecurity concerns and data privacy issues, impacting adoption.
- Interoperability challenges between different systems and platforms.
- Limited internet access in some regions, especially in developing countries.
- Regulatory hurdles and variations in regulations across different regions. This contributes to a xx% slowdown in market expansion in some regions.
Emerging Opportunities in Teleradiology Market
Emerging opportunities lie in untapped markets in developing countries, the integration of teleradiology with AI-powered diagnostics, and personalized medicine applications. The development of mobile teleradiology solutions is also poised for significant growth, offering access to healthcare in remote and underserved areas. Expansion into specialized radiology fields and the integration of teleradiology with other telehealth services presents significant potential.
Growth Accelerators in the Teleradiology Market Industry
Technological breakthroughs, particularly in AI and machine learning for image analysis, are accelerating market growth. Strategic partnerships between teleradiology providers, hospitals, and technology companies are expanding market reach. Market expansion strategies, focusing on underserved areas and integration with broader telehealth platforms, are fueling long-term growth.
Key Players Shaping the Teleradiology Market Market
- Onrad Inc
- RamSoft Inc
- GE Healthcare
- Nanox Imaging LTD (USARAD COM)
- Everlight Radiology
- HealthWatch TeleDiagnostics Private Limited
- Koninklijke Philips NV
- 4ways Healthcare Ltd
- Teleradiology Solutions
- Carestream Health
- Agfa-Gevaert Group
Notable Milestones in Teleradiology Market Sector
- April 2023: Aster DM Healthcare opened its Telecommand Center and Digital Health facility in India, expanding access to teleradiology services.
- April 2022: Teleradiology Solutions (TRS) partnered with Andhra Med Tech Zone (AMTZ) to establish a teleradiology hub, leveraging AI for enhanced efficiency.
In-Depth Teleradiology Market Market Outlook
The future of the teleradiology market is bright, driven by ongoing technological advancements, increasing demand for accessible healthcare, and supportive government policies. Strategic partnerships and market expansion into underserved regions will continue to drive growth. The market's potential lies in the integration of teleradiology with broader telehealth ecosystems, offering a comprehensive and efficient healthcare delivery model. The anticipated rise in AI-driven solutions promises higher accuracy, faster diagnosis, and enhanced overall patient care.
Teleradiology Market Segmentation
-
1. Imaging Technique
- 1.1. X-rays
- 1.2. Computed Tomography (CT)
- 1.3. Ultrasound
- 1.4. Magnetic Resonance Imaging (MRI)
- 1.5. Nuclear Imaging
- 1.6. Other Imaging Techniques
-
2. Component
- 2.1. Hardware
- 2.2. Software
-
3. End User
- 3.1. Hospitals
- 3.2. Diagnostic Centers
- 3.3. Other End Users
Teleradiology Market Segmentation By Geography
-
1. North America
- 1.1. United States
- 1.2. Canada
- 1.3. Mexico
-
2. Europe
- 2.1. Germany
- 2.2. United Kingdom
- 2.3. France
- 2.4. Italy
- 2.5. Spain
- 2.6. Rest of Europe
-
3. Asia Pacific
- 3.1. China
- 3.2. Japan
- 3.3. India
- 3.4. Australia
- 3.5. South Korea
- 3.6. Rest of Asia Pacific
-
4. Middle East and Africa
- 4.1. GCC
- 4.2. South Africa
- 4.3. Rest of Middle East and Africa
-
5. South America
- 5.1. Brazil
- 5.2. Argentina
- 5.3. Rest of South America

Teleradiology Market REPORT HIGHLIGHTS
| Aspects | Details |
|---|---|
| Study Period | 2019-2033 |
| Base Year | 2024 |
| Estimated Year | 2025 |
| Forecast Period | 2025-2033 |
| Historical Period | 2019-2024 |
| Growth Rate | CAGR of 14.33% from 2019-2033 |
| Segmentation |
|
Table of Contents
- 1. Introduction
- 1.1. Research Scope
- 1.2. Market Segmentation
- 1.3. Research Methodology
- 1.4. Definitions and Assumptions
- 2. Executive Summary
- 2.1. Introduction
- 3. Market Dynamics
- 3.1. Introduction
- 3.2. Market Drivers
- 3.2.1. Rising Number of Imaging Procedures; Development of IT Infrastructure and Rise in Healthcare Expenditure; Increasing Prevalence of Osteoarthritis and Chronic Diseases
- 3.3. Market Restrains
- 3.3.1. Lack of Skilled Professionals; Security Concerns Associated with Teleradiology
- 3.4. Market Trends
- 3.4.1. Software Segment is Expected to Register Fastest Growth Over the Forecast Period
- 4. Market Factor Analysis
- 4.1. Porters Five Forces
- 4.2. Supply/Value Chain
- 4.3. PESTEL analysis
- 4.4. Market Entropy
- 4.5. Patent/Trademark Analysis
- 5. Global Teleradiology Market Analysis, Insights and Forecast, 2019-2031
- 5.1. Market Analysis, Insights and Forecast - by Imaging Technique
- 5.1.1. X-rays
- 5.1.2. Computed Tomography (CT)
- 5.1.3. Ultrasound
- 5.1.4. Magnetic Resonance Imaging (MRI)
- 5.1.5. Nuclear Imaging
- 5.1.6. Other Imaging Techniques
- 5.2. Market Analysis, Insights and Forecast - by Component
- 5.2.1. Hardware
- 5.2.2. Software
- 5.3. Market Analysis, Insights and Forecast - by End User
- 5.3.1. Hospitals
- 5.3.2. Diagnostic Centers
- 5.3.3. Other End Users
- 5.4. Market Analysis, Insights and Forecast - by Region
- 5.4.1. North America
- 5.4.2. Europe
- 5.4.3. Asia Pacific
- 5.4.4. Middle East and Africa
- 5.4.5. South America
- 5.1. Market Analysis, Insights and Forecast - by Imaging Technique
- 6. North America Teleradiology Market Analysis, Insights and Forecast, 2019-2031
- 6.1. Market Analysis, Insights and Forecast - by Imaging Technique
- 6.1.1. X-rays
- 6.1.2. Computed Tomography (CT)
- 6.1.3. Ultrasound
- 6.1.4. Magnetic Resonance Imaging (MRI)
- 6.1.5. Nuclear Imaging
- 6.1.6. Other Imaging Techniques
- 6.2. Market Analysis, Insights and Forecast - by Component
- 6.2.1. Hardware
- 6.2.2. Software
- 6.3. Market Analysis, Insights and Forecast - by End User
- 6.3.1. Hospitals
- 6.3.2. Diagnostic Centers
- 6.3.3. Other End Users
- 6.1. Market Analysis, Insights and Forecast - by Imaging Technique
- 7. Europe Teleradiology Market Analysis, Insights and Forecast, 2019-2031
- 7.1. Market Analysis, Insights and Forecast - by Imaging Technique
- 7.1.1. X-rays
- 7.1.2. Computed Tomography (CT)
- 7.1.3. Ultrasound
- 7.1.4. Magnetic Resonance Imaging (MRI)
- 7.1.5. Nuclear Imaging
- 7.1.6. Other Imaging Techniques
- 7.2. Market Analysis, Insights and Forecast - by Component
- 7.2.1. Hardware
- 7.2.2. Software
- 7.3. Market Analysis, Insights and Forecast - by End User
- 7.3.1. Hospitals
- 7.3.2. Diagnostic Centers
- 7.3.3. Other End Users
- 7.1. Market Analysis, Insights and Forecast - by Imaging Technique
- 8. Asia Pacific Teleradiology Market Analysis, Insights and Forecast, 2019-2031
- 8.1. Market Analysis, Insights and Forecast - by Imaging Technique
- 8.1.1. X-rays
- 8.1.2. Computed Tomography (CT)
- 8.1.3. Ultrasound
- 8.1.4. Magnetic Resonance Imaging (MRI)
- 8.1.5. Nuclear Imaging
- 8.1.6. Other Imaging Techniques
- 8.2. Market Analysis, Insights and Forecast - by Component
- 8.2.1. Hardware
- 8.2.2. Software
- 8.3. Market Analysis, Insights and Forecast - by End User
- 8.3.1. Hospitals
- 8.3.2. Diagnostic Centers
- 8.3.3. Other End Users
- 8.1. Market Analysis, Insights and Forecast - by Imaging Technique
- 9. Middle East and Africa Teleradiology Market Analysis, Insights and Forecast, 2019-2031
- 9.1. Market Analysis, Insights and Forecast - by Imaging Technique
- 9.1.1. X-rays
- 9.1.2. Computed Tomography (CT)
- 9.1.3. Ultrasound
- 9.1.4. Magnetic Resonance Imaging (MRI)
- 9.1.5. Nuclear Imaging
- 9.1.6. Other Imaging Techniques
- 9.2. Market Analysis, Insights and Forecast - by Component
- 9.2.1. Hardware
- 9.2.2. Software
- 9.3. Market Analysis, Insights and Forecast - by End User
- 9.3.1. Hospitals
- 9.3.2. Diagnostic Centers
- 9.3.3. Other End Users
- 9.1. Market Analysis, Insights and Forecast - by Imaging Technique
- 10. South America Teleradiology Market Analysis, Insights and Forecast, 2019-2031
- 10.1. Market Analysis, Insights and Forecast - by Imaging Technique
- 10.1.1. X-rays
- 10.1.2. Computed Tomography (CT)
- 10.1.3. Ultrasound
- 10.1.4. Magnetic Resonance Imaging (MRI)
- 10.1.5. Nuclear Imaging
- 10.1.6. Other Imaging Techniques
- 10.2. Market Analysis, Insights and Forecast - by Component
- 10.2.1. Hardware
- 10.2.2. Software
- 10.3. Market Analysis, Insights and Forecast - by End User
- 10.3.1. Hospitals
- 10.3.2. Diagnostic Centers
- 10.3.3. Other End Users
- 10.1. Market Analysis, Insights and Forecast - by Imaging Technique
- 11. North America Teleradiology Market Analysis, Insights and Forecast, 2019-2031
- 11.1. Market Analysis, Insights and Forecast - By Country/Sub-region
- 11.1.1 United States
- 11.1.2 Canada
- 11.1.3 Mexico
- 12. Europe Teleradiology Market Analysis, Insights and Forecast, 2019-2031
- 12.1. Market Analysis, Insights and Forecast - By Country/Sub-region
- 12.1.1 Germany
- 12.1.2 United Kingdom
- 12.1.3 France
- 12.1.4 Italy
- 12.1.5 Spain
- 12.1.6 Rest of Europe
- 13. Asia Pacific Teleradiology Market Analysis, Insights and Forecast, 2019-2031
- 13.1. Market Analysis, Insights and Forecast - By Country/Sub-region
- 13.1.1 China
- 13.1.2 Japan
- 13.1.3 India
- 13.1.4 Australia
- 13.1.5 South Korea
- 13.1.6 Rest of Asia Pacific
- 14. Middle East and Africa Teleradiology Market Analysis, Insights and Forecast, 2019-2031
- 14.1. Market Analysis, Insights and Forecast - By Country/Sub-region
- 14.1.1 GCC
- 14.1.2 South Africa
- 14.1.3 Rest of Middle East and Africa
- 15. South America Teleradiology Market Analysis, Insights and Forecast, 2019-2031
- 15.1. Market Analysis, Insights and Forecast - By Country/Sub-region
- 15.1.1 Brazil
- 15.1.2 Argentina
- 15.1.3 Rest of South America
- 16. Competitive Analysis
- 16.1. Global Market Share Analysis 2024
- 16.2. Company Profiles
- 16.2.1 Onrad Inc
- 16.2.1.1. Overview
- 16.2.1.2. Products
- 16.2.1.3. SWOT Analysis
- 16.2.1.4. Recent Developments
- 16.2.1.5. Financials (Based on Availability)
- 16.2.2 RamSoft Inc
- 16.2.2.1. Overview
- 16.2.2.2. Products
- 16.2.2.3. SWOT Analysis
- 16.2.2.4. Recent Developments
- 16.2.2.5. Financials (Based on Availability)
- 16.2.3 GE Healthcare
- 16.2.3.1. Overview
- 16.2.3.2. Products
- 16.2.3.3. SWOT Analysis
- 16.2.3.4. Recent Developments
- 16.2.3.5. Financials (Based on Availability)
- 16.2.4 Nanox Imaging LTD (USARAD COM)
- 16.2.4.1. Overview
- 16.2.4.2. Products
- 16.2.4.3. SWOT Analysis
- 16.2.4.4. Recent Developments
- 16.2.4.5. Financials (Based on Availability)
- 16.2.5 Everlight Radiology
- 16.2.5.1. Overview
- 16.2.5.2. Products
- 16.2.5.3. SWOT Analysis
- 16.2.5.4. Recent Developments
- 16.2.5.5. Financials (Based on Availability)
- 16.2.6 HealthWatch TeleDiagnostics Private Limited
- 16.2.6.1. Overview
- 16.2.6.2. Products
- 16.2.6.3. SWOT Analysis
- 16.2.6.4. Recent Developments
- 16.2.6.5. Financials (Based on Availability)
- 16.2.7 Koninklijke Philips NV
- 16.2.7.1. Overview
- 16.2.7.2. Products
- 16.2.7.3. SWOT Analysis
- 16.2.7.4. Recent Developments
- 16.2.7.5. Financials (Based on Availability)
- 16.2.8 4ways Healthcare Ltd
- 16.2.8.1. Overview
- 16.2.8.2. Products
- 16.2.8.3. SWOT Analysis
- 16.2.8.4. Recent Developments
- 16.2.8.5. Financials (Based on Availability)
- 16.2.9 Teleradiology Solutions
- 16.2.9.1. Overview
- 16.2.9.2. Products
- 16.2.9.3. SWOT Analysis
- 16.2.9.4. Recent Developments
- 16.2.9.5. Financials (Based on Availability)
- 16.2.10 Carestream Health
- 16.2.10.1. Overview
- 16.2.10.2. Products
- 16.2.10.3. SWOT Analysis
- 16.2.10.4. Recent Developments
- 16.2.10.5. Financials (Based on Availability)
- 16.2.11 Agfa-Gevaert Group
- 16.2.11.1. Overview
- 16.2.11.2. Products
- 16.2.11.3. SWOT Analysis
- 16.2.11.4. Recent Developments
- 16.2.11.5. Financials (Based on Availability)
- 16.2.1 Onrad Inc
List of Figures
- Figure 1: Global Teleradiology Market Revenue Breakdown (Million, %) by Region 2024 & 2032
- Figure 2: Global Teleradiology Market Volume Breakdown (K Unit, %) by Region 2024 & 2032
- Figure 3: North America Teleradiology Market Revenue (Million), by Country 2024 & 2032
- Figure 4: North America Teleradiology Market Volume (K Unit), by Country 2024 & 2032
- Figure 5: North America Teleradiology Market Revenue Share (%), by Country 2024 & 2032
- Figure 6: North America Teleradiology Market Volume Share (%), by Country 2024 & 2032
- Figure 7: Europe Teleradiology Market Revenue (Million), by Country 2024 & 2032
- Figure 8: Europe Teleradiology Market Volume (K Unit), by Country 2024 & 2032
- Figure 9: Europe Teleradiology Market Revenue Share (%), by Country 2024 & 2032
- Figure 10: Europe Teleradiology Market Volume Share (%), by Country 2024 & 2032
- Figure 11: Asia Pacific Teleradiology Market Revenue (Million), by Country 2024 & 2032
- Figure 12: Asia Pacific Teleradiology Market Volume (K Unit), by Country 2024 & 2032
- Figure 13: Asia Pacific Teleradiology Market Revenue Share (%), by Country 2024 & 2032
- Figure 14: Asia Pacific Teleradiology Market Volume Share (%), by Country 2024 & 2032
- Figure 15: Middle East and Africa Teleradiology Market Revenue (Million), by Country 2024 & 2032
- Figure 16: Middle East and Africa Teleradiology Market Volume (K Unit), by Country 2024 & 2032
- Figure 17: Middle East and Africa Teleradiology Market Revenue Share (%), by Country 2024 & 2032
- Figure 18: Middle East and Africa Teleradiology Market Volume Share (%), by Country 2024 & 2032
- Figure 19: South America Teleradiology Market Revenue (Million), by Country 2024 & 2032
- Figure 20: South America Teleradiology Market Volume (K Unit), by Country 2024 & 2032
- Figure 21: South America Teleradiology Market Revenue Share (%), by Country 2024 & 2032
- Figure 22: South America Teleradiology Market Volume Share (%), by Country 2024 & 2032
- Figure 23: North America Teleradiology Market Revenue (Million), by Imaging Technique 2024 & 2032
- Figure 24: North America Teleradiology Market Volume (K Unit), by Imaging Technique 2024 & 2032
- Figure 25: North America Teleradiology Market Revenue Share (%), by Imaging Technique 2024 & 2032
- Figure 26: North America Teleradiology Market Volume Share (%), by Imaging Technique 2024 & 2032
- Figure 27: North America Teleradiology Market Revenue (Million), by Component 2024 & 2032
- Figure 28: North America Teleradiology Market Volume (K Unit), by Component 2024 & 2032
- Figure 29: North America Teleradiology Market Revenue Share (%), by Component 2024 & 2032
- Figure 30: North America Teleradiology Market Volume Share (%), by Component 2024 & 2032
- Figure 31: North America Teleradiology Market Revenue (Million), by End User 2024 & 2032
- Figure 32: North America Teleradiology Market Volume (K Unit), by End User 2024 & 2032
- Figure 33: North America Teleradiology Market Revenue Share (%), by End User 2024 & 2032
- Figure 34: North America Teleradiology Market Volume Share (%), by End User 2024 & 2032
- Figure 35: North America Teleradiology Market Revenue (Million), by Country 2024 & 2032
- Figure 36: North America Teleradiology Market Volume (K Unit), by Country 2024 & 2032
- Figure 37: North America Teleradiology Market Revenue Share (%), by Country 2024 & 2032
- Figure 38: North America Teleradiology Market Volume Share (%), by Country 2024 & 2032
- Figure 39: Europe Teleradiology Market Revenue (Million), by Imaging Technique 2024 & 2032
- Figure 40: Europe Teleradiology Market Volume (K Unit), by Imaging Technique 2024 & 2032
- Figure 41: Europe Teleradiology Market Revenue Share (%), by Imaging Technique 2024 & 2032
- Figure 42: Europe Teleradiology Market Volume Share (%), by Imaging Technique 2024 & 2032
- Figure 43: Europe Teleradiology Market Revenue (Million), by Component 2024 & 2032
- Figure 44: Europe Teleradiology Market Volume (K Unit), by Component 2024 & 2032
- Figure 45: Europe Teleradiology Market Revenue Share (%), by Component 2024 & 2032
- Figure 46: Europe Teleradiology Market Volume Share (%), by Component 2024 & 2032
- Figure 47: Europe Teleradiology Market Revenue (Million), by End User 2024 & 2032
- Figure 48: Europe Teleradiology Market Volume (K Unit), by End User 2024 & 2032
- Figure 49: Europe Teleradiology Market Revenue Share (%), by End User 2024 & 2032
- Figure 50: Europe Teleradiology Market Volume Share (%), by End User 2024 & 2032
- Figure 51: Europe Teleradiology Market Revenue (Million), by Country 2024 & 2032
- Figure 52: Europe Teleradiology Market Volume (K Unit), by Country 2024 & 2032
- Figure 53: Europe Teleradiology Market Revenue Share (%), by Country 2024 & 2032
- Figure 54: Europe Teleradiology Market Volume Share (%), by Country 2024 & 2032
- Figure 55: Asia Pacific Teleradiology Market Revenue (Million), by Imaging Technique 2024 & 2032
- Figure 56: Asia Pacific Teleradiology Market Volume (K Unit), by Imaging Technique 2024 & 2032
- Figure 57: Asia Pacific Teleradiology Market Revenue Share (%), by Imaging Technique 2024 & 2032
- Figure 58: Asia Pacific Teleradiology Market Volume Share (%), by Imaging Technique 2024 & 2032
- Figure 59: Asia Pacific Teleradiology Market Revenue (Million), by Component 2024 & 2032
- Figure 60: Asia Pacific Teleradiology Market Volume (K Unit), by Component 2024 & 2032
- Figure 61: Asia Pacific Teleradiology Market Revenue Share (%), by Component 2024 & 2032
- Figure 62: Asia Pacific Teleradiology Market Volume Share (%), by Component 2024 & 2032
- Figure 63: Asia Pacific Teleradiology Market Revenue (Million), by End User 2024 & 2032
- Figure 64: Asia Pacific Teleradiology Market Volume (K Unit), by End User 2024 & 2032
- Figure 65: Asia Pacific Teleradiology Market Revenue Share (%), by End User 2024 & 2032
- Figure 66: Asia Pacific Teleradiology Market Volume Share (%), by End User 2024 & 2032
- Figure 67: Asia Pacific Teleradiology Market Revenue (Million), by Country 2024 & 2032
- Figure 68: Asia Pacific Teleradiology Market Volume (K Unit), by Country 2024 & 2032
- Figure 69: Asia Pacific Teleradiology Market Revenue Share (%), by Country 2024 & 2032
- Figure 70: Asia Pacific Teleradiology Market Volume Share (%), by Country 2024 & 2032
- Figure 71: Middle East and Africa Teleradiology Market Revenue (Million), by Imaging Technique 2024 & 2032
- Figure 72: Middle East and Africa Teleradiology Market Volume (K Unit), by Imaging Technique 2024 & 2032
- Figure 73: Middle East and Africa Teleradiology Market Revenue Share (%), by Imaging Technique 2024 & 2032
- Figure 74: Middle East and Africa Teleradiology Market Volume Share (%), by Imaging Technique 2024 & 2032
- Figure 75: Middle East and Africa Teleradiology Market Revenue (Million), by Component 2024 & 2032
- Figure 76: Middle East and Africa Teleradiology Market Volume (K Unit), by Component 2024 & 2032
- Figure 77: Middle East and Africa Teleradiology Market Revenue Share (%), by Component 2024 & 2032
- Figure 78: Middle East and Africa Teleradiology Market Volume Share (%), by Component 2024 & 2032
- Figure 79: Middle East and Africa Teleradiology Market Revenue (Million), by End User 2024 & 2032
- Figure 80: Middle East and Africa Teleradiology Market Volume (K Unit), by End User 2024 & 2032
- Figure 81: Middle East and Africa Teleradiology Market Revenue Share (%), by End User 2024 & 2032
- Figure 82: Middle East and Africa Teleradiology Market Volume Share (%), by End User 2024 & 2032
- Figure 83: Middle East and Africa Teleradiology Market Revenue (Million), by Country 2024 & 2032
- Figure 84: Middle East and Africa Teleradiology Market Volume (K Unit), by Country 2024 & 2032
- Figure 85: Middle East and Africa Teleradiology Market Revenue Share (%), by Country 2024 & 2032
- Figure 86: Middle East and Africa Teleradiology Market Volume Share (%), by Country 2024 & 2032
- Figure 87: South America Teleradiology Market Revenue (Million), by Imaging Technique 2024 & 2032
- Figure 88: South America Teleradiology Market Volume (K Unit), by Imaging Technique 2024 & 2032
- Figure 89: South America Teleradiology Market Revenue Share (%), by Imaging Technique 2024 & 2032
- Figure 90: South America Teleradiology Market Volume Share (%), by Imaging Technique 2024 & 2032
- Figure 91: South America Teleradiology Market Revenue (Million), by Component 2024 & 2032
- Figure 92: South America Teleradiology Market Volume (K Unit), by Component 2024 & 2032
- Figure 93: South America Teleradiology Market Revenue Share (%), by Component 2024 & 2032
- Figure 94: South America Teleradiology Market Volume Share (%), by Component 2024 & 2032
- Figure 95: South America Teleradiology Market Revenue (Million), by End User 2024 & 2032
- Figure 96: South America Teleradiology Market Volume (K Unit), by End User 2024 & 2032
- Figure 97: South America Teleradiology Market Revenue Share (%), by End User 2024 & 2032
- Figure 98: South America Teleradiology Market Volume Share (%), by End User 2024 & 2032
- Figure 99: South America Teleradiology Market Revenue (Million), by Country 2024 & 2032
- Figure 100: South America Teleradiology Market Volume (K Unit), by Country 2024 & 2032
- Figure 101: South America Teleradiology Market Revenue Share (%), by Country 2024 & 2032
- Figure 102: South America Teleradiology Market Volume Share (%), by Country 2024 & 2032
List of Tables
- Table 1: Global Teleradiology Market Revenue Million Forecast, by Region 2019 & 2032
- Table 2: Global Teleradiology Market Volume K Unit Forecast, by Region 2019 & 2032
- Table 3: Global Teleradiology Market Revenue Million Forecast, by Imaging Technique 2019 & 2032
- Table 4: Global Teleradiology Market Volume K Unit Forecast, by Imaging Technique 2019 & 2032
- Table 5: Global Teleradiology Market Revenue Million Forecast, by Component 2019 & 2032
- Table 6: Global Teleradiology Market Volume K Unit Forecast, by Component 2019 & 2032
- Table 7: Global Teleradiology Market Revenue Million Forecast, by End User 2019 & 2032
- Table 8: Global Teleradiology Market Volume K Unit Forecast, by End User 2019 & 2032
- Table 9: Global Teleradiology Market Revenue Million Forecast, by Region 2019 & 2032
- Table 10: Global Teleradiology Market Volume K Unit Forecast, by Region 2019 & 2032
- Table 11: Global Teleradiology Market Revenue Million Forecast, by Country 2019 & 2032
- Table 12: Global Teleradiology Market Volume K Unit Forecast, by Country 2019 & 2032
- Table 13: United States Teleradiology Market Revenue (Million) Forecast, by Application 2019 & 2032
- Table 14: United States Teleradiology Market Volume (K Unit) Forecast, by Application 2019 & 2032
- Table 15: Canada Teleradiology Market Revenue (Million) Forecast, by Application 2019 & 2032
- Table 16: Canada Teleradiology Market Volume (K Unit) Forecast, by Application 2019 & 2032
- Table 17: Mexico Teleradiology Market Revenue (Million) Forecast, by Application 2019 & 2032
- Table 18: Mexico Teleradiology Market Volume (K Unit) Forecast, by Application 2019 & 2032
- Table 19: Global Teleradiology Market Revenue Million Forecast, by Country 2019 & 2032
- Table 20: Global Teleradiology Market Volume K Unit Forecast, by Country 2019 & 2032
- Table 21: Germany Teleradiology Market Revenue (Million) Forecast, by Application 2019 & 2032
- Table 22: Germany Teleradiology Market Volume (K Unit) Forecast, by Application 2019 & 2032
- Table 23: United Kingdom Teleradiology Market Revenue (Million) Forecast, by Application 2019 & 2032
- Table 24: United Kingdom Teleradiology Market Volume (K Unit) Forecast, by Application 2019 & 2032
- Table 25: France Teleradiology Market Revenue (Million) Forecast, by Application 2019 & 2032
- Table 26: France Teleradiology Market Volume (K Unit) Forecast, by Application 2019 & 2032
- Table 27: Italy Teleradiology Market Revenue (Million) Forecast, by Application 2019 & 2032
- Table 28: Italy Teleradiology Market Volume (K Unit) Forecast, by Application 2019 & 2032
- Table 29: Spain Teleradiology Market Revenue (Million) Forecast, by Application 2019 & 2032
- Table 30: Spain Teleradiology Market Volume (K Unit) Forecast, by Application 2019 & 2032
- Table 31: Rest of Europe Teleradiology Market Revenue (Million) Forecast, by Application 2019 & 2032
- Table 32: Rest of Europe Teleradiology Market Volume (K Unit) Forecast, by Application 2019 & 2032
- Table 33: Global Teleradiology Market Revenue Million Forecast, by Country 2019 & 2032
- Table 34: Global Teleradiology Market Volume K Unit Forecast, by Country 2019 & 2032
- Table 35: China Teleradiology Market Revenue (Million) Forecast, by Application 2019 & 2032
- Table 36: China Teleradiology Market Volume (K Unit) Forecast, by Application 2019 & 2032
- Table 37: Japan Teleradiology Market Revenue (Million) Forecast, by Application 2019 & 2032
- Table 38: Japan Teleradiology Market Volume (K Unit) Forecast, by Application 2019 & 2032
- Table 39: India Teleradiology Market Revenue (Million) Forecast, by Application 2019 & 2032
- Table 40: India Teleradiology Market Volume (K Unit) Forecast, by Application 2019 & 2032
- Table 41: Australia Teleradiology Market Revenue (Million) Forecast, by Application 2019 & 2032
- Table 42: Australia Teleradiology Market Volume (K Unit) Forecast, by Application 2019 & 2032
- Table 43: South Korea Teleradiology Market Revenue (Million) Forecast, by Application 2019 & 2032
- Table 44: South Korea Teleradiology Market Volume (K Unit) Forecast, by Application 2019 & 2032
- Table 45: Rest of Asia Pacific Teleradiology Market Revenue (Million) Forecast, by Application 2019 & 2032
- Table 46: Rest of Asia Pacific Teleradiology Market Volume (K Unit) Forecast, by Application 2019 & 2032
- Table 47: Global Teleradiology Market Revenue Million Forecast, by Country 2019 & 2032
- Table 48: Global Teleradiology Market Volume K Unit Forecast, by Country 2019 & 2032
- Table 49: GCC Teleradiology Market Revenue (Million) Forecast, by Application 2019 & 2032
- Table 50: GCC Teleradiology Market Volume (K Unit) Forecast, by Application 2019 & 2032
- Table 51: South Africa Teleradiology Market Revenue (Million) Forecast, by Application 2019 & 2032
- Table 52: South Africa Teleradiology Market Volume (K Unit) Forecast, by Application 2019 & 2032
- Table 53: Rest of Middle East and Africa Teleradiology Market Revenue (Million) Forecast, by Application 2019 & 2032
- Table 54: Rest of Middle East and Africa Teleradiology Market Volume (K Unit) Forecast, by Application 2019 & 2032
- Table 55: Global Teleradiology Market Revenue Million Forecast, by Country 2019 & 2032
- Table 56: Global Teleradiology Market Volume K Unit Forecast, by Country 2019 & 2032
- Table 57: Brazil Teleradiology Market Revenue (Million) Forecast, by Application 2019 & 2032
- Table 58: Brazil Teleradiology Market Volume (K Unit) Forecast, by Application 2019 & 2032
- Table 59: Argentina Teleradiology Market Revenue (Million) Forecast, by Application 2019 & 2032
- Table 60: Argentina Teleradiology Market Volume (K Unit) Forecast, by Application 2019 & 2032
- Table 61: Rest of South America Teleradiology Market Revenue (Million) Forecast, by Application 2019 & 2032
- Table 62: Rest of South America Teleradiology Market Volume (K Unit) Forecast, by Application 2019 & 2032
- Table 63: Global Teleradiology Market Revenue Million Forecast, by Imaging Technique 2019 & 2032
- Table 64: Global Teleradiology Market Volume K Unit Forecast, by Imaging Technique 2019 & 2032
- Table 65: Global Teleradiology Market Revenue Million Forecast, by Component 2019 & 2032
- Table 66: Global Teleradiology Market Volume K Unit Forecast, by Component 2019 & 2032
- Table 67: Global Teleradiology Market Revenue Million Forecast, by End User 2019 & 2032
- Table 68: Global Teleradiology Market Volume K Unit Forecast, by End User 2019 & 2032
- Table 69: Global Teleradiology Market Revenue Million Forecast, by Country 2019 & 2032
- Table 70: Global Teleradiology Market Volume K Unit Forecast, by Country 2019 & 2032
- Table 71: United States Teleradiology Market Revenue (Million) Forecast, by Application 2019 & 2032
- Table 72: United States Teleradiology Market Volume (K Unit) Forecast, by Application 2019 & 2032
- Table 73: Canada Teleradiology Market Revenue (Million) Forecast, by Application 2019 & 2032
- Table 74: Canada Teleradiology Market Volume (K Unit) Forecast, by Application 2019 & 2032
- Table 75: Mexico Teleradiology Market Revenue (Million) Forecast, by Application 2019 & 2032
- Table 76: Mexico Teleradiology Market Volume (K Unit) Forecast, by Application 2019 & 2032
- Table 77: Global Teleradiology Market Revenue Million Forecast, by Imaging Technique 2019 & 2032
- Table 78: Global Teleradiology Market Volume K Unit Forecast, by Imaging Technique 2019 & 2032
- Table 79: Global Teleradiology Market Revenue Million Forecast, by Component 2019 & 2032
- Table 80: Global Teleradiology Market Volume K Unit Forecast, by Component 2019 & 2032
- Table 81: Global Teleradiology Market Revenue Million Forecast, by End User 2019 & 2032
- Table 82: Global Teleradiology Market Volume K Unit Forecast, by End User 2019 & 2032
- Table 83: Global Teleradiology Market Revenue Million Forecast, by Country 2019 & 2032
- Table 84: Global Teleradiology Market Volume K Unit Forecast, by Country 2019 & 2032
- Table 85: Germany Teleradiology Market Revenue (Million) Forecast, by Application 2019 & 2032
- Table 86: Germany Teleradiology Market Volume (K Unit) Forecast, by Application 2019 & 2032
- Table 87: United Kingdom Teleradiology Market Revenue (Million) Forecast, by Application 2019 & 2032
- Table 88: United Kingdom Teleradiology Market Volume (K Unit) Forecast, by Application 2019 & 2032
- Table 89: France Teleradiology Market Revenue (Million) Forecast, by Application 2019 & 2032
- Table 90: France Teleradiology Market Volume (K Unit) Forecast, by Application 2019 & 2032
- Table 91: Italy Teleradiology Market Revenue (Million) Forecast, by Application 2019 & 2032
- Table 92: Italy Teleradiology Market Volume (K Unit) Forecast, by Application 2019 & 2032
- Table 93: Spain Teleradiology Market Revenue (Million) Forecast, by Application 2019 & 2032
- Table 94: Spain Teleradiology Market Volume (K Unit) Forecast, by Application 2019 & 2032
- Table 95: Rest of Europe Teleradiology Market Revenue (Million) Forecast, by Application 2019 & 2032
- Table 96: Rest of Europe Teleradiology Market Volume (K Unit) Forecast, by Application 2019 & 2032
- Table 97: Global Teleradiology Market Revenue Million Forecast, by Imaging Technique 2019 & 2032
- Table 98: Global Teleradiology Market Volume K Unit Forecast, by Imaging Technique 2019 & 2032
- Table 99: Global Teleradiology Market Revenue Million Forecast, by Component 2019 & 2032
- Table 100: Global Teleradiology Market Volume K Unit Forecast, by Component 2019 & 2032
- Table 101: Global Teleradiology Market Revenue Million Forecast, by End User 2019 & 2032
- Table 102: Global Teleradiology Market Volume K Unit Forecast, by End User 2019 & 2032
- Table 103: Global Teleradiology Market Revenue Million Forecast, by Country 2019 & 2032
- Table 104: Global Teleradiology Market Volume K Unit Forecast, by Country 2019 & 2032
- Table 105: China Teleradiology Market Revenue (Million) Forecast, by Application 2019 & 2032
- Table 106: China Teleradiology Market Volume (K Unit) Forecast, by Application 2019 & 2032
- Table 107: Japan Teleradiology Market Revenue (Million) Forecast, by Application 2019 & 2032
- Table 108: Japan Teleradiology Market Volume (K Unit) Forecast, by Application 2019 & 2032
- Table 109: India Teleradiology Market Revenue (Million) Forecast, by Application 2019 & 2032
- Table 110: India Teleradiology Market Volume (K Unit) Forecast, by Application 2019 & 2032
- Table 111: Australia Teleradiology Market Revenue (Million) Forecast, by Application 2019 & 2032
- Table 112: Australia Teleradiology Market Volume (K Unit) Forecast, by Application 2019 & 2032
- Table 113: South Korea Teleradiology Market Revenue (Million) Forecast, by Application 2019 & 2032
- Table 114: South Korea Teleradiology Market Volume (K Unit) Forecast, by Application 2019 & 2032
- Table 115: Rest of Asia Pacific Teleradiology Market Revenue (Million) Forecast, by Application 2019 & 2032
- Table 116: Rest of Asia Pacific Teleradiology Market Volume (K Unit) Forecast, by Application 2019 & 2032
- Table 117: Global Teleradiology Market Revenue Million Forecast, by Imaging Technique 2019 & 2032
- Table 118: Global Teleradiology Market Volume K Unit Forecast, by Imaging Technique 2019 & 2032
- Table 119: Global Teleradiology Market Revenue Million Forecast, by Component 2019 & 2032
- Table 120: Global Teleradiology Market Volume K Unit Forecast, by Component 2019 & 2032
- Table 121: Global Teleradiology Market Revenue Million Forecast, by End User 2019 & 2032
- Table 122: Global Teleradiology Market Volume K Unit Forecast, by End User 2019 & 2032
- Table 123: Global Teleradiology Market Revenue Million Forecast, by Country 2019 & 2032
- Table 124: Global Teleradiology Market Volume K Unit Forecast, by Country 2019 & 2032
- Table 125: GCC Teleradiology Market Revenue (Million) Forecast, by Application 2019 & 2032
- Table 126: GCC Teleradiology Market Volume (K Unit) Forecast, by Application 2019 & 2032
- Table 127: South Africa Teleradiology Market Revenue (Million) Forecast, by Application 2019 & 2032
- Table 128: South Africa Teleradiology Market Volume (K Unit) Forecast, by Application 2019 & 2032
- Table 129: Rest of Middle East and Africa Teleradiology Market Revenue (Million) Forecast, by Application 2019 & 2032
- Table 130: Rest of Middle East and Africa Teleradiology Market Volume (K Unit) Forecast, by Application 2019 & 2032
- Table 131: Global Teleradiology Market Revenue Million Forecast, by Imaging Technique 2019 & 2032
- Table 132: Global Teleradiology Market Volume K Unit Forecast, by Imaging Technique 2019 & 2032
- Table 133: Global Teleradiology Market Revenue Million Forecast, by Component 2019 & 2032
- Table 134: Global Teleradiology Market Volume K Unit Forecast, by Component 2019 & 2032
- Table 135: Global Teleradiology Market Revenue Million Forecast, by End User 2019 & 2032
- Table 136: Global Teleradiology Market Volume K Unit Forecast, by End User 2019 & 2032
- Table 137: Global Teleradiology Market Revenue Million Forecast, by Country 2019 & 2032
- Table 138: Global Teleradiology Market Volume K Unit Forecast, by Country 2019 & 2032
- Table 139: Brazil Teleradiology Market Revenue (Million) Forecast, by Application 2019 & 2032
- Table 140: Brazil Teleradiology Market Volume (K Unit) Forecast, by Application 2019 & 2032
- Table 141: Argentina Teleradiology Market Revenue (Million) Forecast, by Application 2019 & 2032
- Table 142: Argentina Teleradiology Market Volume (K Unit) Forecast, by Application 2019 & 2032
- Table 143: Rest of South America Teleradiology Market Revenue (Million) Forecast, by Application 2019 & 2032
- Table 144: Rest of South America Teleradiology Market Volume (K Unit) Forecast, by Application 2019 & 2032
Frequently Asked Questions
1. What is the projected Compound Annual Growth Rate (CAGR) of the Teleradiology Market?
The projected CAGR is approximately 14.33%.
2. Which companies are prominent players in the Teleradiology Market?
Key companies in the market include Onrad Inc, RamSoft Inc, GE Healthcare, Nanox Imaging LTD (USARAD COM), Everlight Radiology, HealthWatch TeleDiagnostics Private Limited, Koninklijke Philips NV, 4ways Healthcare Ltd, Teleradiology Solutions, Carestream Health, Agfa-Gevaert Group.
3. What are the main segments of the Teleradiology Market?
The market segments include Imaging Technique, Component, End User.
4. Can you provide details about the market size?
The market size is estimated to be USD 39.90 Million as of 2022.
5. What are some drivers contributing to market growth?
Rising Number of Imaging Procedures; Development of IT Infrastructure and Rise in Healthcare Expenditure; Increasing Prevalence of Osteoarthritis and Chronic Diseases.
6. What are the notable trends driving market growth?
Software Segment is Expected to Register Fastest Growth Over the Forecast Period.
7. Are there any restraints impacting market growth?
Lack of Skilled Professionals; Security Concerns Associated with Teleradiology.
8. Can you provide examples of recent developments in the market?
April 2023: Aster DM Healthcare opened its Telecommand Center and Digital Health facility in India, which uses cutting-edge technology to provide all telehealth services under one roof, including teleradiology.
9. What pricing options are available for accessing the report?
Pricing options include single-user, multi-user, and enterprise licenses priced at USD 4750, USD 5250, and USD 8750 respectively.
10. Is the market size provided in terms of value or volume?
The market size is provided in terms of value, measured in Million and volume, measured in K Unit.
11. Are there any specific market keywords associated with the report?
Yes, the market keyword associated with the report is "Teleradiology Market," which aids in identifying and referencing the specific market segment covered.
12. How do I determine which pricing option suits my needs best?
The pricing options vary based on user requirements and access needs. Individual users may opt for single-user licenses, while businesses requiring broader access may choose multi-user or enterprise licenses for cost-effective access to the report.
13. Are there any additional resources or data provided in the Teleradiology Market report?
While the report offers comprehensive insights, it's advisable to review the specific contents or supplementary materials provided to ascertain if additional resources or data are available.
14. How can I stay updated on further developments or reports in the Teleradiology Market?
To stay informed about further developments, trends, and reports in the Teleradiology Market, consider subscribing to industry newsletters, following relevant companies and organizations, or regularly checking reputable industry news sources and publications.
Methodology
Step 1 - Identification of Relevant Samples Size from Population Database


Step 2 - Approaches for Defining Global Market Size (Value, Volume* & Price*)

Note*: In applicable scenarios
Step 3 - Data Sources
Primary Research
- Web Analytics
- Survey Reports
- Research Institute
- Latest Research Reports
- Opinion Leaders
Secondary Research
- Annual Reports
- White Paper
- Latest Press Release
- Industry Association
- Paid Database
- Investor Presentations

Step 4 - Data Triangulation
Involves using different sources of information in order to increase the validity of a study
These sources are likely to be stakeholders in a program - participants, other researchers, program staff, other community members, and so on.
Then we put all data in single framework & apply various statistical tools to find out the dynamic on the market.
During the analysis stage, feedback from the stakeholder groups would be compared to determine areas of agreement as well as areas of divergence


