
Key Insights
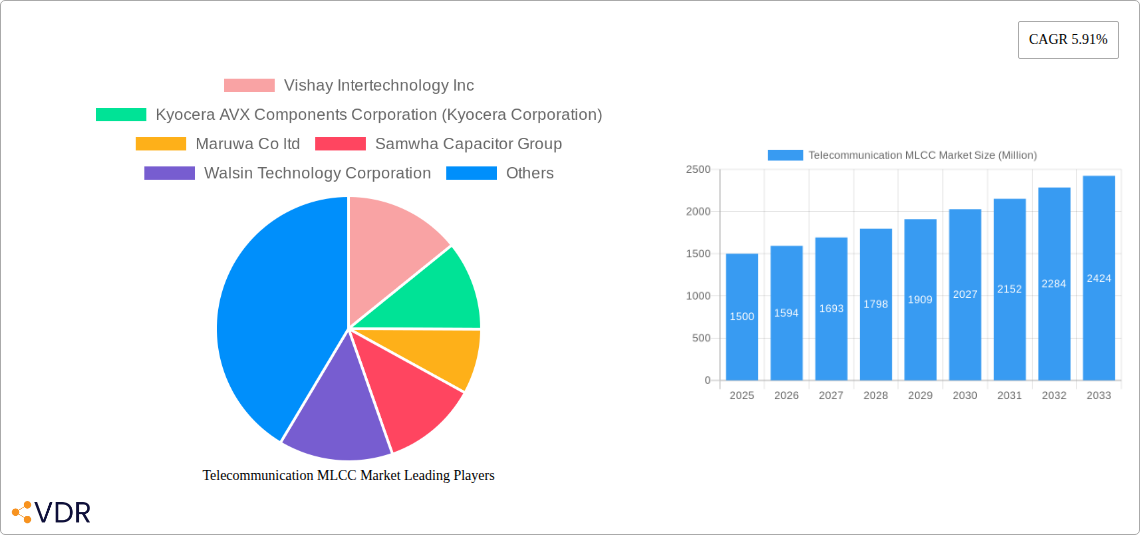
The telecommunication MLCC (Multilayer Ceramic Capacitor) market is experiencing robust growth, driven by the increasing demand for high-frequency, high-capacity, and miniaturized components in advanced telecommunication infrastructure. The market's Compound Annual Growth Rate (CAGR) of 5.91% from 2019 to 2024 indicates a consistent expansion, projected to continue through 2033. Key drivers include the proliferation of 5G networks, the rising adoption of IoT devices, and the continuous miniaturization of electronic components within base stations and set-top boxes. These trends necessitate MLCCs with higher capacitance values and improved performance characteristics, especially in voltage ranges exceeding 50V, a segment exhibiting strong growth. Market segmentation reveals a significant portion of demand focused on 10μF to 100μF capacitance, 50V to 200V voltage ranges, and Class 1 dielectric types, reflecting the specific needs of telecommunication applications. While competitive intensity remains high amongst leading players like Vishay Intertechnology, Kyocera AVX, and Murata Manufacturing, opportunities exist for innovation in materials and design to address future technological advancements in 6G and beyond. The market's growth is, however, potentially constrained by supply chain complexities, fluctuating raw material prices, and geopolitical factors affecting the manufacturing and distribution of these crucial components.
The substantial investment in 5G infrastructure globally is a major catalyst for market growth. The demand for high-performance MLCCs is expected to increase exponentially in the forecast period (2025-2033) due to the higher frequency and data transmission requirements of 5G. Furthermore, the surging adoption of IoT devices further fuels demand for smaller, more energy-efficient components. The market's strong growth is underpinned by ongoing technological advancements leading to increased integration and miniaturization of electronic systems within telecommunications equipment. The diverse range of MLCC types catering to specific application needs, as indicated by the market segmentation data, signifies ongoing adaptation and innovation to meet the ever-evolving demands of the industry. Continued research and development in materials science will likely unlock further improvements in capacitance, voltage handling, and miniaturization, paving the way for even higher growth in the coming years.
Telecommunication MLCC Market: A Comprehensive Report (2019-2033)
This comprehensive report provides an in-depth analysis of the Telecommunication MLCC market, encompassing market dynamics, growth trends, regional dominance, product landscape, and future outlook. The report covers the period from 2019 to 2033, with 2025 serving as the base year and forecast extending to 2033. The study analyzes the parent market of Multilayer Ceramic Capacitors (MLCCs) and its child market focused specifically on telecommunication applications. This report is invaluable for industry professionals, investors, and strategists seeking a clear understanding of this vital component in the rapidly evolving telecommunications landscape. The market size is predicted to reach xx Million units by 2033.
Telecommunication MLCC Market Dynamics & Structure
The telecommunication MLCC market is characterized by a moderately concentrated landscape, with key players like Murata Manufacturing, TDK, Samsung Electro-Mechanics, and Vishay Intertechnology holding significant market share. Market concentration is influenced by economies of scale in manufacturing, intense R&D efforts to develop advanced materials, and stringent quality control. Technological innovations, particularly in miniaturization, higher capacitance density, and improved temperature stability, are major drivers. Regulatory frameworks concerning electronic waste disposal and material compliance also shape market dynamics. Competitive product substitutes include other types of capacitors, but MLCCs maintain a dominant position due to their superior performance characteristics and cost-effectiveness in many telecommunication applications. End-user demographics are shifting towards increased adoption of 5G technology and IoT devices, fueling demand for high-performance MLCCs. M&A activity within the sector remains relatively low, however, xx M&A deals were recorded in the last five years, suggesting consolidation opportunities.
- Market Concentration: Moderately concentrated, with top players holding xx% of market share (2025).
- Technological Innovation Drivers: Miniaturization, improved capacitance density, enhanced temperature stability.
- Regulatory Framework: Compliance with RoHS, REACH, and WEEE directives impacting material selection and waste management.
- Competitive Substitutes: Film capacitors, tantalum capacitors, electrolytic capacitors.
- End-User Demographics: Growing adoption of 5G, IoT devices, and smart infrastructure.
- M&A Trends: Low volume of transactions but potential for increased consolidation. xx M&A deals in the last 5 years.
Telecommunication MLCC Market Growth Trends & Insights
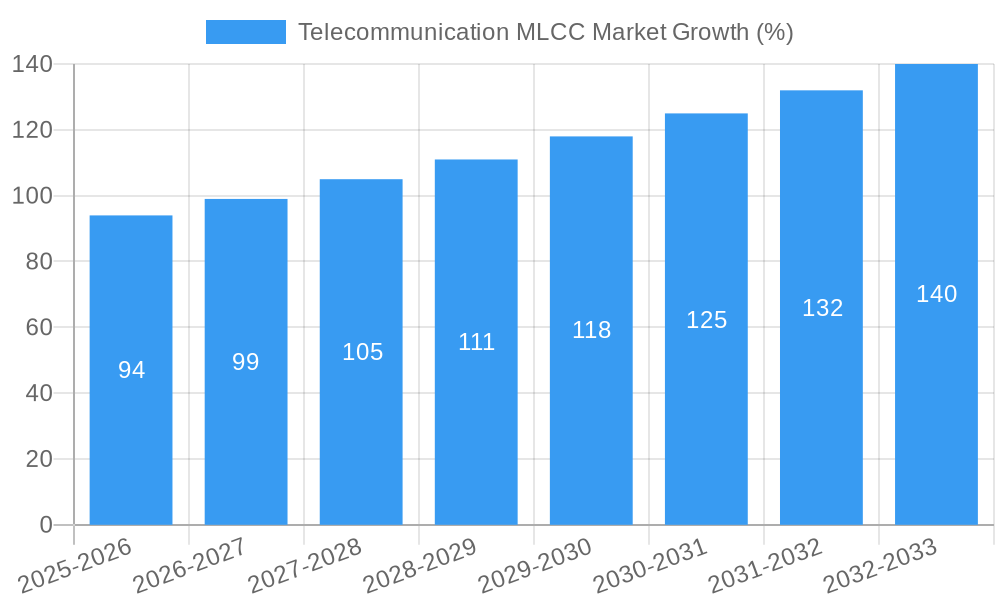
The telecommunication MLCC market exhibited a CAGR of xx% during the historical period (2019-2024) and is projected to maintain a CAGR of xx% during the forecast period (2025-2033), reaching xx Million units by 2033. This growth is primarily driven by the expanding telecommunications infrastructure globally, particularly the rollout of 5G networks and the proliferation of IoT devices. Technological advancements such as the development of smaller, higher-capacitance MLCCs are further contributing to market expansion. Consumer demand for high-speed data, seamless connectivity, and advanced features in mobile devices and other telecommunication equipment will continue to drive adoption rates. The market penetration of high-performance MLCCs is expected to increase significantly, driven by their application in advanced 5G base stations and high-density server systems. Disruptions from new material technologies or innovative capacitor designs are less likely to significantly alter this positive growth trajectory in the near to medium term.
Dominant Regions, Countries, or Segments in Telecommunication MLCC Market
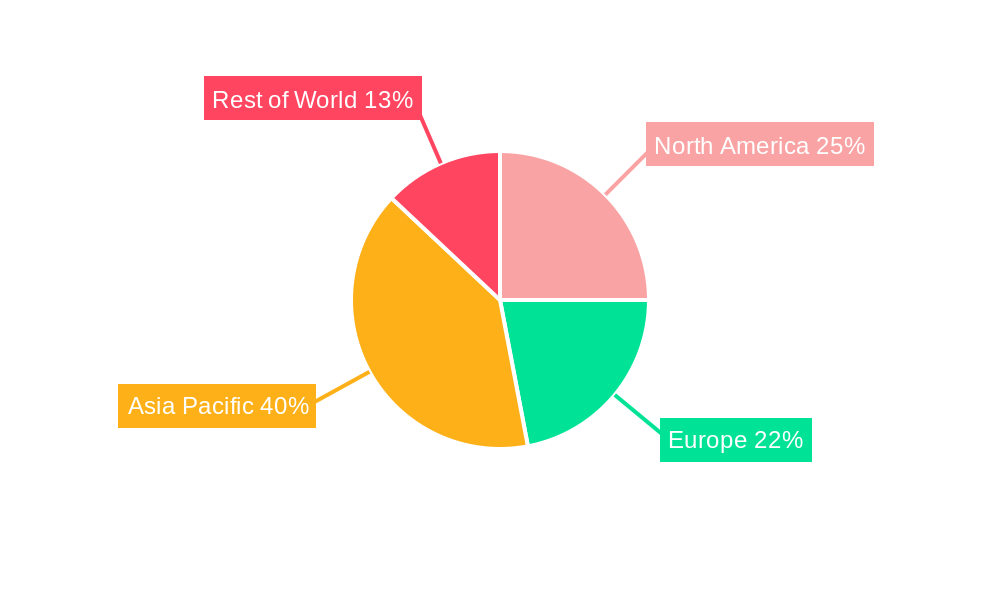
The Asia-Pacific region is currently the dominant market for telecommunication MLCCs, driven by the concentration of major manufacturers, rapid growth of the electronics industry, and strong demand from countries such as China, Japan, South Korea and India. The North American and European markets are also significant, exhibiting steady growth fueled by investment in 5G infrastructure and ongoing technological developments. Within segments, the high-capacitance (more than 100 μF) segment is showing the fastest growth due to its applications in high-power telecommunication equipment. Similarly, the demand for MLCCs in the 0603M and smaller case sizes is rising.
- Leading Region: Asia-Pacific (xx% market share in 2025)
- Key Drivers in Asia-Pacific: Large manufacturing base, rapid growth of electronics industry, strong domestic demand.
- Key Drivers in North America/Europe: 5G infrastructure investments, high technology adoption.
- Fastest Growing Segment: Capacitance: More than 100 μF (projected CAGR of xx% from 2025-2033).
- Fastest Growing Case Size Segment: 0603M and smaller case sizes.
Telecommunication MLCC Market Product Landscape
The telecommunication MLCC market offers a wide range of products with varying capacitance, voltage ratings, case sizes, and dielectric types, catering to diverse application needs. Recent innovations focus on miniaturization, high-frequency performance, and improved temperature stability, addressing challenges posed by the increasing density and complexity of modern telecommunication equipment. Unique selling propositions are centered on size reduction, enhanced reliability, and improved energy efficiency. Technological advancements in dielectric materials and manufacturing processes are driving performance improvements and cost reductions.
Key Drivers, Barriers & Challenges in Telecommunication MLCC Market
Key Drivers:
- Growing demand for 5G and IoT applications.
- Miniaturization trends in telecommunication devices.
- Increased need for high-frequency and high-capacitance components.
- Government investments in telecommunications infrastructure.
Key Challenges:
- Fluctuations in raw material prices (e.g., precious metals used in dielectric materials).
- Supply chain disruptions impacting manufacturing capacity and delivery times.
- Intense competition among manufacturers, resulting in price pressure.
- Stringent environmental regulations (e.g., RoHS compliance). The cost of compliance is estimated to increase manufacturing costs by xx%.
Emerging Opportunities in Telecommunication MLCC Market
- Expansion into emerging markets with growing telecommunication infrastructure.
- Development of specialized MLCCs for high-frequency 5G applications.
- Increasing integration of MLCCs in automotive and industrial IoT devices.
- Demand for MLCCs with advanced features like improved energy efficiency and reduced ESR.
Growth Accelerators in the Telecommunication MLCC Market Industry
Strategic partnerships and collaborations among manufacturers and telecommunication equipment providers are driving innovation and fostering market expansion. Technological breakthroughs in material science are leading to more efficient, higher-capacity, and smaller MLCCs. These advancements, alongside increased investment in R&D, enable faster time-to-market for new products, thus strengthening overall market growth. Expansion into emerging markets will also significantly contribute to long-term growth.
Key Players Shaping the Telecommunication MLCC Market Market
- Vishay Intertechnology Inc
- Kyocera AVX Components Corporation (Kyocera Corporation)
- Maruwa Co ltd
- Samwha Capacitor Group
- Walsin Technology Corporation
- Samsung Electro-Mechanics
- Würth Elektronik GmbH & Co KG
- Yageo Corporation
- Taiyo Yuden Co Ltd
- TDK Corporation
- Murata Manufacturing Co Ltd
- Nippon Chemi-Con Corporation
Notable Milestones in Telecommunication MLCC Market Sector
- October 2022: Vishay introduced a new line of surface-mount MLCCs for improved DC-blocking applications in RF, Bluetooth, 5G, and other high-frequency applications.
- March 2023: Murata developed the GRM series of MLCCs in 0201-inch/0603M package size with 10µF capacitance, ideal for smartphones, wearables, and IoT devices.
- June 2023: A company (name not specified) introduced the NTS/NTF series of SMD type MLCCs with 25-500 Vdc and 0.010-47µF capacitance, for use in power supplies and DC-DC converters.
In-Depth Telecommunication MLCC Market Market Outlook
The future of the telecommunication MLCC market appears highly promising, fueled by sustained growth in the telecommunications sector and ongoing technological advancements. The market is poised for continued expansion, particularly in emerging markets and high-growth segments like 5G and IoT. Strategic partnerships, investments in R&D, and the development of innovative products will be crucial to capitalizing on the significant opportunities within this dynamic market. Focus on miniaturization, energy efficiency, and enhanced performance will continue to shape future market trends.
Telecommunication MLCC Market Segmentation
-
1. Device Type
- 1.1. Base Stations
- 1.2. Set Top Boxes
- 1.3. Others
-
2. Case Size
- 2.1. 0 201
- 2.2. 0 402
- 2.3. 0 603
- 2.4. 1 005
- 2.5. 1 210
- 2.6. Others
-
3. Voltage
- 3.1. 50V to 200V
- 3.2. Less than 50V
- 3.3. More than 200V
-
4. Capacitance
- 4.1. 10 μF to 100 μF
- 4.2. Less than 10 μF
- 4.3. More than 100 μF
-
5. Dielectric Type
- 5.1. Class 1
- 5.2. Class 2
Telecommunication MLCC Market Segmentation By Geography
-
1. North America
- 1.1. United States
- 1.2. Canada
- 1.3. Mexico
-
2. South America
- 2.1. Brazil
- 2.2. Argentina
- 2.3. Rest of South America
-
3. Europe
- 3.1. United Kingdom
- 3.2. Germany
- 3.3. France
- 3.4. Italy
- 3.5. Spain
- 3.6. Russia
- 3.7. Benelux
- 3.8. Nordics
- 3.9. Rest of Europe
-
4. Middle East & Africa
- 4.1. Turkey
- 4.2. Israel
- 4.3. GCC
- 4.4. North Africa
- 4.5. South Africa
- 4.6. Rest of Middle East & Africa
-
5. Asia Pacific
- 5.1. China
- 5.2. India
- 5.3. Japan
- 5.4. South Korea
- 5.5. ASEAN
- 5.6. Oceania
- 5.7. Rest of Asia Pacific
Telecommunication MLCC Market REPORT HIGHLIGHTS
| Aspects | Details |
|---|---|
| Study Period | 2019-2033 |
| Base Year | 2024 |
| Estimated Year | 2025 |
| Forecast Period | 2025-2033 |
| Historical Period | 2019-2024 |
| Growth Rate | CAGR of 5.91% from 2019-2033 |
| Segmentation |
|
Table of Contents
- 1. Introduction
- 1.1. Research Scope
- 1.2. Market Segmentation
- 1.3. Research Methodology
- 1.4. Definitions and Assumptions
- 2. Executive Summary
- 2.1. Introduction
- 3. Market Dynamics
- 3.1. Introduction
- 3.2. Market Drivers
- 3.2.1. Rise in the Applications of Semiconductors; Advancement in Technology Such as Magnetron Sputtering Technology
- 3.3. Market Restrains
- 3.3.1. Rise of Alternative Technologies Such as Thermal Evaporation
- 3.4. Market Trends
- 3.4.1. OTHER KEY INDUSTRY TRENDS COVERED IN THE REPORT
- 4. Market Factor Analysis
- 4.1. Porters Five Forces
- 4.2. Supply/Value Chain
- 4.3. PESTEL analysis
- 4.4. Market Entropy
- 4.5. Patent/Trademark Analysis
- 5. Global Telecommunication MLCC Market Analysis, Insights and Forecast, 2019-2031
- 5.1. Market Analysis, Insights and Forecast - by Device Type
- 5.1.1. Base Stations
- 5.1.2. Set Top Boxes
- 5.1.3. Others
- 5.2. Market Analysis, Insights and Forecast - by Case Size
- 5.2.1. 0 201
- 5.2.2. 0 402
- 5.2.3. 0 603
- 5.2.4. 1 005
- 5.2.5. 1 210
- 5.2.6. Others
- 5.3. Market Analysis, Insights and Forecast - by Voltage
- 5.3.1. 50V to 200V
- 5.3.2. Less than 50V
- 5.3.3. More than 200V
- 5.4. Market Analysis, Insights and Forecast - by Capacitance
- 5.4.1. 10 μF to 100 μF
- 5.4.2. Less than 10 μF
- 5.4.3. More than 100 μF
- 5.5. Market Analysis, Insights and Forecast - by Dielectric Type
- 5.5.1. Class 1
- 5.5.2. Class 2
- 5.6. Market Analysis, Insights and Forecast - by Region
- 5.6.1. North America
- 5.6.2. South America
- 5.6.3. Europe
- 5.6.4. Middle East & Africa
- 5.6.5. Asia Pacific
- 5.1. Market Analysis, Insights and Forecast - by Device Type
- 6. North America Telecommunication MLCC Market Analysis, Insights and Forecast, 2019-2031
- 6.1. Market Analysis, Insights and Forecast - by Device Type
- 6.1.1. Base Stations
- 6.1.2. Set Top Boxes
- 6.1.3. Others
- 6.2. Market Analysis, Insights and Forecast - by Case Size
- 6.2.1. 0 201
- 6.2.2. 0 402
- 6.2.3. 0 603
- 6.2.4. 1 005
- 6.2.5. 1 210
- 6.2.6. Others
- 6.3. Market Analysis, Insights and Forecast - by Voltage
- 6.3.1. 50V to 200V
- 6.3.2. Less than 50V
- 6.3.3. More than 200V
- 6.4. Market Analysis, Insights and Forecast - by Capacitance
- 6.4.1. 10 μF to 100 μF
- 6.4.2. Less than 10 μF
- 6.4.3. More than 100 μF
- 6.5. Market Analysis, Insights and Forecast - by Dielectric Type
- 6.5.1. Class 1
- 6.5.2. Class 2
- 6.1. Market Analysis, Insights and Forecast - by Device Type
- 7. South America Telecommunication MLCC Market Analysis, Insights and Forecast, 2019-2031
- 7.1. Market Analysis, Insights and Forecast - by Device Type
- 7.1.1. Base Stations
- 7.1.2. Set Top Boxes
- 7.1.3. Others
- 7.2. Market Analysis, Insights and Forecast - by Case Size
- 7.2.1. 0 201
- 7.2.2. 0 402
- 7.2.3. 0 603
- 7.2.4. 1 005
- 7.2.5. 1 210
- 7.2.6. Others
- 7.3. Market Analysis, Insights and Forecast - by Voltage
- 7.3.1. 50V to 200V
- 7.3.2. Less than 50V
- 7.3.3. More than 200V
- 7.4. Market Analysis, Insights and Forecast - by Capacitance
- 7.4.1. 10 μF to 100 μF
- 7.4.2. Less than 10 μF
- 7.4.3. More than 100 μF
- 7.5. Market Analysis, Insights and Forecast - by Dielectric Type
- 7.5.1. Class 1
- 7.5.2. Class 2
- 7.1. Market Analysis, Insights and Forecast - by Device Type
- 8. Europe Telecommunication MLCC Market Analysis, Insights and Forecast, 2019-2031
- 8.1. Market Analysis, Insights and Forecast - by Device Type
- 8.1.1. Base Stations
- 8.1.2. Set Top Boxes
- 8.1.3. Others
- 8.2. Market Analysis, Insights and Forecast - by Case Size
- 8.2.1. 0 201
- 8.2.2. 0 402
- 8.2.3. 0 603
- 8.2.4. 1 005
- 8.2.5. 1 210
- 8.2.6. Others
- 8.3. Market Analysis, Insights and Forecast - by Voltage
- 8.3.1. 50V to 200V
- 8.3.2. Less than 50V
- 8.3.3. More than 200V
- 8.4. Market Analysis, Insights and Forecast - by Capacitance
- 8.4.1. 10 μF to 100 μF
- 8.4.2. Less than 10 μF
- 8.4.3. More than 100 μF
- 8.5. Market Analysis, Insights and Forecast - by Dielectric Type
- 8.5.1. Class 1
- 8.5.2. Class 2
- 8.1. Market Analysis, Insights and Forecast - by Device Type
- 9. Middle East & Africa Telecommunication MLCC Market Analysis, Insights and Forecast, 2019-2031
- 9.1. Market Analysis, Insights and Forecast - by Device Type
- 9.1.1. Base Stations
- 9.1.2. Set Top Boxes
- 9.1.3. Others
- 9.2. Market Analysis, Insights and Forecast - by Case Size
- 9.2.1. 0 201
- 9.2.2. 0 402
- 9.2.3. 0 603
- 9.2.4. 1 005
- 9.2.5. 1 210
- 9.2.6. Others
- 9.3. Market Analysis, Insights and Forecast - by Voltage
- 9.3.1. 50V to 200V
- 9.3.2. Less than 50V
- 9.3.3. More than 200V
- 9.4. Market Analysis, Insights and Forecast - by Capacitance
- 9.4.1. 10 μF to 100 μF
- 9.4.2. Less than 10 μF
- 9.4.3. More than 100 μF
- 9.5. Market Analysis, Insights and Forecast - by Dielectric Type
- 9.5.1. Class 1
- 9.5.2. Class 2
- 9.1. Market Analysis, Insights and Forecast - by Device Type
- 10. Asia Pacific Telecommunication MLCC Market Analysis, Insights and Forecast, 2019-2031
- 10.1. Market Analysis, Insights and Forecast - by Device Type
- 10.1.1. Base Stations
- 10.1.2. Set Top Boxes
- 10.1.3. Others
- 10.2. Market Analysis, Insights and Forecast - by Case Size
- 10.2.1. 0 201
- 10.2.2. 0 402
- 10.2.3. 0 603
- 10.2.4. 1 005
- 10.2.5. 1 210
- 10.2.6. Others
- 10.3. Market Analysis, Insights and Forecast - by Voltage
- 10.3.1. 50V to 200V
- 10.3.2. Less than 50V
- 10.3.3. More than 200V
- 10.4. Market Analysis, Insights and Forecast - by Capacitance
- 10.4.1. 10 μF to 100 μF
- 10.4.2. Less than 10 μF
- 10.4.3. More than 100 μF
- 10.5. Market Analysis, Insights and Forecast - by Dielectric Type
- 10.5.1. Class 1
- 10.5.2. Class 2
- 10.1. Market Analysis, Insights and Forecast - by Device Type
- 11. Competitive Analysis
- 11.1. Global Market Share Analysis 2024
- 11.2. Company Profiles
- 11.2.1 Vishay Intertechnology Inc
- 11.2.1.1. Overview
- 11.2.1.2. Products
- 11.2.1.3. SWOT Analysis
- 11.2.1.4. Recent Developments
- 11.2.1.5. Financials (Based on Availability)
- 11.2.2 Kyocera AVX Components Corporation (Kyocera Corporation)
- 11.2.2.1. Overview
- 11.2.2.2. Products
- 11.2.2.3. SWOT Analysis
- 11.2.2.4. Recent Developments
- 11.2.2.5. Financials (Based on Availability)
- 11.2.3 Maruwa Co ltd
- 11.2.3.1. Overview
- 11.2.3.2. Products
- 11.2.3.3. SWOT Analysis
- 11.2.3.4. Recent Developments
- 11.2.3.5. Financials (Based on Availability)
- 11.2.4 Samwha Capacitor Group
- 11.2.4.1. Overview
- 11.2.4.2. Products
- 11.2.4.3. SWOT Analysis
- 11.2.4.4. Recent Developments
- 11.2.4.5. Financials (Based on Availability)
- 11.2.5 Walsin Technology Corporation
- 11.2.5.1. Overview
- 11.2.5.2. Products
- 11.2.5.3. SWOT Analysis
- 11.2.5.4. Recent Developments
- 11.2.5.5. Financials (Based on Availability)
- 11.2.6 Samsung Electro-Mechanics
- 11.2.6.1. Overview
- 11.2.6.2. Products
- 11.2.6.3. SWOT Analysis
- 11.2.6.4. Recent Developments
- 11.2.6.5. Financials (Based on Availability)
- 11.2.7 Würth Elektronik GmbH & Co KG
- 11.2.7.1. Overview
- 11.2.7.2. Products
- 11.2.7.3. SWOT Analysis
- 11.2.7.4. Recent Developments
- 11.2.7.5. Financials (Based on Availability)
- 11.2.8 Yageo Corporatio
- 11.2.8.1. Overview
- 11.2.8.2. Products
- 11.2.8.3. SWOT Analysis
- 11.2.8.4. Recent Developments
- 11.2.8.5. Financials (Based on Availability)
- 11.2.9 Taiyo Yuden Co Ltd
- 11.2.9.1. Overview
- 11.2.9.2. Products
- 11.2.9.3. SWOT Analysis
- 11.2.9.4. Recent Developments
- 11.2.9.5. Financials (Based on Availability)
- 11.2.10 TDK Corporation
- 11.2.10.1. Overview
- 11.2.10.2. Products
- 11.2.10.3. SWOT Analysis
- 11.2.10.4. Recent Developments
- 11.2.10.5. Financials (Based on Availability)
- 11.2.11 Murata Manufacturing Co Ltd
- 11.2.11.1. Overview
- 11.2.11.2. Products
- 11.2.11.3. SWOT Analysis
- 11.2.11.4. Recent Developments
- 11.2.11.5. Financials (Based on Availability)
- 11.2.12 Nippon Chemi-Con Corporation
- 11.2.12.1. Overview
- 11.2.12.2. Products
- 11.2.12.3. SWOT Analysis
- 11.2.12.4. Recent Developments
- 11.2.12.5. Financials (Based on Availability)
- 11.2.1 Vishay Intertechnology Inc
List of Figures
- Figure 1: Global Telecommunication MLCC Market Revenue Breakdown (Million, %) by Region 2024 & 2032
- Figure 2: North America Telecommunication MLCC Market Revenue (Million), by Device Type 2024 & 2032
- Figure 3: North America Telecommunication MLCC Market Revenue Share (%), by Device Type 2024 & 2032
- Figure 4: North America Telecommunication MLCC Market Revenue (Million), by Case Size 2024 & 2032
- Figure 5: North America Telecommunication MLCC Market Revenue Share (%), by Case Size 2024 & 2032
- Figure 6: North America Telecommunication MLCC Market Revenue (Million), by Voltage 2024 & 2032
- Figure 7: North America Telecommunication MLCC Market Revenue Share (%), by Voltage 2024 & 2032
- Figure 8: North America Telecommunication MLCC Market Revenue (Million), by Capacitance 2024 & 2032
- Figure 9: North America Telecommunication MLCC Market Revenue Share (%), by Capacitance 2024 & 2032
- Figure 10: North America Telecommunication MLCC Market Revenue (Million), by Dielectric Type 2024 & 2032
- Figure 11: North America Telecommunication MLCC Market Revenue Share (%), by Dielectric Type 2024 & 2032
- Figure 12: North America Telecommunication MLCC Market Revenue (Million), by Country 2024 & 2032
- Figure 13: North America Telecommunication MLCC Market Revenue Share (%), by Country 2024 & 2032
- Figure 14: South America Telecommunication MLCC Market Revenue (Million), by Device Type 2024 & 2032
- Figure 15: South America Telecommunication MLCC Market Revenue Share (%), by Device Type 2024 & 2032
- Figure 16: South America Telecommunication MLCC Market Revenue (Million), by Case Size 2024 & 2032
- Figure 17: South America Telecommunication MLCC Market Revenue Share (%), by Case Size 2024 & 2032
- Figure 18: South America Telecommunication MLCC Market Revenue (Million), by Voltage 2024 & 2032
- Figure 19: South America Telecommunication MLCC Market Revenue Share (%), by Voltage 2024 & 2032
- Figure 20: South America Telecommunication MLCC Market Revenue (Million), by Capacitance 2024 & 2032
- Figure 21: South America Telecommunication MLCC Market Revenue Share (%), by Capacitance 2024 & 2032
- Figure 22: South America Telecommunication MLCC Market Revenue (Million), by Dielectric Type 2024 & 2032
- Figure 23: South America Telecommunication MLCC Market Revenue Share (%), by Dielectric Type 2024 & 2032
- Figure 24: South America Telecommunication MLCC Market Revenue (Million), by Country 2024 & 2032
- Figure 25: South America Telecommunication MLCC Market Revenue Share (%), by Country 2024 & 2032
- Figure 26: Europe Telecommunication MLCC Market Revenue (Million), by Device Type 2024 & 2032
- Figure 27: Europe Telecommunication MLCC Market Revenue Share (%), by Device Type 2024 & 2032
- Figure 28: Europe Telecommunication MLCC Market Revenue (Million), by Case Size 2024 & 2032
- Figure 29: Europe Telecommunication MLCC Market Revenue Share (%), by Case Size 2024 & 2032
- Figure 30: Europe Telecommunication MLCC Market Revenue (Million), by Voltage 2024 & 2032
- Figure 31: Europe Telecommunication MLCC Market Revenue Share (%), by Voltage 2024 & 2032
- Figure 32: Europe Telecommunication MLCC Market Revenue (Million), by Capacitance 2024 & 2032
- Figure 33: Europe Telecommunication MLCC Market Revenue Share (%), by Capacitance 2024 & 2032
- Figure 34: Europe Telecommunication MLCC Market Revenue (Million), by Dielectric Type 2024 & 2032
- Figure 35: Europe Telecommunication MLCC Market Revenue Share (%), by Dielectric Type 2024 & 2032
- Figure 36: Europe Telecommunication MLCC Market Revenue (Million), by Country 2024 & 2032
- Figure 37: Europe Telecommunication MLCC Market Revenue Share (%), by Country 2024 & 2032
- Figure 38: Middle East & Africa Telecommunication MLCC Market Revenue (Million), by Device Type 2024 & 2032
- Figure 39: Middle East & Africa Telecommunication MLCC Market Revenue Share (%), by Device Type 2024 & 2032
- Figure 40: Middle East & Africa Telecommunication MLCC Market Revenue (Million), by Case Size 2024 & 2032
- Figure 41: Middle East & Africa Telecommunication MLCC Market Revenue Share (%), by Case Size 2024 & 2032
- Figure 42: Middle East & Africa Telecommunication MLCC Market Revenue (Million), by Voltage 2024 & 2032
- Figure 43: Middle East & Africa Telecommunication MLCC Market Revenue Share (%), by Voltage 2024 & 2032
- Figure 44: Middle East & Africa Telecommunication MLCC Market Revenue (Million), by Capacitance 2024 & 2032
- Figure 45: Middle East & Africa Telecommunication MLCC Market Revenue Share (%), by Capacitance 2024 & 2032
- Figure 46: Middle East & Africa Telecommunication MLCC Market Revenue (Million), by Dielectric Type 2024 & 2032
- Figure 47: Middle East & Africa Telecommunication MLCC Market Revenue Share (%), by Dielectric Type 2024 & 2032
- Figure 48: Middle East & Africa Telecommunication MLCC Market Revenue (Million), by Country 2024 & 2032
- Figure 49: Middle East & Africa Telecommunication MLCC Market Revenue Share (%), by Country 2024 & 2032
- Figure 50: Asia Pacific Telecommunication MLCC Market Revenue (Million), by Device Type 2024 & 2032
- Figure 51: Asia Pacific Telecommunication MLCC Market Revenue Share (%), by Device Type 2024 & 2032
- Figure 52: Asia Pacific Telecommunication MLCC Market Revenue (Million), by Case Size 2024 & 2032
- Figure 53: Asia Pacific Telecommunication MLCC Market Revenue Share (%), by Case Size 2024 & 2032
- Figure 54: Asia Pacific Telecommunication MLCC Market Revenue (Million), by Voltage 2024 & 2032
- Figure 55: Asia Pacific Telecommunication MLCC Market Revenue Share (%), by Voltage 2024 & 2032
- Figure 56: Asia Pacific Telecommunication MLCC Market Revenue (Million), by Capacitance 2024 & 2032
- Figure 57: Asia Pacific Telecommunication MLCC Market Revenue Share (%), by Capacitance 2024 & 2032
- Figure 58: Asia Pacific Telecommunication MLCC Market Revenue (Million), by Dielectric Type 2024 & 2032
- Figure 59: Asia Pacific Telecommunication MLCC Market Revenue Share (%), by Dielectric Type 2024 & 2032
- Figure 60: Asia Pacific Telecommunication MLCC Market Revenue (Million), by Country 2024 & 2032
- Figure 61: Asia Pacific Telecommunication MLCC Market Revenue Share (%), by Country 2024 & 2032
List of Tables
- Table 1: Global Telecommunication MLCC Market Revenue Million Forecast, by Region 2019 & 2032
- Table 2: Global Telecommunication MLCC Market Revenue Million Forecast, by Device Type 2019 & 2032
- Table 3: Global Telecommunication MLCC Market Revenue Million Forecast, by Case Size 2019 & 2032
- Table 4: Global Telecommunication MLCC Market Revenue Million Forecast, by Voltage 2019 & 2032
- Table 5: Global Telecommunication MLCC Market Revenue Million Forecast, by Capacitance 2019 & 2032
- Table 6: Global Telecommunication MLCC Market Revenue Million Forecast, by Dielectric Type 2019 & 2032
- Table 7: Global Telecommunication MLCC Market Revenue Million Forecast, by Region 2019 & 2032
- Table 8: Global Telecommunication MLCC Market Revenue Million Forecast, by Device Type 2019 & 2032
- Table 9: Global Telecommunication MLCC Market Revenue Million Forecast, by Case Size 2019 & 2032
- Table 10: Global Telecommunication MLCC Market Revenue Million Forecast, by Voltage 2019 & 2032
- Table 11: Global Telecommunication MLCC Market Revenue Million Forecast, by Capacitance 2019 & 2032
- Table 12: Global Telecommunication MLCC Market Revenue Million Forecast, by Dielectric Type 2019 & 2032
- Table 13: Global Telecommunication MLCC Market Revenue Million Forecast, by Country 2019 & 2032
- Table 14: United States Telecommunication MLCC Market Revenue (Million) Forecast, by Application 2019 & 2032
- Table 15: Canada Telecommunication MLCC Market Revenue (Million) Forecast, by Application 2019 & 2032
- Table 16: Mexico Telecommunication MLCC Market Revenue (Million) Forecast, by Application 2019 & 2032
- Table 17: Global Telecommunication MLCC Market Revenue Million Forecast, by Device Type 2019 & 2032
- Table 18: Global Telecommunication MLCC Market Revenue Million Forecast, by Case Size 2019 & 2032
- Table 19: Global Telecommunication MLCC Market Revenue Million Forecast, by Voltage 2019 & 2032
- Table 20: Global Telecommunication MLCC Market Revenue Million Forecast, by Capacitance 2019 & 2032
- Table 21: Global Telecommunication MLCC Market Revenue Million Forecast, by Dielectric Type 2019 & 2032
- Table 22: Global Telecommunication MLCC Market Revenue Million Forecast, by Country 2019 & 2032
- Table 23: Brazil Telecommunication MLCC Market Revenue (Million) Forecast, by Application 2019 & 2032
- Table 24: Argentina Telecommunication MLCC Market Revenue (Million) Forecast, by Application 2019 & 2032
- Table 25: Rest of South America Telecommunication MLCC Market Revenue (Million) Forecast, by Application 2019 & 2032
- Table 26: Global Telecommunication MLCC Market Revenue Million Forecast, by Device Type 2019 & 2032
- Table 27: Global Telecommunication MLCC Market Revenue Million Forecast, by Case Size 2019 & 2032
- Table 28: Global Telecommunication MLCC Market Revenue Million Forecast, by Voltage 2019 & 2032
- Table 29: Global Telecommunication MLCC Market Revenue Million Forecast, by Capacitance 2019 & 2032
- Table 30: Global Telecommunication MLCC Market Revenue Million Forecast, by Dielectric Type 2019 & 2032
- Table 31: Global Telecommunication MLCC Market Revenue Million Forecast, by Country 2019 & 2032
- Table 32: United Kingdom Telecommunication MLCC Market Revenue (Million) Forecast, by Application 2019 & 2032
- Table 33: Germany Telecommunication MLCC Market Revenue (Million) Forecast, by Application 2019 & 2032
- Table 34: France Telecommunication MLCC Market Revenue (Million) Forecast, by Application 2019 & 2032
- Table 35: Italy Telecommunication MLCC Market Revenue (Million) Forecast, by Application 2019 & 2032
- Table 36: Spain Telecommunication MLCC Market Revenue (Million) Forecast, by Application 2019 & 2032
- Table 37: Russia Telecommunication MLCC Market Revenue (Million) Forecast, by Application 2019 & 2032
- Table 38: Benelux Telecommunication MLCC Market Revenue (Million) Forecast, by Application 2019 & 2032
- Table 39: Nordics Telecommunication MLCC Market Revenue (Million) Forecast, by Application 2019 & 2032
- Table 40: Rest of Europe Telecommunication MLCC Market Revenue (Million) Forecast, by Application 2019 & 2032
- Table 41: Global Telecommunication MLCC Market Revenue Million Forecast, by Device Type 2019 & 2032
- Table 42: Global Telecommunication MLCC Market Revenue Million Forecast, by Case Size 2019 & 2032
- Table 43: Global Telecommunication MLCC Market Revenue Million Forecast, by Voltage 2019 & 2032
- Table 44: Global Telecommunication MLCC Market Revenue Million Forecast, by Capacitance 2019 & 2032
- Table 45: Global Telecommunication MLCC Market Revenue Million Forecast, by Dielectric Type 2019 & 2032
- Table 46: Global Telecommunication MLCC Market Revenue Million Forecast, by Country 2019 & 2032
- Table 47: Turkey Telecommunication MLCC Market Revenue (Million) Forecast, by Application 2019 & 2032
- Table 48: Israel Telecommunication MLCC Market Revenue (Million) Forecast, by Application 2019 & 2032
- Table 49: GCC Telecommunication MLCC Market Revenue (Million) Forecast, by Application 2019 & 2032
- Table 50: North Africa Telecommunication MLCC Market Revenue (Million) Forecast, by Application 2019 & 2032
- Table 51: South Africa Telecommunication MLCC Market Revenue (Million) Forecast, by Application 2019 & 2032
- Table 52: Rest of Middle East & Africa Telecommunication MLCC Market Revenue (Million) Forecast, by Application 2019 & 2032
- Table 53: Global Telecommunication MLCC Market Revenue Million Forecast, by Device Type 2019 & 2032
- Table 54: Global Telecommunication MLCC Market Revenue Million Forecast, by Case Size 2019 & 2032
- Table 55: Global Telecommunication MLCC Market Revenue Million Forecast, by Voltage 2019 & 2032
- Table 56: Global Telecommunication MLCC Market Revenue Million Forecast, by Capacitance 2019 & 2032
- Table 57: Global Telecommunication MLCC Market Revenue Million Forecast, by Dielectric Type 2019 & 2032
- Table 58: Global Telecommunication MLCC Market Revenue Million Forecast, by Country 2019 & 2032
- Table 59: China Telecommunication MLCC Market Revenue (Million) Forecast, by Application 2019 & 2032
- Table 60: India Telecommunication MLCC Market Revenue (Million) Forecast, by Application 2019 & 2032
- Table 61: Japan Telecommunication MLCC Market Revenue (Million) Forecast, by Application 2019 & 2032
- Table 62: South Korea Telecommunication MLCC Market Revenue (Million) Forecast, by Application 2019 & 2032
- Table 63: ASEAN Telecommunication MLCC Market Revenue (Million) Forecast, by Application 2019 & 2032
- Table 64: Oceania Telecommunication MLCC Market Revenue (Million) Forecast, by Application 2019 & 2032
- Table 65: Rest of Asia Pacific Telecommunication MLCC Market Revenue (Million) Forecast, by Application 2019 & 2032
Frequently Asked Questions
1. What is the projected Compound Annual Growth Rate (CAGR) of the Telecommunication MLCC Market?
The projected CAGR is approximately 5.91%.
2. Which companies are prominent players in the Telecommunication MLCC Market?
Key companies in the market include Vishay Intertechnology Inc, Kyocera AVX Components Corporation (Kyocera Corporation), Maruwa Co ltd, Samwha Capacitor Group, Walsin Technology Corporation, Samsung Electro-Mechanics, Würth Elektronik GmbH & Co KG, Yageo Corporatio, Taiyo Yuden Co Ltd, TDK Corporation, Murata Manufacturing Co Ltd, Nippon Chemi-Con Corporation.
3. What are the main segments of the Telecommunication MLCC Market?
The market segments include Device Type, Case Size, Voltage, Capacitance, Dielectric Type.
4. Can you provide details about the market size?
The market size is estimated to be USD XX Million as of 2022.
5. What are some drivers contributing to market growth?
Rise in the Applications of Semiconductors; Advancement in Technology Such as Magnetron Sputtering Technology.
6. What are the notable trends driving market growth?
OTHER KEY INDUSTRY TRENDS COVERED IN THE REPORT.
7. Are there any restraints impacting market growth?
Rise of Alternative Technologies Such as Thermal Evaporation.
8. Can you provide examples of recent developments in the market?
June 2023: The growing demand for industrial equipments has driven the company to introduce NTS/NTF NTS/NTF Series of SMD type MLCC. These capacitors are rated with 25 to 500 Vdc with a capacitance ranging from 0.010 to 47µF. These MLCCs are used in on-board power supplies,voltage regulators for computers,smoothing circuit of DC-DC converters,etc.March 2023: Murata developed the GRM series of MLCCs in 0201inch/0603M package size with capacitance values of 10µF (and a ±20% tolerance).These MLCCs are highly suited for integration into the decoupling and smoothing circuitry of smartphone handsets, portable equipment, wearables, domestic appliances, servers, and IoT hardware.October 2022: Vishay introduced a new line of surface-mount MLCC to serve DC-blocking applications better. In RF, Bluetooth, 5G, military radios, fiber optic lines, and high-frequency data links applications, the MLCCs effectively carry the necessary AC signal over the chosen frequency band with less than 0.5 dB insertion loss, removing the need for more expensive broadband blocks.
9. What pricing options are available for accessing the report?
Pricing options include single-user, multi-user, and enterprise licenses priced at USD 3800, USD 4500, and USD 5800 respectively.
10. Is the market size provided in terms of value or volume?
The market size is provided in terms of value, measured in Million.
11. Are there any specific market keywords associated with the report?
Yes, the market keyword associated with the report is "Telecommunication MLCC Market," which aids in identifying and referencing the specific market segment covered.
12. How do I determine which pricing option suits my needs best?
The pricing options vary based on user requirements and access needs. Individual users may opt for single-user licenses, while businesses requiring broader access may choose multi-user or enterprise licenses for cost-effective access to the report.
13. Are there any additional resources or data provided in the Telecommunication MLCC Market report?
While the report offers comprehensive insights, it's advisable to review the specific contents or supplementary materials provided to ascertain if additional resources or data are available.
14. How can I stay updated on further developments or reports in the Telecommunication MLCC Market?
To stay informed about further developments, trends, and reports in the Telecommunication MLCC Market, consider subscribing to industry newsletters, following relevant companies and organizations, or regularly checking reputable industry news sources and publications.
Methodology
Step 1 - Identification of Relevant Samples Size from Population Database


Step 2 - Approaches for Defining Global Market Size (Value, Volume* & Price*)

Note*: In applicable scenarios
Step 3 - Data Sources
Primary Research
- Web Analytics
- Survey Reports
- Research Institute
- Latest Research Reports
- Opinion Leaders
Secondary Research
- Annual Reports
- White Paper
- Latest Press Release
- Industry Association
- Paid Database
- Investor Presentations

Step 4 - Data Triangulation
Involves using different sources of information in order to increase the validity of a study
These sources are likely to be stakeholders in a program - participants, other researchers, program staff, other community members, and so on.
Then we put all data in single framework & apply various statistical tools to find out the dynamic on the market.
During the analysis stage, feedback from the stakeholder groups would be compared to determine areas of agreement as well as areas of divergence


