
Key Insights
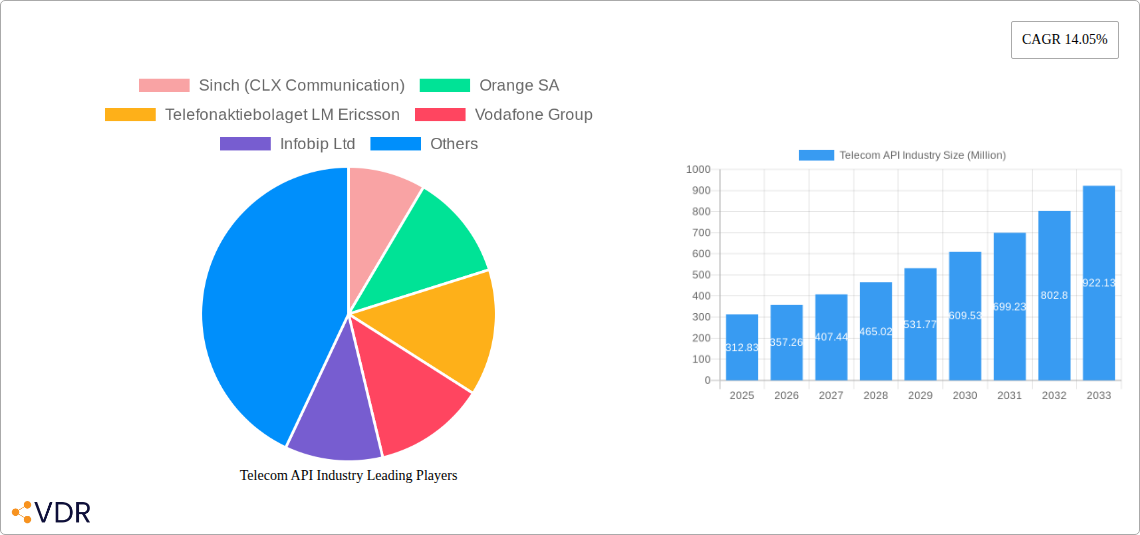
The Telecom API market, valued at $312.83 million in 2025, is experiencing robust growth, projected to expand at a Compound Annual Growth Rate (CAGR) of 14.05% from 2025 to 2033. This expansion is fueled by several key drivers. The increasing adoption of cloud-based communication solutions by enterprises is a major factor, as businesses seek scalable and flexible communication infrastructure. Furthermore, the surge in demand for enhanced customer experience through personalized communication channels, such as SMS, voice, and chatbots, is significantly contributing to market growth. The rising popularity of IoT devices and the need for seamless connectivity are also driving demand for Telecom APIs. Market segmentation reveals a strong preference for Messaging APIs and WebRTC APIs, reflecting the growing importance of real-time communication and personalized messaging. The enterprise developer segment dominates end-user adoption, showcasing the crucial role of Telecom APIs in business applications. Geographic distribution shows North America and Europe holding significant market shares, though the Asia-Pacific region is anticipated to witness substantial growth driven by increasing smartphone penetration and digitalization efforts. Competitive landscape analysis highlights major players like Twilio, Sinch, and Infobip, who are constantly innovating and expanding their service offerings to cater to evolving market demands.
The restraining forces, while present, are relatively manageable. Security concerns surrounding data privacy and the integration of APIs into existing systems represent challenges. However, advancements in security protocols and the increasing availability of robust integration tools are mitigating these concerns. Future trends point toward an increasing focus on AI-powered communication features within Telecom APIs, enabling sophisticated chatbot functionalities and advanced analytics for improved customer interaction. Furthermore, the growing emphasis on 5G technology is poised to enhance the capabilities of Telecom APIs, paving the way for richer and more interactive communication experiences. The market is expected to evolve toward more specialized and integrated solutions, encompassing diverse functionalities under a single platform, thereby streamlining operations and reducing complexity for developers. Overall, the Telecom API market is poised for sustained growth, driven by technological advancements and the ever-increasing reliance on digital communication across various industries.
Telecom API Industry Market Report: 2019-2033
This comprehensive report provides a detailed analysis of the Telecom API industry, encompassing market size, growth trends, competitive landscape, and future outlook. The study period covers 2019-2033, with 2025 as the base and estimated year. This report is crucial for telecom providers, developers, investors, and anyone seeking to understand this rapidly evolving market. The report segments the market by type of service, deployment type, and end-user, providing granular insights into various market dynamics.
Telecom API Industry Market Dynamics & Structure
The Telecom API market is characterized by a dynamic interplay of factors influencing its structure and growth. Market concentration is moderate, with a few dominant players and a large number of smaller niche players. Technological innovation, particularly in 5G and cloud computing, is a primary growth driver. Regulatory frameworks, varying across regions, significantly impact market access and competition. The market faces competition from substitute technologies and services, necessitating constant innovation to maintain a competitive edge. End-user demographics are expanding beyond traditional telecom developers to include a growing base of enterprise and long-tail developers. M&A activity is significant, with larger players consolidating their positions and expanding their portfolios.
- Market Concentration: Moderate, with a few major players controlling xx% of the market share in 2024.
- Technological Innovation: 5G, cloud computing, and AI are key drivers, boosting API capabilities and adoption.
- Regulatory Frameworks: Varying regulations across regions pose both opportunities and challenges for market expansion.
- Competitive Substitutes: Existing technologies and emerging alternatives present competitive pressure.
- End-User Demographics: A shift towards broader adoption by enterprise and long-tail developers is observed.
- M&A Trends: Significant consolidation through mergers and acquisitions, driving market concentration. xx major M&A deals were observed between 2019 and 2024.
Telecom API Industry Growth Trends & Insights
The Telecom API market experienced significant growth during the historical period (2019-2024), driven by increasing demand for digital services and the expansion of mobile networks. The market size reached xx Million in 2024, exhibiting a CAGR of xx% during this period. This growth is fueled by the rising adoption of cloud-based solutions, the proliferation of mobile devices, and the increasing need for seamless integration of telecom services into various applications. Technological disruptions such as the rise of 5G and edge computing are accelerating the adoption of advanced API functionalities. Consumer behavior shifts, with growing reliance on mobile and digital services, have further driven market expansion. We project the market to reach xx Million by 2025 and xx Million by 2033, with a projected CAGR of xx% during the forecast period (2025-2033).

Dominant Regions, Countries, or Segments in Telecom API Industry
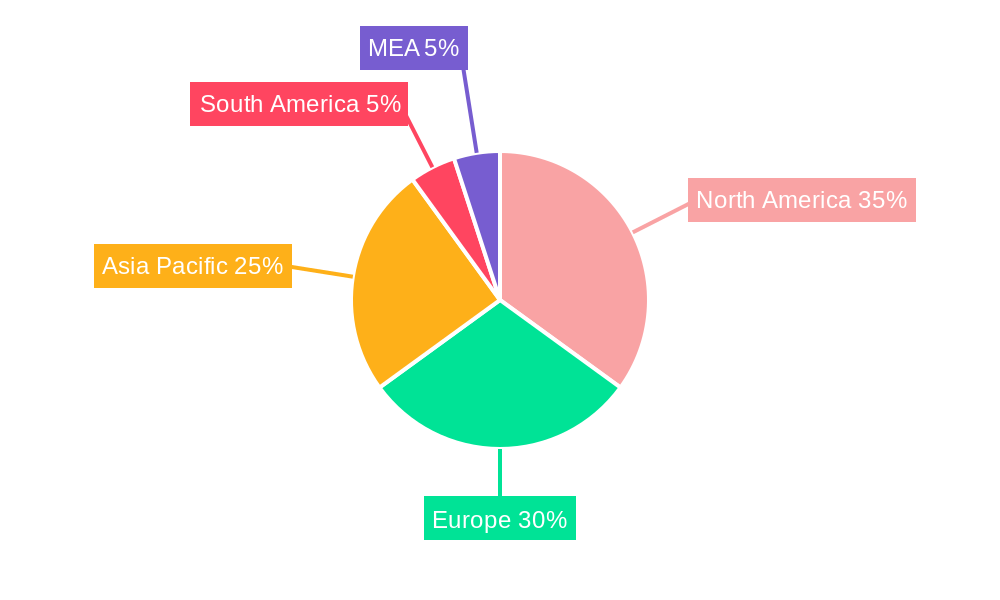
North America currently dominates the Telecom API market, holding a significant market share in 2024 (estimated at xx%). This dominance stems from high technological maturity, early adoption of cloud-based solutions, and robust digital infrastructure. Europe and Asia-Pacific are also significant regions, demonstrating robust growth. Within the segments:
- By Type of Service: Messaging APIs hold the largest market share, followed by IVR/Voice APIs and WebRTC APIs. The high demand for real-time communication and personalized messaging is driving this trend. Payment API is also a rapidly growing segment.
- By Deployment Type: Cloud-based deployment is rapidly gaining traction over on-premise solutions, fueled by cost-effectiveness and scalability. Hybrid deployment also holds a considerable market share.
- By End User: Enterprise developers constitute a substantial user base, followed by internal telecom developers. The increasing involvement of partner and long-tail developers indicates market expansion beyond traditional players.
Key drivers in North America include supportive government policies, a robust venture capital ecosystem, and early adoption of new technologies. The region's well-established telecommunications infrastructure further enhances its market leadership. Europe and Asia-Pacific also show significant growth potential, driven by increasing mobile penetration, expanding digital economies, and investments in 5G infrastructure.
Telecom API Industry Product Landscape
The Telecom API product landscape is characterized by a continuous stream of innovation. Vendors offer a range of APIs, including messaging, voice, payment, and location-based services. Key differentiators include enhanced security features, improved scalability, real-time capabilities, and ease of integration. Advanced analytics and AI-powered functionalities are increasingly being incorporated to provide better insights and improved service delivery. The focus is on building more secure, efficient, and versatile APIs that cater to the expanding needs of both developers and businesses.
Key Drivers, Barriers & Challenges in Telecom API Industry
Key Drivers:
- 5G Technology: Expansion of 5G networks is driving demand for high-bandwidth, low-latency APIs.
- Cloud Computing: Cloud-based APIs offer scalability, cost-efficiency, and ease of deployment.
- Digital Transformation: Businesses are increasingly adopting digital strategies, driving the demand for API integration.
Challenges & Restraints:
- Security Concerns: Data breaches and security vulnerabilities can hinder API adoption.
- Regulatory Complexity: Varying regulations across regions create hurdles for market expansion.
- Interoperability Issues: Lack of standardization can impede seamless integration of APIs from different providers. Estimated impact: xx% reduction in market growth.
Emerging Opportunities in Telecom API Industry
- IoT Integration: Growing demand for connected devices creates opportunities for API-driven solutions.
- AI-powered APIs: APIs leveraging AI and machine learning are creating innovative possibilities.
- Hyper-personalization: APIs supporting personalized services are shaping the future of customer experience.
Growth Accelerators in the Telecom API Industry
Technological breakthroughs, particularly in 5G and edge computing, are key growth drivers. Strategic partnerships between telecom providers and technology companies are fostering innovation and market expansion. The increasing adoption of cloud-based solutions, coupled with a growing need for seamless integration of telecom services into various applications, is accelerating market growth.
Key Players Shaping the Telecom API Industry Market
- Sinch (CLX Communication)
- Orange SA
- Telefonaktiebolaget LM Ericsson
- Vodafone Group
- Infobip Ltd
- Cisco Systems Inc
- Verizon Communications Inc
- Twilio Inc
- Ribbon Communications
- Nokia
- Deutsche Telekom AG
- Google LLC (Apigee Corporation)
- Huawei Technologies Co Ltd
- AT&T Inc
- Telefonica SA
Notable Milestones in Telecom API Industry Sector
- February 2024: The GSMA Open Gateway initiative gains significant traction, with 47 mobile operator groups representing 65% of global connections joining.
- March 2024: Comviva's contribution to 5G-driven API expansion supports telecom monetization strategies.
In-Depth Telecom API Industry Market Outlook
The Telecom API market is poised for sustained growth, driven by ongoing technological advancements, increasing digital adoption, and the expansion of 5G networks. Strategic partnerships, coupled with a focus on enhancing security and interoperability, will shape future market dynamics. Emerging applications in IoT and AI will unlock new opportunities, while a focus on personalized services will be crucial for success. The market exhibits strong potential for further expansion and consolidation, presenting attractive opportunities for both established players and new entrants.
Telecom API Industry Segmentation
-
1. Type of Service
- 1.1. Messaging API
- 1.2. IVR/Voice Store and Voice Control API
- 1.3. Payment API
- 1.4. WebRTC (Real-Time Connection) API
- 1.5. Location and Map API
- 1.6. Subscriber Identity Management and SSO API
- 1.7. Other Types of Service
-
2. Deployment Type
- 2.1. Hybrid
- 2.2. Multi-cloud
- 2.3. Other Deployment Types
-
3. End User
- 3.1. Enterprise Developer
- 3.2. Internal Telecom Developer
- 3.3. Partner Developer
- 3.4. Long Tail Developer
Telecom API Industry Segmentation By Geography
-
1. North America
- 1.1. United States
- 1.2. Canada
- 1.3. Mexico
-
2. Europe
- 2.1. Germany
- 2.2. United Kingdom
- 2.3. France
- 2.4. Italy
- 2.5. Spain
- 2.6. Rest of Europe
-
3. Asia Pacific
- 3.1. China
- 3.2. South Korea
- 3.3. Australia
- 3.4. New Zealand
- 3.5. India
- 3.6. Thailand
- 3.7. Singapore
- 3.8. Malaysia
- 3.9. Rest of Asia Pacific
-
4. Latin America
- 4.1. Brazil
- 4.2. Argentina
- 4.3. Rest of South America
-
5. Middle East and Africa
- 5.1. UAE
- 5.2. South Africa
- 5.3. Saudi Arabia
- 5.4. Rest Of MEA
Telecom API Industry REPORT HIGHLIGHTS
| Aspects | Details |
|---|---|
| Study Period | 2019-2033 |
| Base Year | 2024 |
| Estimated Year | 2025 |
| Forecast Period | 2025-2033 |
| Historical Period | 2019-2024 |
| Growth Rate | CAGR of 14.05% from 2019-2033 |
| Segmentation |
|
Table of Contents
- 1. Introduction
- 1.1. Research Scope
- 1.2. Market Segmentation
- 1.3. Research Methodology
- 1.4. Definitions and Assumptions
- 2. Executive Summary
- 2.1. Introduction
- 3. Market Dynamics
- 3.1. Introduction
- 3.2. Market Drivers
- 3.2.1. Increasing Demand for Mobile Data and the Rise of Digital Communication; Advent of 5G technology
- 3.3. Market Restrains
- 3.3.1. Lack of Awareness of Security Services is Discouraging the Market Expansion
- 3.4. Market Trends
- 3.4.1. Hybrid Segment to Hold Considerable Market Shares
- 4. Market Factor Analysis
- 4.1. Porters Five Forces
- 4.2. Supply/Value Chain
- 4.3. PESTEL analysis
- 4.4. Market Entropy
- 4.5. Patent/Trademark Analysis
- 5. Global Telecom API Industry Analysis, Insights and Forecast, 2019-2031
- 5.1. Market Analysis, Insights and Forecast - by Type of Service
- 5.1.1. Messaging API
- 5.1.2. IVR/Voice Store and Voice Control API
- 5.1.3. Payment API
- 5.1.4. WebRTC (Real-Time Connection) API
- 5.1.5. Location and Map API
- 5.1.6. Subscriber Identity Management and SSO API
- 5.1.7. Other Types of Service
- 5.2. Market Analysis, Insights and Forecast - by Deployment Type
- 5.2.1. Hybrid
- 5.2.2. Multi-cloud
- 5.2.3. Other Deployment Types
- 5.3. Market Analysis, Insights and Forecast - by End User
- 5.3.1. Enterprise Developer
- 5.3.2. Internal Telecom Developer
- 5.3.3. Partner Developer
- 5.3.4. Long Tail Developer
- 5.4. Market Analysis, Insights and Forecast - by Region
- 5.4.1. North America
- 5.4.2. Europe
- 5.4.3. Asia Pacific
- 5.4.4. Latin America
- 5.4.5. Middle East and Africa
- 5.1. Market Analysis, Insights and Forecast - by Type of Service
- 6. North America Telecom API Industry Analysis, Insights and Forecast, 2019-2031
- 6.1. Market Analysis, Insights and Forecast - by Type of Service
- 6.1.1. Messaging API
- 6.1.2. IVR/Voice Store and Voice Control API
- 6.1.3. Payment API
- 6.1.4. WebRTC (Real-Time Connection) API
- 6.1.5. Location and Map API
- 6.1.6. Subscriber Identity Management and SSO API
- 6.1.7. Other Types of Service
- 6.2. Market Analysis, Insights and Forecast - by Deployment Type
- 6.2.1. Hybrid
- 6.2.2. Multi-cloud
- 6.2.3. Other Deployment Types
- 6.3. Market Analysis, Insights and Forecast - by End User
- 6.3.1. Enterprise Developer
- 6.3.2. Internal Telecom Developer
- 6.3.3. Partner Developer
- 6.3.4. Long Tail Developer
- 6.1. Market Analysis, Insights and Forecast - by Type of Service
- 7. Europe Telecom API Industry Analysis, Insights and Forecast, 2019-2031
- 7.1. Market Analysis, Insights and Forecast - by Type of Service
- 7.1.1. Messaging API
- 7.1.2. IVR/Voice Store and Voice Control API
- 7.1.3. Payment API
- 7.1.4. WebRTC (Real-Time Connection) API
- 7.1.5. Location and Map API
- 7.1.6. Subscriber Identity Management and SSO API
- 7.1.7. Other Types of Service
- 7.2. Market Analysis, Insights and Forecast - by Deployment Type
- 7.2.1. Hybrid
- 7.2.2. Multi-cloud
- 7.2.3. Other Deployment Types
- 7.3. Market Analysis, Insights and Forecast - by End User
- 7.3.1. Enterprise Developer
- 7.3.2. Internal Telecom Developer
- 7.3.3. Partner Developer
- 7.3.4. Long Tail Developer
- 7.1. Market Analysis, Insights and Forecast - by Type of Service
- 8. Asia Pacific Telecom API Industry Analysis, Insights and Forecast, 2019-2031
- 8.1. Market Analysis, Insights and Forecast - by Type of Service
- 8.1.1. Messaging API
- 8.1.2. IVR/Voice Store and Voice Control API
- 8.1.3. Payment API
- 8.1.4. WebRTC (Real-Time Connection) API
- 8.1.5. Location and Map API
- 8.1.6. Subscriber Identity Management and SSO API
- 8.1.7. Other Types of Service
- 8.2. Market Analysis, Insights and Forecast - by Deployment Type
- 8.2.1. Hybrid
- 8.2.2. Multi-cloud
- 8.2.3. Other Deployment Types
- 8.3. Market Analysis, Insights and Forecast - by End User
- 8.3.1. Enterprise Developer
- 8.3.2. Internal Telecom Developer
- 8.3.3. Partner Developer
- 8.3.4. Long Tail Developer
- 8.1. Market Analysis, Insights and Forecast - by Type of Service
- 9. Latin America Telecom API Industry Analysis, Insights and Forecast, 2019-2031
- 9.1. Market Analysis, Insights and Forecast - by Type of Service
- 9.1.1. Messaging API
- 9.1.2. IVR/Voice Store and Voice Control API
- 9.1.3. Payment API
- 9.1.4. WebRTC (Real-Time Connection) API
- 9.1.5. Location and Map API
- 9.1.6. Subscriber Identity Management and SSO API
- 9.1.7. Other Types of Service
- 9.2. Market Analysis, Insights and Forecast - by Deployment Type
- 9.2.1. Hybrid
- 9.2.2. Multi-cloud
- 9.2.3. Other Deployment Types
- 9.3. Market Analysis, Insights and Forecast - by End User
- 9.3.1. Enterprise Developer
- 9.3.2. Internal Telecom Developer
- 9.3.3. Partner Developer
- 9.3.4. Long Tail Developer
- 9.1. Market Analysis, Insights and Forecast - by Type of Service
- 10. Middle East and Africa Telecom API Industry Analysis, Insights and Forecast, 2019-2031
- 10.1. Market Analysis, Insights and Forecast - by Type of Service
- 10.1.1. Messaging API
- 10.1.2. IVR/Voice Store and Voice Control API
- 10.1.3. Payment API
- 10.1.4. WebRTC (Real-Time Connection) API
- 10.1.5. Location and Map API
- 10.1.6. Subscriber Identity Management and SSO API
- 10.1.7. Other Types of Service
- 10.2. Market Analysis, Insights and Forecast - by Deployment Type
- 10.2.1. Hybrid
- 10.2.2. Multi-cloud
- 10.2.3. Other Deployment Types
- 10.3. Market Analysis, Insights and Forecast - by End User
- 10.3.1. Enterprise Developer
- 10.3.2. Internal Telecom Developer
- 10.3.3. Partner Developer
- 10.3.4. Long Tail Developer
- 10.1. Market Analysis, Insights and Forecast - by Type of Service
- 11. North America Telecom API Industry Analysis, Insights and Forecast, 2019-2031
- 11.1. Market Analysis, Insights and Forecast - By Country/Sub-region
- 11.1.1 United States
- 11.1.2 Canada
- 11.1.3 Mexico
- 12. Europe Telecom API Industry Analysis, Insights and Forecast, 2019-2031
- 12.1. Market Analysis, Insights and Forecast - By Country/Sub-region
- 12.1.1 Germany
- 12.1.2 United Kingdom
- 12.1.3 France
- 12.1.4 Spain
- 12.1.5 Italy
- 12.1.6 Spain
- 12.1.7 Belgium
- 12.1.8 Netherland
- 12.1.9 Nordics
- 12.1.10 Rest of Europe
- 13. Asia Pacific Telecom API Industry Analysis, Insights and Forecast, 2019-2031
- 13.1. Market Analysis, Insights and Forecast - By Country/Sub-region
- 13.1.1 China
- 13.1.2 Japan
- 13.1.3 India
- 13.1.4 South Korea
- 13.1.5 Southeast Asia
- 13.1.6 Australia
- 13.1.7 Indonesia
- 13.1.8 Phillipes
- 13.1.9 Singapore
- 13.1.10 Thailandc
- 13.1.11 Rest of Asia Pacific
- 14. South America Telecom API Industry Analysis, Insights and Forecast, 2019-2031
- 14.1. Market Analysis, Insights and Forecast - By Country/Sub-region
- 14.1.1 Brazil
- 14.1.2 Argentina
- 14.1.3 Peru
- 14.1.4 Chile
- 14.1.5 Colombia
- 14.1.6 Ecuador
- 14.1.7 Venezuela
- 14.1.8 Rest of South America
- 15. North America Telecom API Industry Analysis, Insights and Forecast, 2019-2031
- 15.1. Market Analysis, Insights and Forecast - By Country/Sub-region
- 15.1.1 United States
- 15.1.2 Canada
- 15.1.3 Mexico
- 16. MEA Telecom API Industry Analysis, Insights and Forecast, 2019-2031
- 16.1. Market Analysis, Insights and Forecast - By Country/Sub-region
- 16.1.1 United Arab Emirates
- 16.1.2 Saudi Arabia
- 16.1.3 South Africa
- 16.1.4 Rest of Middle East and Africa
- 17. Competitive Analysis
- 17.1. Global Market Share Analysis 2024
- 17.2. Company Profiles
- 17.2.1 Sinch (CLX Communication)
- 17.2.1.1. Overview
- 17.2.1.2. Products
- 17.2.1.3. SWOT Analysis
- 17.2.1.4. Recent Developments
- 17.2.1.5. Financials (Based on Availability)
- 17.2.2 Orange SA
- 17.2.2.1. Overview
- 17.2.2.2. Products
- 17.2.2.3. SWOT Analysis
- 17.2.2.4. Recent Developments
- 17.2.2.5. Financials (Based on Availability)
- 17.2.3 Telefonaktiebolaget LM Ericsson
- 17.2.3.1. Overview
- 17.2.3.2. Products
- 17.2.3.3. SWOT Analysis
- 17.2.3.4. Recent Developments
- 17.2.3.5. Financials (Based on Availability)
- 17.2.4 Vodafone Group
- 17.2.4.1. Overview
- 17.2.4.2. Products
- 17.2.4.3. SWOT Analysis
- 17.2.4.4. Recent Developments
- 17.2.4.5. Financials (Based on Availability)
- 17.2.5 Infobip Ltd
- 17.2.5.1. Overview
- 17.2.5.2. Products
- 17.2.5.3. SWOT Analysis
- 17.2.5.4. Recent Developments
- 17.2.5.5. Financials (Based on Availability)
- 17.2.6 Cisco Systems Inc
- 17.2.6.1. Overview
- 17.2.6.2. Products
- 17.2.6.3. SWOT Analysis
- 17.2.6.4. Recent Developments
- 17.2.6.5. Financials (Based on Availability)
- 17.2.7 Verizon Communications Inc
- 17.2.7.1. Overview
- 17.2.7.2. Products
- 17.2.7.3. SWOT Analysis
- 17.2.7.4. Recent Developments
- 17.2.7.5. Financials (Based on Availability)
- 17.2.8 Twilio Inc
- 17.2.8.1. Overview
- 17.2.8.2. Products
- 17.2.8.3. SWOT Analysis
- 17.2.8.4. Recent Developments
- 17.2.8.5. Financials (Based on Availability)
- 17.2.9 Ribbon Communications
- 17.2.9.1. Overview
- 17.2.9.2. Products
- 17.2.9.3. SWOT Analysis
- 17.2.9.4. Recent Developments
- 17.2.9.5. Financials (Based on Availability)
- 17.2.10 Noki
- 17.2.10.1. Overview
- 17.2.10.2. Products
- 17.2.10.3. SWOT Analysis
- 17.2.10.4. Recent Developments
- 17.2.10.5. Financials (Based on Availability)
- 17.2.11 Deutsche Telekom AG
- 17.2.11.1. Overview
- 17.2.11.2. Products
- 17.2.11.3. SWOT Analysis
- 17.2.11.4. Recent Developments
- 17.2.11.5. Financials (Based on Availability)
- 17.2.12 Google LLC (Apigee Corporation)
- 17.2.12.1. Overview
- 17.2.12.2. Products
- 17.2.12.3. SWOT Analysis
- 17.2.12.4. Recent Developments
- 17.2.12.5. Financials (Based on Availability)
- 17.2.13 Huawei Technologies Co Ltd
- 17.2.13.1. Overview
- 17.2.13.2. Products
- 17.2.13.3. SWOT Analysis
- 17.2.13.4. Recent Developments
- 17.2.13.5. Financials (Based on Availability)
- 17.2.14 AT&T Inc
- 17.2.14.1. Overview
- 17.2.14.2. Products
- 17.2.14.3. SWOT Analysis
- 17.2.14.4. Recent Developments
- 17.2.14.5. Financials (Based on Availability)
- 17.2.15 Telefonica SA
- 17.2.15.1. Overview
- 17.2.15.2. Products
- 17.2.15.3. SWOT Analysis
- 17.2.15.4. Recent Developments
- 17.2.15.5. Financials (Based on Availability)
- 17.2.1 Sinch (CLX Communication)
List of Figures
- Figure 1: Global Telecom API Industry Revenue Breakdown (Million, %) by Region 2024 & 2032
- Figure 2: Global Telecom API Industry Volume Breakdown (K Unit, %) by Region 2024 & 2032
- Figure 3: North America Telecom API Industry Revenue (Million), by Country 2024 & 2032
- Figure 4: North America Telecom API Industry Volume (K Unit), by Country 2024 & 2032
- Figure 5: North America Telecom API Industry Revenue Share (%), by Country 2024 & 2032
- Figure 6: North America Telecom API Industry Volume Share (%), by Country 2024 & 2032
- Figure 7: Europe Telecom API Industry Revenue (Million), by Country 2024 & 2032
- Figure 8: Europe Telecom API Industry Volume (K Unit), by Country 2024 & 2032
- Figure 9: Europe Telecom API Industry Revenue Share (%), by Country 2024 & 2032
- Figure 10: Europe Telecom API Industry Volume Share (%), by Country 2024 & 2032
- Figure 11: Asia Pacific Telecom API Industry Revenue (Million), by Country 2024 & 2032
- Figure 12: Asia Pacific Telecom API Industry Volume (K Unit), by Country 2024 & 2032
- Figure 13: Asia Pacific Telecom API Industry Revenue Share (%), by Country 2024 & 2032
- Figure 14: Asia Pacific Telecom API Industry Volume Share (%), by Country 2024 & 2032
- Figure 15: South America Telecom API Industry Revenue (Million), by Country 2024 & 2032
- Figure 16: South America Telecom API Industry Volume (K Unit), by Country 2024 & 2032
- Figure 17: South America Telecom API Industry Revenue Share (%), by Country 2024 & 2032
- Figure 18: South America Telecom API Industry Volume Share (%), by Country 2024 & 2032
- Figure 19: North America Telecom API Industry Revenue (Million), by Country 2024 & 2032
- Figure 20: North America Telecom API Industry Volume (K Unit), by Country 2024 & 2032
- Figure 21: North America Telecom API Industry Revenue Share (%), by Country 2024 & 2032
- Figure 22: North America Telecom API Industry Volume Share (%), by Country 2024 & 2032
- Figure 23: MEA Telecom API Industry Revenue (Million), by Country 2024 & 2032
- Figure 24: MEA Telecom API Industry Volume (K Unit), by Country 2024 & 2032
- Figure 25: MEA Telecom API Industry Revenue Share (%), by Country 2024 & 2032
- Figure 26: MEA Telecom API Industry Volume Share (%), by Country 2024 & 2032
- Figure 27: North America Telecom API Industry Revenue (Million), by Type of Service 2024 & 2032
- Figure 28: North America Telecom API Industry Volume (K Unit), by Type of Service 2024 & 2032
- Figure 29: North America Telecom API Industry Revenue Share (%), by Type of Service 2024 & 2032
- Figure 30: North America Telecom API Industry Volume Share (%), by Type of Service 2024 & 2032
- Figure 31: North America Telecom API Industry Revenue (Million), by Deployment Type 2024 & 2032
- Figure 32: North America Telecom API Industry Volume (K Unit), by Deployment Type 2024 & 2032
- Figure 33: North America Telecom API Industry Revenue Share (%), by Deployment Type 2024 & 2032
- Figure 34: North America Telecom API Industry Volume Share (%), by Deployment Type 2024 & 2032
- Figure 35: North America Telecom API Industry Revenue (Million), by End User 2024 & 2032
- Figure 36: North America Telecom API Industry Volume (K Unit), by End User 2024 & 2032
- Figure 37: North America Telecom API Industry Revenue Share (%), by End User 2024 & 2032
- Figure 38: North America Telecom API Industry Volume Share (%), by End User 2024 & 2032
- Figure 39: North America Telecom API Industry Revenue (Million), by Country 2024 & 2032
- Figure 40: North America Telecom API Industry Volume (K Unit), by Country 2024 & 2032
- Figure 41: North America Telecom API Industry Revenue Share (%), by Country 2024 & 2032
- Figure 42: North America Telecom API Industry Volume Share (%), by Country 2024 & 2032
- Figure 43: Europe Telecom API Industry Revenue (Million), by Type of Service 2024 & 2032
- Figure 44: Europe Telecom API Industry Volume (K Unit), by Type of Service 2024 & 2032
- Figure 45: Europe Telecom API Industry Revenue Share (%), by Type of Service 2024 & 2032
- Figure 46: Europe Telecom API Industry Volume Share (%), by Type of Service 2024 & 2032
- Figure 47: Europe Telecom API Industry Revenue (Million), by Deployment Type 2024 & 2032
- Figure 48: Europe Telecom API Industry Volume (K Unit), by Deployment Type 2024 & 2032
- Figure 49: Europe Telecom API Industry Revenue Share (%), by Deployment Type 2024 & 2032
- Figure 50: Europe Telecom API Industry Volume Share (%), by Deployment Type 2024 & 2032
- Figure 51: Europe Telecom API Industry Revenue (Million), by End User 2024 & 2032
- Figure 52: Europe Telecom API Industry Volume (K Unit), by End User 2024 & 2032
- Figure 53: Europe Telecom API Industry Revenue Share (%), by End User 2024 & 2032
- Figure 54: Europe Telecom API Industry Volume Share (%), by End User 2024 & 2032
- Figure 55: Europe Telecom API Industry Revenue (Million), by Country 2024 & 2032
- Figure 56: Europe Telecom API Industry Volume (K Unit), by Country 2024 & 2032
- Figure 57: Europe Telecom API Industry Revenue Share (%), by Country 2024 & 2032
- Figure 58: Europe Telecom API Industry Volume Share (%), by Country 2024 & 2032
- Figure 59: Asia Pacific Telecom API Industry Revenue (Million), by Type of Service 2024 & 2032
- Figure 60: Asia Pacific Telecom API Industry Volume (K Unit), by Type of Service 2024 & 2032
- Figure 61: Asia Pacific Telecom API Industry Revenue Share (%), by Type of Service 2024 & 2032
- Figure 62: Asia Pacific Telecom API Industry Volume Share (%), by Type of Service 2024 & 2032
- Figure 63: Asia Pacific Telecom API Industry Revenue (Million), by Deployment Type 2024 & 2032
- Figure 64: Asia Pacific Telecom API Industry Volume (K Unit), by Deployment Type 2024 & 2032
- Figure 65: Asia Pacific Telecom API Industry Revenue Share (%), by Deployment Type 2024 & 2032
- Figure 66: Asia Pacific Telecom API Industry Volume Share (%), by Deployment Type 2024 & 2032
- Figure 67: Asia Pacific Telecom API Industry Revenue (Million), by End User 2024 & 2032
- Figure 68: Asia Pacific Telecom API Industry Volume (K Unit), by End User 2024 & 2032
- Figure 69: Asia Pacific Telecom API Industry Revenue Share (%), by End User 2024 & 2032
- Figure 70: Asia Pacific Telecom API Industry Volume Share (%), by End User 2024 & 2032
- Figure 71: Asia Pacific Telecom API Industry Revenue (Million), by Country 2024 & 2032
- Figure 72: Asia Pacific Telecom API Industry Volume (K Unit), by Country 2024 & 2032
- Figure 73: Asia Pacific Telecom API Industry Revenue Share (%), by Country 2024 & 2032
- Figure 74: Asia Pacific Telecom API Industry Volume Share (%), by Country 2024 & 2032
- Figure 75: Latin America Telecom API Industry Revenue (Million), by Type of Service 2024 & 2032
- Figure 76: Latin America Telecom API Industry Volume (K Unit), by Type of Service 2024 & 2032
- Figure 77: Latin America Telecom API Industry Revenue Share (%), by Type of Service 2024 & 2032
- Figure 78: Latin America Telecom API Industry Volume Share (%), by Type of Service 2024 & 2032
- Figure 79: Latin America Telecom API Industry Revenue (Million), by Deployment Type 2024 & 2032
- Figure 80: Latin America Telecom API Industry Volume (K Unit), by Deployment Type 2024 & 2032
- Figure 81: Latin America Telecom API Industry Revenue Share (%), by Deployment Type 2024 & 2032
- Figure 82: Latin America Telecom API Industry Volume Share (%), by Deployment Type 2024 & 2032
- Figure 83: Latin America Telecom API Industry Revenue (Million), by End User 2024 & 2032
- Figure 84: Latin America Telecom API Industry Volume (K Unit), by End User 2024 & 2032
- Figure 85: Latin America Telecom API Industry Revenue Share (%), by End User 2024 & 2032
- Figure 86: Latin America Telecom API Industry Volume Share (%), by End User 2024 & 2032
- Figure 87: Latin America Telecom API Industry Revenue (Million), by Country 2024 & 2032
- Figure 88: Latin America Telecom API Industry Volume (K Unit), by Country 2024 & 2032
- Figure 89: Latin America Telecom API Industry Revenue Share (%), by Country 2024 & 2032
- Figure 90: Latin America Telecom API Industry Volume Share (%), by Country 2024 & 2032
- Figure 91: Middle East and Africa Telecom API Industry Revenue (Million), by Type of Service 2024 & 2032
- Figure 92: Middle East and Africa Telecom API Industry Volume (K Unit), by Type of Service 2024 & 2032
- Figure 93: Middle East and Africa Telecom API Industry Revenue Share (%), by Type of Service 2024 & 2032
- Figure 94: Middle East and Africa Telecom API Industry Volume Share (%), by Type of Service 2024 & 2032
- Figure 95: Middle East and Africa Telecom API Industry Revenue (Million), by Deployment Type 2024 & 2032
- Figure 96: Middle East and Africa Telecom API Industry Volume (K Unit), by Deployment Type 2024 & 2032
- Figure 97: Middle East and Africa Telecom API Industry Revenue Share (%), by Deployment Type 2024 & 2032
- Figure 98: Middle East and Africa Telecom API Industry Volume Share (%), by Deployment Type 2024 & 2032
- Figure 99: Middle East and Africa Telecom API Industry Revenue (Million), by End User 2024 & 2032
- Figure 100: Middle East and Africa Telecom API Industry Volume (K Unit), by End User 2024 & 2032
- Figure 101: Middle East and Africa Telecom API Industry Revenue Share (%), by End User 2024 & 2032
- Figure 102: Middle East and Africa Telecom API Industry Volume Share (%), by End User 2024 & 2032
- Figure 103: Middle East and Africa Telecom API Industry Revenue (Million), by Country 2024 & 2032
- Figure 104: Middle East and Africa Telecom API Industry Volume (K Unit), by Country 2024 & 2032
- Figure 105: Middle East and Africa Telecom API Industry Revenue Share (%), by Country 2024 & 2032
- Figure 106: Middle East and Africa Telecom API Industry Volume Share (%), by Country 2024 & 2032
List of Tables
- Table 1: Global Telecom API Industry Revenue Million Forecast, by Region 2019 & 2032
- Table 2: Global Telecom API Industry Volume K Unit Forecast, by Region 2019 & 2032
- Table 3: Global Telecom API Industry Revenue Million Forecast, by Type of Service 2019 & 2032
- Table 4: Global Telecom API Industry Volume K Unit Forecast, by Type of Service 2019 & 2032
- Table 5: Global Telecom API Industry Revenue Million Forecast, by Deployment Type 2019 & 2032
- Table 6: Global Telecom API Industry Volume K Unit Forecast, by Deployment Type 2019 & 2032
- Table 7: Global Telecom API Industry Revenue Million Forecast, by End User 2019 & 2032
- Table 8: Global Telecom API Industry Volume K Unit Forecast, by End User 2019 & 2032
- Table 9: Global Telecom API Industry Revenue Million Forecast, by Region 2019 & 2032
- Table 10: Global Telecom API Industry Volume K Unit Forecast, by Region 2019 & 2032
- Table 11: Global Telecom API Industry Revenue Million Forecast, by Country 2019 & 2032
- Table 12: Global Telecom API Industry Volume K Unit Forecast, by Country 2019 & 2032
- Table 13: United States Telecom API Industry Revenue (Million) Forecast, by Application 2019 & 2032
- Table 14: United States Telecom API Industry Volume (K Unit) Forecast, by Application 2019 & 2032
- Table 15: Canada Telecom API Industry Revenue (Million) Forecast, by Application 2019 & 2032
- Table 16: Canada Telecom API Industry Volume (K Unit) Forecast, by Application 2019 & 2032
- Table 17: Mexico Telecom API Industry Revenue (Million) Forecast, by Application 2019 & 2032
- Table 18: Mexico Telecom API Industry Volume (K Unit) Forecast, by Application 2019 & 2032
- Table 19: Global Telecom API Industry Revenue Million Forecast, by Country 2019 & 2032
- Table 20: Global Telecom API Industry Volume K Unit Forecast, by Country 2019 & 2032
- Table 21: Germany Telecom API Industry Revenue (Million) Forecast, by Application 2019 & 2032
- Table 22: Germany Telecom API Industry Volume (K Unit) Forecast, by Application 2019 & 2032
- Table 23: United Kingdom Telecom API Industry Revenue (Million) Forecast, by Application 2019 & 2032
- Table 24: United Kingdom Telecom API Industry Volume (K Unit) Forecast, by Application 2019 & 2032
- Table 25: France Telecom API Industry Revenue (Million) Forecast, by Application 2019 & 2032
- Table 26: France Telecom API Industry Volume (K Unit) Forecast, by Application 2019 & 2032
- Table 27: Spain Telecom API Industry Revenue (Million) Forecast, by Application 2019 & 2032
- Table 28: Spain Telecom API Industry Volume (K Unit) Forecast, by Application 2019 & 2032
- Table 29: Italy Telecom API Industry Revenue (Million) Forecast, by Application 2019 & 2032
- Table 30: Italy Telecom API Industry Volume (K Unit) Forecast, by Application 2019 & 2032
- Table 31: Spain Telecom API Industry Revenue (Million) Forecast, by Application 2019 & 2032
- Table 32: Spain Telecom API Industry Volume (K Unit) Forecast, by Application 2019 & 2032
- Table 33: Belgium Telecom API Industry Revenue (Million) Forecast, by Application 2019 & 2032
- Table 34: Belgium Telecom API Industry Volume (K Unit) Forecast, by Application 2019 & 2032
- Table 35: Netherland Telecom API Industry Revenue (Million) Forecast, by Application 2019 & 2032
- Table 36: Netherland Telecom API Industry Volume (K Unit) Forecast, by Application 2019 & 2032
- Table 37: Nordics Telecom API Industry Revenue (Million) Forecast, by Application 2019 & 2032
- Table 38: Nordics Telecom API Industry Volume (K Unit) Forecast, by Application 2019 & 2032
- Table 39: Rest of Europe Telecom API Industry Revenue (Million) Forecast, by Application 2019 & 2032
- Table 40: Rest of Europe Telecom API Industry Volume (K Unit) Forecast, by Application 2019 & 2032
- Table 41: Global Telecom API Industry Revenue Million Forecast, by Country 2019 & 2032
- Table 42: Global Telecom API Industry Volume K Unit Forecast, by Country 2019 & 2032
- Table 43: China Telecom API Industry Revenue (Million) Forecast, by Application 2019 & 2032
- Table 44: China Telecom API Industry Volume (K Unit) Forecast, by Application 2019 & 2032
- Table 45: Japan Telecom API Industry Revenue (Million) Forecast, by Application 2019 & 2032
- Table 46: Japan Telecom API Industry Volume (K Unit) Forecast, by Application 2019 & 2032
- Table 47: India Telecom API Industry Revenue (Million) Forecast, by Application 2019 & 2032
- Table 48: India Telecom API Industry Volume (K Unit) Forecast, by Application 2019 & 2032
- Table 49: South Korea Telecom API Industry Revenue (Million) Forecast, by Application 2019 & 2032
- Table 50: South Korea Telecom API Industry Volume (K Unit) Forecast, by Application 2019 & 2032
- Table 51: Southeast Asia Telecom API Industry Revenue (Million) Forecast, by Application 2019 & 2032
- Table 52: Southeast Asia Telecom API Industry Volume (K Unit) Forecast, by Application 2019 & 2032
- Table 53: Australia Telecom API Industry Revenue (Million) Forecast, by Application 2019 & 2032
- Table 54: Australia Telecom API Industry Volume (K Unit) Forecast, by Application 2019 & 2032
- Table 55: Indonesia Telecom API Industry Revenue (Million) Forecast, by Application 2019 & 2032
- Table 56: Indonesia Telecom API Industry Volume (K Unit) Forecast, by Application 2019 & 2032
- Table 57: Phillipes Telecom API Industry Revenue (Million) Forecast, by Application 2019 & 2032
- Table 58: Phillipes Telecom API Industry Volume (K Unit) Forecast, by Application 2019 & 2032
- Table 59: Singapore Telecom API Industry Revenue (Million) Forecast, by Application 2019 & 2032
- Table 60: Singapore Telecom API Industry Volume (K Unit) Forecast, by Application 2019 & 2032
- Table 61: Thailandc Telecom API Industry Revenue (Million) Forecast, by Application 2019 & 2032
- Table 62: Thailandc Telecom API Industry Volume (K Unit) Forecast, by Application 2019 & 2032
- Table 63: Rest of Asia Pacific Telecom API Industry Revenue (Million) Forecast, by Application 2019 & 2032
- Table 64: Rest of Asia Pacific Telecom API Industry Volume (K Unit) Forecast, by Application 2019 & 2032
- Table 65: Global Telecom API Industry Revenue Million Forecast, by Country 2019 & 2032
- Table 66: Global Telecom API Industry Volume K Unit Forecast, by Country 2019 & 2032
- Table 67: Brazil Telecom API Industry Revenue (Million) Forecast, by Application 2019 & 2032
- Table 68: Brazil Telecom API Industry Volume (K Unit) Forecast, by Application 2019 & 2032
- Table 69: Argentina Telecom API Industry Revenue (Million) Forecast, by Application 2019 & 2032
- Table 70: Argentina Telecom API Industry Volume (K Unit) Forecast, by Application 2019 & 2032
- Table 71: Peru Telecom API Industry Revenue (Million) Forecast, by Application 2019 & 2032
- Table 72: Peru Telecom API Industry Volume (K Unit) Forecast, by Application 2019 & 2032
- Table 73: Chile Telecom API Industry Revenue (Million) Forecast, by Application 2019 & 2032
- Table 74: Chile Telecom API Industry Volume (K Unit) Forecast, by Application 2019 & 2032
- Table 75: Colombia Telecom API Industry Revenue (Million) Forecast, by Application 2019 & 2032
- Table 76: Colombia Telecom API Industry Volume (K Unit) Forecast, by Application 2019 & 2032
- Table 77: Ecuador Telecom API Industry Revenue (Million) Forecast, by Application 2019 & 2032
- Table 78: Ecuador Telecom API Industry Volume (K Unit) Forecast, by Application 2019 & 2032
- Table 79: Venezuela Telecom API Industry Revenue (Million) Forecast, by Application 2019 & 2032
- Table 80: Venezuela Telecom API Industry Volume (K Unit) Forecast, by Application 2019 & 2032
- Table 81: Rest of South America Telecom API Industry Revenue (Million) Forecast, by Application 2019 & 2032
- Table 82: Rest of South America Telecom API Industry Volume (K Unit) Forecast, by Application 2019 & 2032
- Table 83: Global Telecom API Industry Revenue Million Forecast, by Country 2019 & 2032
- Table 84: Global Telecom API Industry Volume K Unit Forecast, by Country 2019 & 2032
- Table 85: United States Telecom API Industry Revenue (Million) Forecast, by Application 2019 & 2032
- Table 86: United States Telecom API Industry Volume (K Unit) Forecast, by Application 2019 & 2032
- Table 87: Canada Telecom API Industry Revenue (Million) Forecast, by Application 2019 & 2032
- Table 88: Canada Telecom API Industry Volume (K Unit) Forecast, by Application 2019 & 2032
- Table 89: Mexico Telecom API Industry Revenue (Million) Forecast, by Application 2019 & 2032
- Table 90: Mexico Telecom API Industry Volume (K Unit) Forecast, by Application 2019 & 2032
- Table 91: Global Telecom API Industry Revenue Million Forecast, by Country 2019 & 2032
- Table 92: Global Telecom API Industry Volume K Unit Forecast, by Country 2019 & 2032
- Table 93: United Arab Emirates Telecom API Industry Revenue (Million) Forecast, by Application 2019 & 2032
- Table 94: United Arab Emirates Telecom API Industry Volume (K Unit) Forecast, by Application 2019 & 2032
- Table 95: Saudi Arabia Telecom API Industry Revenue (Million) Forecast, by Application 2019 & 2032
- Table 96: Saudi Arabia Telecom API Industry Volume (K Unit) Forecast, by Application 2019 & 2032
- Table 97: South Africa Telecom API Industry Revenue (Million) Forecast, by Application 2019 & 2032
- Table 98: South Africa Telecom API Industry Volume (K Unit) Forecast, by Application 2019 & 2032
- Table 99: Rest of Middle East and Africa Telecom API Industry Revenue (Million) Forecast, by Application 2019 & 2032
- Table 100: Rest of Middle East and Africa Telecom API Industry Volume (K Unit) Forecast, by Application 2019 & 2032
- Table 101: Global Telecom API Industry Revenue Million Forecast, by Type of Service 2019 & 2032
- Table 102: Global Telecom API Industry Volume K Unit Forecast, by Type of Service 2019 & 2032
- Table 103: Global Telecom API Industry Revenue Million Forecast, by Deployment Type 2019 & 2032
- Table 104: Global Telecom API Industry Volume K Unit Forecast, by Deployment Type 2019 & 2032
- Table 105: Global Telecom API Industry Revenue Million Forecast, by End User 2019 & 2032
- Table 106: Global Telecom API Industry Volume K Unit Forecast, by End User 2019 & 2032
- Table 107: Global Telecom API Industry Revenue Million Forecast, by Country 2019 & 2032
- Table 108: Global Telecom API Industry Volume K Unit Forecast, by Country 2019 & 2032
- Table 109: United States Telecom API Industry Revenue (Million) Forecast, by Application 2019 & 2032
- Table 110: United States Telecom API Industry Volume (K Unit) Forecast, by Application 2019 & 2032
- Table 111: Canada Telecom API Industry Revenue (Million) Forecast, by Application 2019 & 2032
- Table 112: Canada Telecom API Industry Volume (K Unit) Forecast, by Application 2019 & 2032
- Table 113: Mexico Telecom API Industry Revenue (Million) Forecast, by Application 2019 & 2032
- Table 114: Mexico Telecom API Industry Volume (K Unit) Forecast, by Application 2019 & 2032
- Table 115: Global Telecom API Industry Revenue Million Forecast, by Type of Service 2019 & 2032
- Table 116: Global Telecom API Industry Volume K Unit Forecast, by Type of Service 2019 & 2032
- Table 117: Global Telecom API Industry Revenue Million Forecast, by Deployment Type 2019 & 2032
- Table 118: Global Telecom API Industry Volume K Unit Forecast, by Deployment Type 2019 & 2032
- Table 119: Global Telecom API Industry Revenue Million Forecast, by End User 2019 & 2032
- Table 120: Global Telecom API Industry Volume K Unit Forecast, by End User 2019 & 2032
- Table 121: Global Telecom API Industry Revenue Million Forecast, by Country 2019 & 2032
- Table 122: Global Telecom API Industry Volume K Unit Forecast, by Country 2019 & 2032
- Table 123: Germany Telecom API Industry Revenue (Million) Forecast, by Application 2019 & 2032
- Table 124: Germany Telecom API Industry Volume (K Unit) Forecast, by Application 2019 & 2032
- Table 125: United Kingdom Telecom API Industry Revenue (Million) Forecast, by Application 2019 & 2032
- Table 126: United Kingdom Telecom API Industry Volume (K Unit) Forecast, by Application 2019 & 2032
- Table 127: France Telecom API Industry Revenue (Million) Forecast, by Application 2019 & 2032
- Table 128: France Telecom API Industry Volume (K Unit) Forecast, by Application 2019 & 2032
- Table 129: Italy Telecom API Industry Revenue (Million) Forecast, by Application 2019 & 2032
- Table 130: Italy Telecom API Industry Volume (K Unit) Forecast, by Application 2019 & 2032
- Table 131: Spain Telecom API Industry Revenue (Million) Forecast, by Application 2019 & 2032
- Table 132: Spain Telecom API Industry Volume (K Unit) Forecast, by Application 2019 & 2032
- Table 133: Rest of Europe Telecom API Industry Revenue (Million) Forecast, by Application 2019 & 2032
- Table 134: Rest of Europe Telecom API Industry Volume (K Unit) Forecast, by Application 2019 & 2032
- Table 135: Global Telecom API Industry Revenue Million Forecast, by Type of Service 2019 & 2032
- Table 136: Global Telecom API Industry Volume K Unit Forecast, by Type of Service 2019 & 2032
- Table 137: Global Telecom API Industry Revenue Million Forecast, by Deployment Type 2019 & 2032
- Table 138: Global Telecom API Industry Volume K Unit Forecast, by Deployment Type 2019 & 2032
- Table 139: Global Telecom API Industry Revenue Million Forecast, by End User 2019 & 2032
- Table 140: Global Telecom API Industry Volume K Unit Forecast, by End User 2019 & 2032
- Table 141: Global Telecom API Industry Revenue Million Forecast, by Country 2019 & 2032
- Table 142: Global Telecom API Industry Volume K Unit Forecast, by Country 2019 & 2032
- Table 143: China Telecom API Industry Revenue (Million) Forecast, by Application 2019 & 2032
- Table 144: China Telecom API Industry Volume (K Unit) Forecast, by Application 2019 & 2032
- Table 145: South Korea Telecom API Industry Revenue (Million) Forecast, by Application 2019 & 2032
- Table 146: South Korea Telecom API Industry Volume (K Unit) Forecast, by Application 2019 & 2032
- Table 147: Australia Telecom API Industry Revenue (Million) Forecast, by Application 2019 & 2032
- Table 148: Australia Telecom API Industry Volume (K Unit) Forecast, by Application 2019 & 2032
- Table 149: New Zealand Telecom API Industry Revenue (Million) Forecast, by Application 2019 & 2032
- Table 150: New Zealand Telecom API Industry Volume (K Unit) Forecast, by Application 2019 & 2032
- Table 151: India Telecom API Industry Revenue (Million) Forecast, by Application 2019 & 2032
- Table 152: India Telecom API Industry Volume (K Unit) Forecast, by Application 2019 & 2032
- Table 153: Thailand Telecom API Industry Revenue (Million) Forecast, by Application 2019 & 2032
- Table 154: Thailand Telecom API Industry Volume (K Unit) Forecast, by Application 2019 & 2032
- Table 155: Singapore Telecom API Industry Revenue (Million) Forecast, by Application 2019 & 2032
- Table 156: Singapore Telecom API Industry Volume (K Unit) Forecast, by Application 2019 & 2032
- Table 157: Malaysia Telecom API Industry Revenue (Million) Forecast, by Application 2019 & 2032
- Table 158: Malaysia Telecom API Industry Volume (K Unit) Forecast, by Application 2019 & 2032
- Table 159: Rest of Asia Pacific Telecom API Industry Revenue (Million) Forecast, by Application 2019 & 2032
- Table 160: Rest of Asia Pacific Telecom API Industry Volume (K Unit) Forecast, by Application 2019 & 2032
- Table 161: Global Telecom API Industry Revenue Million Forecast, by Type of Service 2019 & 2032
- Table 162: Global Telecom API Industry Volume K Unit Forecast, by Type of Service 2019 & 2032
- Table 163: Global Telecom API Industry Revenue Million Forecast, by Deployment Type 2019 & 2032
- Table 164: Global Telecom API Industry Volume K Unit Forecast, by Deployment Type 2019 & 2032
- Table 165: Global Telecom API Industry Revenue Million Forecast, by End User 2019 & 2032
- Table 166: Global Telecom API Industry Volume K Unit Forecast, by End User 2019 & 2032
- Table 167: Global Telecom API Industry Revenue Million Forecast, by Country 2019 & 2032
- Table 168: Global Telecom API Industry Volume K Unit Forecast, by Country 2019 & 2032
- Table 169: Brazil Telecom API Industry Revenue (Million) Forecast, by Application 2019 & 2032
- Table 170: Brazil Telecom API Industry Volume (K Unit) Forecast, by Application 2019 & 2032
- Table 171: Argentina Telecom API Industry Revenue (Million) Forecast, by Application 2019 & 2032
- Table 172: Argentina Telecom API Industry Volume (K Unit) Forecast, by Application 2019 & 2032
- Table 173: Rest of South America Telecom API Industry Revenue (Million) Forecast, by Application 2019 & 2032
- Table 174: Rest of South America Telecom API Industry Volume (K Unit) Forecast, by Application 2019 & 2032
- Table 175: Global Telecom API Industry Revenue Million Forecast, by Type of Service 2019 & 2032
- Table 176: Global Telecom API Industry Volume K Unit Forecast, by Type of Service 2019 & 2032
- Table 177: Global Telecom API Industry Revenue Million Forecast, by Deployment Type 2019 & 2032
- Table 178: Global Telecom API Industry Volume K Unit Forecast, by Deployment Type 2019 & 2032
- Table 179: Global Telecom API Industry Revenue Million Forecast, by End User 2019 & 2032
- Table 180: Global Telecom API Industry Volume K Unit Forecast, by End User 2019 & 2032
- Table 181: Global Telecom API Industry Revenue Million Forecast, by Country 2019 & 2032
- Table 182: Global Telecom API Industry Volume K Unit Forecast, by Country 2019 & 2032
- Table 183: UAE Telecom API Industry Revenue (Million) Forecast, by Application 2019 & 2032
- Table 184: UAE Telecom API Industry Volume (K Unit) Forecast, by Application 2019 & 2032
- Table 185: South Africa Telecom API Industry Revenue (Million) Forecast, by Application 2019 & 2032
- Table 186: South Africa Telecom API Industry Volume (K Unit) Forecast, by Application 2019 & 2032
- Table 187: Saudi Arabia Telecom API Industry Revenue (Million) Forecast, by Application 2019 & 2032
- Table 188: Saudi Arabia Telecom API Industry Volume (K Unit) Forecast, by Application 2019 & 2032
- Table 189: Rest Of MEA Telecom API Industry Revenue (Million) Forecast, by Application 2019 & 2032
- Table 190: Rest Of MEA Telecom API Industry Volume (K Unit) Forecast, by Application 2019 & 2032
Frequently Asked Questions
1. What is the projected Compound Annual Growth Rate (CAGR) of the Telecom API Industry?
The projected CAGR is approximately 14.05%.
2. Which companies are prominent players in the Telecom API Industry?
Key companies in the market include Sinch (CLX Communication), Orange SA, Telefonaktiebolaget LM Ericsson, Vodafone Group, Infobip Ltd, Cisco Systems Inc, Verizon Communications Inc, Twilio Inc, Ribbon Communications, Noki, Deutsche Telekom AG, Google LLC (Apigee Corporation), Huawei Technologies Co Ltd, AT&T Inc, Telefonica SA.
3. What are the main segments of the Telecom API Industry?
The market segments include Type of Service, Deployment Type, End User.
4. Can you provide details about the market size?
The market size is estimated to be USD 312.83 Million as of 2022.
5. What are some drivers contributing to market growth?
Increasing Demand for Mobile Data and the Rise of Digital Communication; Advent of 5G technology.
6. What are the notable trends driving market growth?
Hybrid Segment to Hold Considerable Market Shares.
7. Are there any restraints impacting market growth?
Lack of Awareness of Security Services is Discouraging the Market Expansion.
8. Can you provide examples of recent developments in the market?
March 2024: Comviva, a provider of operations support systems (OSS) and business support systems (BSS), contributed to the expansion of application programming interfaces (APIs) driven by 5G, which is likely to help telecom operators monetize their fifth-generation networks.
9. What pricing options are available for accessing the report?
Pricing options include single-user, multi-user, and enterprise licenses priced at USD 4750, USD 5250, and USD 8750 respectively.
10. Is the market size provided in terms of value or volume?
The market size is provided in terms of value, measured in Million and volume, measured in K Unit.
11. Are there any specific market keywords associated with the report?
Yes, the market keyword associated with the report is "Telecom API Industry," which aids in identifying and referencing the specific market segment covered.
12. How do I determine which pricing option suits my needs best?
The pricing options vary based on user requirements and access needs. Individual users may opt for single-user licenses, while businesses requiring broader access may choose multi-user or enterprise licenses for cost-effective access to the report.
13. Are there any additional resources or data provided in the Telecom API Industry report?
While the report offers comprehensive insights, it's advisable to review the specific contents or supplementary materials provided to ascertain if additional resources or data are available.
14. How can I stay updated on further developments or reports in the Telecom API Industry?
To stay informed about further developments, trends, and reports in the Telecom API Industry, consider subscribing to industry newsletters, following relevant companies and organizations, or regularly checking reputable industry news sources and publications.
Methodology
Step 1 - Identification of Relevant Samples Size from Population Database


Step 2 - Approaches for Defining Global Market Size (Value, Volume* & Price*)

Note*: In applicable scenarios
Step 3 - Data Sources
Primary Research
- Web Analytics
- Survey Reports
- Research Institute
- Latest Research Reports
- Opinion Leaders
Secondary Research
- Annual Reports
- White Paper
- Latest Press Release
- Industry Association
- Paid Database
- Investor Presentations

Step 4 - Data Triangulation
Involves using different sources of information in order to increase the validity of a study
These sources are likely to be stakeholders in a program - participants, other researchers, program staff, other community members, and so on.
Then we put all data in single framework & apply various statistical tools to find out the dynamic on the market.
During the analysis stage, feedback from the stakeholder groups would be compared to determine areas of agreement as well as areas of divergence


