

Key Insights
The global Surgical Visualization Product market is poised for substantial growth, projected to reach USD 2.99 billion by 2025, with a robust Compound Annual Growth Rate (CAGR) of 10.7% during the forecast period of 2025-2033. This expansion is fueled by an increasing demand for minimally invasive surgical procedures, driven by benefits such as reduced patient recovery times, lower complication rates, and enhanced surgical precision. Advancements in imaging technologies, including high-definition cameras, 3D visualization, and integration with artificial intelligence, are further accelerating market adoption. The rising prevalence of chronic diseases and the aging global population contribute to a growing need for sophisticated surgical interventions, directly benefiting the surgical visualization market. Key applications such as laparoscopy, gastroscopy, and arthroscopy are witnessing significant uptake, supported by ongoing technological innovations and increased healthcare expenditure worldwide.
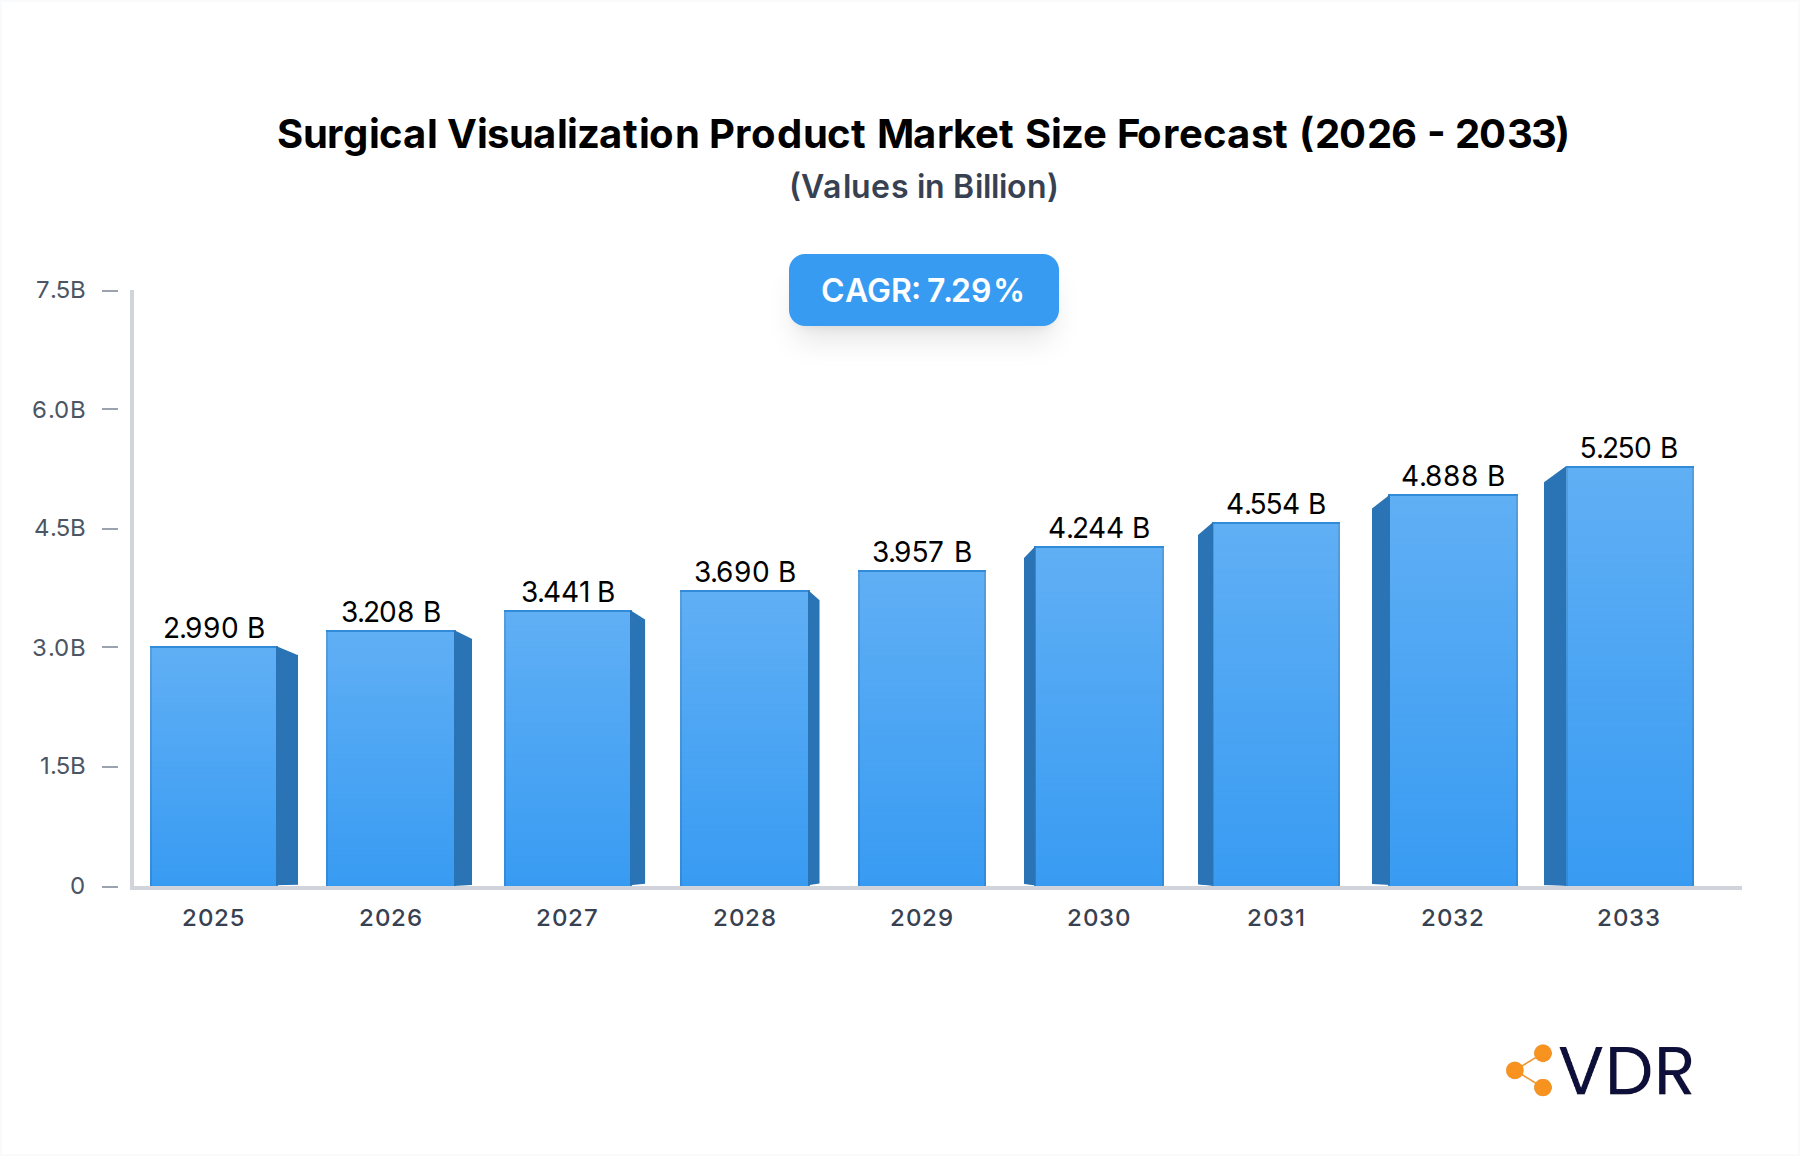
Surgical Visualization Product Market Size (In Billion)
The market is characterized by a competitive landscape with major players like Karl Storz GmbH, Medtronic, Boston Scientific, and Olympus, actively engaged in research and development to introduce next-generation visualization solutions. The development of integrated systems, encompassing endoscopic cameras, video recorders, processors, and accessories, caters to a diverse range of surgical specialties. Geographically, North America and Europe currently dominate the market due to advanced healthcare infrastructure and high adoption rates of cutting-edge medical technologies. However, the Asia Pacific region is emerging as a high-growth market, driven by a burgeoning patient base, increasing healthcare investments, and a growing emphasis on adopting advanced surgical techniques. Despite the strong growth trajectory, challenges such as the high cost of advanced visualization systems and the need for specialized training can pose some restraints, though these are being addressed through continuous product innovation and market penetration strategies.

Surgical Visualization Product Company Market Share
This in-depth report provides a thorough examination of the global Surgical Visualization Product market, offering critical insights for industry stakeholders. Spanning the historical period from 2019 to 2024 and projecting through 2033, with a base year of 2025, this analysis leverages extensive data to illuminate market dynamics, growth trends, regional dominance, product landscapes, and the strategic imperatives shaping the future of surgical visualization.
Surgical Visualization Product Market Dynamics & Structure
The Surgical Visualization Product market exhibits a moderately concentrated structure, with leading players like Karl Storz Gmbh, Medtronic, and Olympus commanding significant market share. Technological innovation remains a primary driver, fueled by advancements in high-definition imaging, 4K resolution, 3D visualization, and integration with artificial intelligence for enhanced diagnostic and surgical precision. The regulatory landscape, governed by bodies such as the FDA and EMA, influences product development and market entry, prioritizing patient safety and device efficacy. Competitive product substitutes, while limited in direct replacement for advanced visualization systems, exist in the form of legacy technologies and less sophisticated imaging solutions. End-user demographics are shifting towards an aging global population, increasing the demand for minimally invasive procedures, thereby driving the adoption of advanced surgical visualization tools. Mergers and acquisitions (M&A) are a recurring trend, with companies seeking to expand their product portfolios, gain access to new technologies, and consolidate market presence. For instance, the last five years have seen approximately 8-12 significant M&A deals impacting the surgical visualization space. Innovation barriers include high research and development costs, lengthy regulatory approval processes, and the need for substantial capital investment.
- Market Concentration: Dominated by a few key players with a significant share of the global market.
- Technological Innovation Drivers: HD imaging, 4K, 3D visualization, AI integration, miniaturization.
- Regulatory Frameworks: FDA, EMA, CE Mark, driving product safety and efficacy standards.
- Competitive Product Substitutes: Legacy imaging systems, less advanced visualization tools.
- End-User Demographics: Aging global population, increased demand for minimally invasive surgery.
- M&A Trends: Strategic acquisitions for portfolio expansion and market consolidation.
- Innovation Barriers: High R&D costs, regulatory hurdles, capital investment.
Surgical Visualization Product Growth Trends & Insights
The global Surgical Visualization Product market is poised for substantial growth, driven by a confluence of factors that are reshaping surgical practices worldwide. The market size, estimated to be $18.5 billion in 2025, is projected to reach $35.2 billion by 2033, exhibiting a Compound Annual Growth Rate (CAGR) of approximately 8.5% during the forecast period. This robust expansion is underpinned by escalating adoption rates of minimally invasive surgical techniques across a broad spectrum of medical disciplines. The inherent benefits of these procedures, including reduced patient trauma, shorter recovery times, and decreased hospital stays, are compelling healthcare providers to invest heavily in state-of-the-art visualization systems. Technological disruptions are at the forefront of this growth trajectory. The integration of artificial intelligence (AI) and machine learning (ML) into surgical visualization platforms is revolutionizing surgical planning, intraoperative guidance, and post-operative analysis. AI-powered systems can now provide real-time insights, identify critical anatomical structures, and even predict potential complications, thereby enhancing surgical precision and patient outcomes.
Furthermore, the increasing prevalence of chronic diseases and the growing demand for advanced diagnostic and therapeutic solutions are acting as significant catalysts. As global healthcare expenditures rise, particularly in emerging economies, there is a corresponding increase in investment in advanced medical infrastructure, including sophisticated surgical suites equipped with the latest visualization technologies. Consumer behavior shifts also play a crucial role. Patients are increasingly aware of and demanding less invasive treatment options, empowering them to seek out healthcare facilities that offer cutting-edge surgical capabilities. This growing patient preference directly influences hospital purchasing decisions, encouraging them to adopt technologies that enhance both surgical effectiveness and patient satisfaction. The continuous evolution of endoscopic and laparoscopic technologies, coupled with advancements in display technologies like high-definition and 4K resolutions, ensures that surgical visualization products remain at the cutting edge of medical innovation. The market penetration of these advanced systems is steadily increasing, moving beyond specialized centers to become a standard requirement in general surgical departments.
- Market Size Evolution: Projected from $18.5 billion in 2025 to $35.2 billion by 2033.
- CAGR: Approximately 8.5% during the forecast period (2025-2033).
- Adoption Rates: Rapidly increasing due to the growing preference for minimally invasive surgery (MIS).
- Technological Disruptions: AI and ML integration for enhanced surgical guidance and analysis.
- Consumer Behavior Shifts: Patient demand for less invasive procedures driving technology adoption.
- Market Penetration: Expanding beyond specialized centers to general surgical departments.
- Healthcare Expenditure: Rising global healthcare spending fuels investment in advanced medical infrastructure.
Dominant Regions, Countries, or Segments in Surgical Visualization Product
The Asia-Pacific region is emerging as a dominant force in the Surgical Visualization Product market, driven by a potent combination of rapid economic development, expanding healthcare infrastructure, and a burgeoning patient population demanding advanced medical care. Within this dynamic region, China stands out as a primary growth engine, propelled by significant government initiatives aimed at modernizing its healthcare system and increasing access to sophisticated surgical technologies. The sheer volume of its population and the rising disposable incomes contribute to a substantial demand for both established and novel surgical visualization solutions.
Among the application segments, Laparoscopy is currently the largest and fastest-growing segment, valued at an estimated $6.8 billion in 2025. This dominance is attributed to its widespread applicability across general surgery, urology, gynecology, and bariatric procedures. The continuous innovation in laparoscopic instruments and visualization systems, offering improved dexterity, optics, and data integration, further solidifies its leading position. The demand for less invasive procedures, leading to quicker recovery and reduced patient morbidity, directly fuels the adoption of laparoscopic technologies.
In terms of product types, Endoscopic Cameras represent the most significant segment, accounting for approximately 30% of the market share in 2025, estimated at $5.5 billion. These cameras are the core component of any visualization system, directly impacting image quality, resolution, and maneuverability during surgical procedures. Advancements in sensor technology, such as the adoption of CMOS sensors for higher frame rates and better low-light performance, coupled with the transition to 4K and even 8K resolution capabilities, are driving the growth of this segment. The increasing sophistication of camera heads, offering enhanced articulation and ergonomic designs, further contributes to their market prominence.
- Dominant Region: Asia-Pacific, with China as a key growth driver.
- Dominant Application Segment: Laparoscopy, valued at $6.8 billion in 2025.
- Drivers: Widespread applicability, demand for MIS, improved instrument technology.
- Key Procedures: General surgery, urology, gynecology, bariatric surgery.
- Dominant Product Type: Endoscopic Cameras, representing 30% of the market share ($5.5 billion in 2025).
- Drivers: High-definition and 4K/8K resolution, advanced sensor technology (CMOS), improved camera head design.
- Impact: Crucial for image quality and intraoperative visualization.
- Economic Policies: Government investments in healthcare infrastructure in emerging economies.
- Infrastructure Development: Expansion of hospitals and surgical centers in rapidly developing nations.
- Growth Potential: High in regions with increasing healthcare expenditure and a growing middle class.
Surgical Visualization Product Product Landscape
The Surgical Visualization Product landscape is characterized by rapid innovation and a focus on enhancing surgical precision and patient outcomes. Manufacturers are continuously introducing advanced endoscopic cameras with high-definition (HD) and 4K resolutions, delivering unparalleled image clarity and detail. Innovations in 3D visualization are gaining traction, offering surgeons a more intuitive and spatially aware surgical field, particularly beneficial in complex reconstructive surgeries. Miniaturization of camera heads and instruments allows for access to smaller anatomical spaces and reduced invasiveness. Furthermore, the integration of augmented reality (AR) overlays, displaying patient data or pre-operative imaging directly within the surgical field, represents a significant technological advancement. Performance metrics such as frame rates, color accuracy, and depth of field are crucial differentiators, directly impacting the surgeon's ability to perform intricate maneuvers with confidence.
Key Drivers, Barriers & Challenges in Surgical Visualization Product
Key Drivers:
- Technological Advancements: Continuous innovation in imaging resolution (4K, 8K), 3D visualization, AI integration, and miniaturization is a primary growth catalyst.
- Increasing Demand for Minimally Invasive Surgery (MIS): Growing patient preference and proven clinical benefits of MIS procedures are driving adoption of visualization technologies.
- Rising Healthcare Expenditure: Increased spending on healthcare infrastructure and advanced medical equipment globally, especially in emerging economies.
- Aging Global Population: Higher incidence of age-related diseases requiring surgical intervention.
- Government Initiatives: Supportive policies and funding for healthcare modernization in various countries.
Barriers & Challenges:
- High Cost of Advanced Systems: The substantial upfront investment for cutting-edge visualization equipment can be a barrier for smaller healthcare facilities.
- Regulatory Hurdles: Lengthy and complex approval processes for new medical devices can delay market entry and increase R&D costs.
- Reimbursement Policies: Inconsistent or inadequate reimbursement for MIS procedures and associated technologies in some regions.
- Skilled Workforce Shortage: The need for trained surgeons and technicians proficient in operating and maintaining advanced visualization systems.
- Cybersecurity Concerns: Ensuring the security and privacy of patient data transmitted and stored by connected visualization devices.
- Supply Chain Disruptions: Global events can impact the availability of critical components, leading to production delays and increased costs. The estimated impact of such disruptions can lead to a 3-5% increase in manufacturing costs.
Emerging Opportunities in Surgical Visualization Product
Emerging opportunities in the Surgical Visualization Product market lie in the expanding applications of AI and machine learning for real-time surgical guidance, predictive analytics, and enhanced workflow automation. The development of integrated robotic surgery platforms with advanced visualization capabilities presents a significant growth avenue, offering greater precision and remote surgical possibilities. Furthermore, the burgeoning demand for tele-surgery and remote diagnostics creates opportunities for compact, high-resolution visualization systems with robust connectivity features. The increasing focus on personalized medicine will also drive the need for visualization tools capable of integrating patient-specific anatomical data for tailored surgical approaches. Untapped markets in developing economies with a growing healthcare sector offer substantial potential for market penetration with cost-effective yet advanced solutions.
Growth Accelerators in the Surgical Visualization Product Industry
Several key catalysts are accelerating long-term growth in the Surgical Visualization Product industry. Technological breakthroughs in areas like advanced optics, sensor technology, and data processing are continually pushing the boundaries of what's possible, making procedures safer and more effective. Strategic partnerships and collaborations between technology developers, medical device manufacturers, and healthcare institutions are fostering innovation and streamlining product development cycles. For instance, collaborations between AI developers and camera manufacturers are leading to smarter visualization systems. Furthermore, market expansion strategies, particularly into underserved regions and emerging economies, are creating new revenue streams and increasing global adoption. The growing emphasis on value-based healthcare is also a significant accelerator, as visualization technologies that demonstrably improve patient outcomes and reduce overall healthcare costs are prioritized.
Key Players Shaping the Surgical Visualization Product Market
- Karl Storz Gmbh
- Medtronic
- CONMED
- Boston Scientific
- COOK GROUP
- Smith & Nephew
- Richard Wolf GmbH
- Zowietek Electronics
- Cogentix Medical
- ACUTRONIC Medical Systems
- Optomic
- Happersberger otopront
- SonoScape Medical
- MEDI-CARE SOLUTIONS
- PENTAX Medical
- Johnson & Johnson
- Fujifilm
- Olympus
- Stryker
- B. Braun Melsungen
Notable Milestones in Surgical Visualization Product Sector
- 2019: Introduction of advanced 4K 3D visualization systems by key players, enhancing surgical depth perception.
- 2020: Increased adoption of AI-powered image enhancement and analysis tools in endoscopy.
- 2021: Significant investments in R&D for miniaturized surgical cameras for micro-invasive procedures.
- 2022: Launch of integrated augmented reality visualization platforms for complex surgeries.
- 2023: Growing trend of mergers and acquisitions focused on acquiring innovative visualization technologies.
- 2024 (Q1-Q4): Emerging focus on cloud-based surgical data management and remote visualization capabilities.
In-Depth Surgical Visualization Product Market Outlook
The future outlook for the Surgical Visualization Product market is exceptionally promising, driven by continuous technological advancements and an expanding global demand for sophisticated medical solutions. Growth accelerators such as the integration of AI for enhanced intraoperative decision-making, the development of versatile robotic surgical platforms, and the increasing adoption of tele-surgery will significantly shape the market. Strategic opportunities lie in catering to the unique needs of emerging markets by offering adaptable and cost-effective visualization solutions. The market is expected to witness a sustained upward trajectory, fueled by a persistent focus on improving patient care through greater surgical precision, reduced invasiveness, and more efficient healthcare delivery.
Surgical Visualization Product Segmentation
-
1. Application
- 1.1. ENT Endoscopy
- 1.2. Laparoscopy
- 1.3. Gastroscopy
- 1.4. Obstetrics/Gynaecology Endoscopy
- 1.5. Arthroscopy
- 1.6. Others
-
2. Types
- 2.1. Endoscopic Cameras
- 2.2. Camera Heads
- 2.3. Video Recorders And Processors
- 2.4. Video Convertors
- 2.5. Accessories
Surgical Visualization Product Segmentation By Geography
-
1. North America
- 1.1. United States
- 1.2. Canada
- 1.3. Mexico
-
2. South America
- 2.1. Brazil
- 2.2. Argentina
- 2.3. Rest of South America
-
3. Europe
- 3.1. United Kingdom
- 3.2. Germany
- 3.3. France
- 3.4. Italy
- 3.5. Spain
- 3.6. Russia
- 3.7. Benelux
- 3.8. Nordics
- 3.9. Rest of Europe
-
4. Middle East & Africa
- 4.1. Turkey
- 4.2. Israel
- 4.3. GCC
- 4.4. North Africa
- 4.5. South Africa
- 4.6. Rest of Middle East & Africa
-
5. Asia Pacific
- 5.1. China
- 5.2. India
- 5.3. Japan
- 5.4. South Korea
- 5.5. ASEAN
- 5.6. Oceania
- 5.7. Rest of Asia Pacific
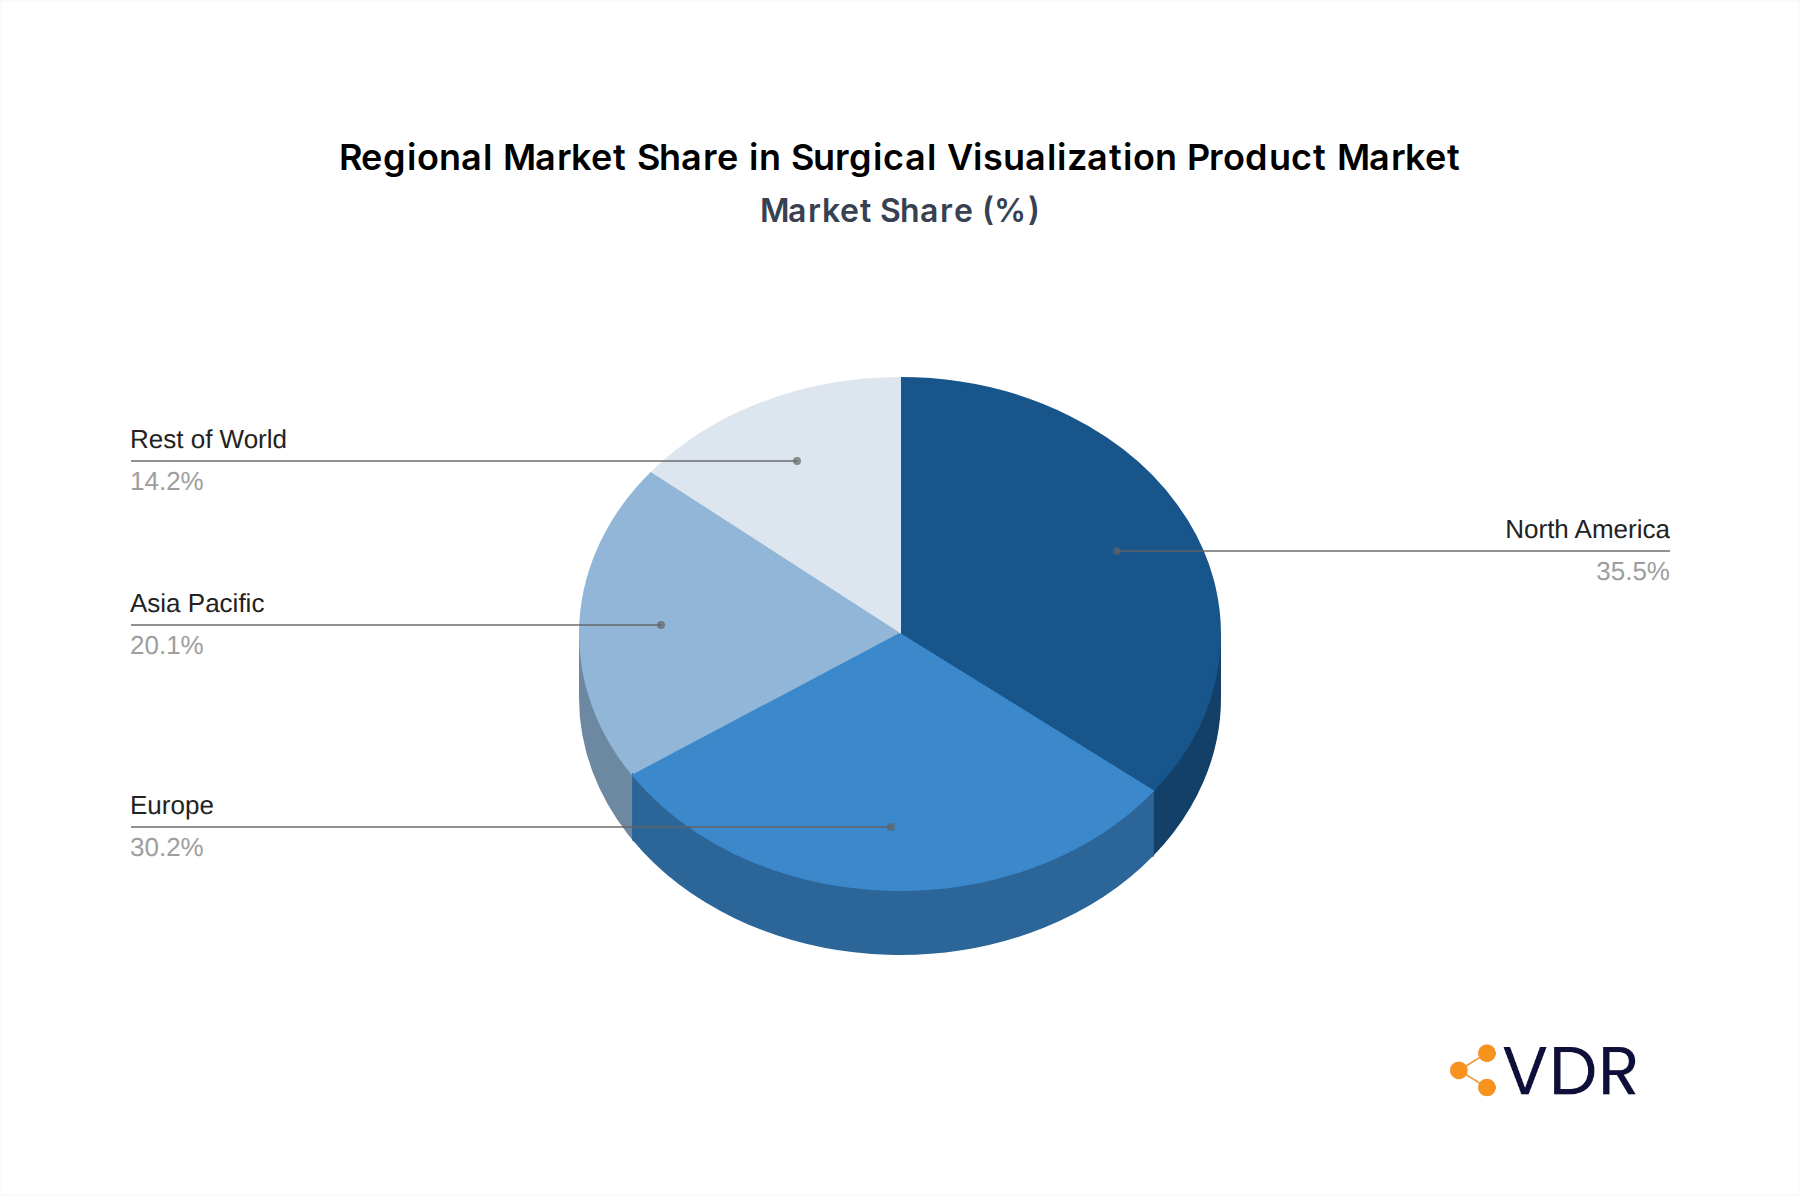
Surgical Visualization Product Regional Market Share
Geographic Coverage of Surgical Visualization Product
Surgical Visualization Product REPORT HIGHLIGHTS
| Aspects | Details |
|---|---|
| Study Period | 2020-2034 |
| Base Year | 2025 |
| Estimated Year | 2026 |
| Forecast Period | 2026-2034 |
| Historical Period | 2020-2025 |
| Growth Rate | CAGR of 10.7% from 2020-2034 |
| Segmentation |
|
Table of Contents
- 1. Introduction
- 1.1. Research Scope
- 1.2. Market Segmentation
- 1.3. Research Methodology
- 1.4. Definitions and Assumptions
- 2. Executive Summary
- 2.1. Introduction
- 3. Market Dynamics
- 3.1. Introduction
- 3.2. Market Drivers
- 3.3. Market Restrains
- 3.4. Market Trends
- 4. Market Factor Analysis
- 4.1. Porters Five Forces
- 4.2. Supply/Value Chain
- 4.3. PESTEL analysis
- 4.4. Market Entropy
- 4.5. Patent/Trademark Analysis
- 5. Global Surgical Visualization Product Analysis, Insights and Forecast, 2020-2032
- 5.1. Market Analysis, Insights and Forecast - by Application
- 5.1.1. ENT Endoscopy
- 5.1.2. Laparoscopy
- 5.1.3. Gastroscopy
- 5.1.4. Obstetrics/Gynaecology Endoscopy
- 5.1.5. Arthroscopy
- 5.1.6. Others
- 5.2. Market Analysis, Insights and Forecast - by Types
- 5.2.1. Endoscopic Cameras
- 5.2.2. Camera Heads
- 5.2.3. Video Recorders And Processors
- 5.2.4. Video Convertors
- 5.2.5. Accessories
- 5.3. Market Analysis, Insights and Forecast - by Region
- 5.3.1. North America
- 5.3.2. South America
- 5.3.3. Europe
- 5.3.4. Middle East & Africa
- 5.3.5. Asia Pacific
- 5.1. Market Analysis, Insights and Forecast - by Application
- 6. North America Surgical Visualization Product Analysis, Insights and Forecast, 2020-2032
- 6.1. Market Analysis, Insights and Forecast - by Application
- 6.1.1. ENT Endoscopy
- 6.1.2. Laparoscopy
- 6.1.3. Gastroscopy
- 6.1.4. Obstetrics/Gynaecology Endoscopy
- 6.1.5. Arthroscopy
- 6.1.6. Others
- 6.2. Market Analysis, Insights and Forecast - by Types
- 6.2.1. Endoscopic Cameras
- 6.2.2. Camera Heads
- 6.2.3. Video Recorders And Processors
- 6.2.4. Video Convertors
- 6.2.5. Accessories
- 6.1. Market Analysis, Insights and Forecast - by Application
- 7. South America Surgical Visualization Product Analysis, Insights and Forecast, 2020-2032
- 7.1. Market Analysis, Insights and Forecast - by Application
- 7.1.1. ENT Endoscopy
- 7.1.2. Laparoscopy
- 7.1.3. Gastroscopy
- 7.1.4. Obstetrics/Gynaecology Endoscopy
- 7.1.5. Arthroscopy
- 7.1.6. Others
- 7.2. Market Analysis, Insights and Forecast - by Types
- 7.2.1. Endoscopic Cameras
- 7.2.2. Camera Heads
- 7.2.3. Video Recorders And Processors
- 7.2.4. Video Convertors
- 7.2.5. Accessories
- 7.1. Market Analysis, Insights and Forecast - by Application
- 8. Europe Surgical Visualization Product Analysis, Insights and Forecast, 2020-2032
- 8.1. Market Analysis, Insights and Forecast - by Application
- 8.1.1. ENT Endoscopy
- 8.1.2. Laparoscopy
- 8.1.3. Gastroscopy
- 8.1.4. Obstetrics/Gynaecology Endoscopy
- 8.1.5. Arthroscopy
- 8.1.6. Others
- 8.2. Market Analysis, Insights and Forecast - by Types
- 8.2.1. Endoscopic Cameras
- 8.2.2. Camera Heads
- 8.2.3. Video Recorders And Processors
- 8.2.4. Video Convertors
- 8.2.5. Accessories
- 8.1. Market Analysis, Insights and Forecast - by Application
- 9. Middle East & Africa Surgical Visualization Product Analysis, Insights and Forecast, 2020-2032
- 9.1. Market Analysis, Insights and Forecast - by Application
- 9.1.1. ENT Endoscopy
- 9.1.2. Laparoscopy
- 9.1.3. Gastroscopy
- 9.1.4. Obstetrics/Gynaecology Endoscopy
- 9.1.5. Arthroscopy
- 9.1.6. Others
- 9.2. Market Analysis, Insights and Forecast - by Types
- 9.2.1. Endoscopic Cameras
- 9.2.2. Camera Heads
- 9.2.3. Video Recorders And Processors
- 9.2.4. Video Convertors
- 9.2.5. Accessories
- 9.1. Market Analysis, Insights and Forecast - by Application
- 10. Asia Pacific Surgical Visualization Product Analysis, Insights and Forecast, 2020-2032
- 10.1. Market Analysis, Insights and Forecast - by Application
- 10.1.1. ENT Endoscopy
- 10.1.2. Laparoscopy
- 10.1.3. Gastroscopy
- 10.1.4. Obstetrics/Gynaecology Endoscopy
- 10.1.5. Arthroscopy
- 10.1.6. Others
- 10.2. Market Analysis, Insights and Forecast - by Types
- 10.2.1. Endoscopic Cameras
- 10.2.2. Camera Heads
- 10.2.3. Video Recorders And Processors
- 10.2.4. Video Convertors
- 10.2.5. Accessories
- 10.1. Market Analysis, Insights and Forecast - by Application
- 11. Competitive Analysis
- 11.1. Global Market Share Analysis 2025
- 11.2. Company Profiles
- 11.2.1 Karl Storz Gmbh
- 11.2.1.1. Overview
- 11.2.1.2. Products
- 11.2.1.3. SWOT Analysis
- 11.2.1.4. Recent Developments
- 11.2.1.5. Financials (Based on Availability)
- 11.2.2 Medtronic
- 11.2.2.1. Overview
- 11.2.2.2. Products
- 11.2.2.3. SWOT Analysis
- 11.2.2.4. Recent Developments
- 11.2.2.5. Financials (Based on Availability)
- 11.2.3 CONMED
- 11.2.3.1. Overview
- 11.2.3.2. Products
- 11.2.3.3. SWOT Analysis
- 11.2.3.4. Recent Developments
- 11.2.3.5. Financials (Based on Availability)
- 11.2.4 Boston Scientific
- 11.2.4.1. Overview
- 11.2.4.2. Products
- 11.2.4.3. SWOT Analysis
- 11.2.4.4. Recent Developments
- 11.2.4.5. Financials (Based on Availability)
- 11.2.5 COOK GROUP
- 11.2.5.1. Overview
- 11.2.5.2. Products
- 11.2.5.3. SWOT Analysis
- 11.2.5.4. Recent Developments
- 11.2.5.5. Financials (Based on Availability)
- 11.2.6 Smith & Nephew
- 11.2.6.1. Overview
- 11.2.6.2. Products
- 11.2.6.3. SWOT Analysis
- 11.2.6.4. Recent Developments
- 11.2.6.5. Financials (Based on Availability)
- 11.2.7 Richard Wolf GmbH
- 11.2.7.1. Overview
- 11.2.7.2. Products
- 11.2.7.3. SWOT Analysis
- 11.2.7.4. Recent Developments
- 11.2.7.5. Financials (Based on Availability)
- 11.2.8 Zowietek Electronics
- 11.2.8.1. Overview
- 11.2.8.2. Products
- 11.2.8.3. SWOT Analysis
- 11.2.8.4. Recent Developments
- 11.2.8.5. Financials (Based on Availability)
- 11.2.9 Cogentix Medical
- 11.2.9.1. Overview
- 11.2.9.2. Products
- 11.2.9.3. SWOT Analysis
- 11.2.9.4. Recent Developments
- 11.2.9.5. Financials (Based on Availability)
- 11.2.10 ACUTRONIC Medical Systems
- 11.2.10.1. Overview
- 11.2.10.2. Products
- 11.2.10.3. SWOT Analysis
- 11.2.10.4. Recent Developments
- 11.2.10.5. Financials (Based on Availability)
- 11.2.11 Optomic
- 11.2.11.1. Overview
- 11.2.11.2. Products
- 11.2.11.3. SWOT Analysis
- 11.2.11.4. Recent Developments
- 11.2.11.5. Financials (Based on Availability)
- 11.2.12 Happersberger otopront
- 11.2.12.1. Overview
- 11.2.12.2. Products
- 11.2.12.3. SWOT Analysis
- 11.2.12.4. Recent Developments
- 11.2.12.5. Financials (Based on Availability)
- 11.2.13 SonoScape Medical
- 11.2.13.1. Overview
- 11.2.13.2. Products
- 11.2.13.3. SWOT Analysis
- 11.2.13.4. Recent Developments
- 11.2.13.5. Financials (Based on Availability)
- 11.2.14 MEDI-CARE SOLUTIONS
- 11.2.14.1. Overview
- 11.2.14.2. Products
- 11.2.14.3. SWOT Analysis
- 11.2.14.4. Recent Developments
- 11.2.14.5. Financials (Based on Availability)
- 11.2.15 PENTAX Medical
- 11.2.15.1. Overview
- 11.2.15.2. Products
- 11.2.15.3. SWOT Analysis
- 11.2.15.4. Recent Developments
- 11.2.15.5. Financials (Based on Availability)
- 11.2.16 Johnson & Johnson
- 11.2.16.1. Overview
- 11.2.16.2. Products
- 11.2.16.3. SWOT Analysis
- 11.2.16.4. Recent Developments
- 11.2.16.5. Financials (Based on Availability)
- 11.2.17 MEDI-CARE SOLUTIONS
- 11.2.17.1. Overview
- 11.2.17.2. Products
- 11.2.17.3. SWOT Analysis
- 11.2.17.4. Recent Developments
- 11.2.17.5. Financials (Based on Availability)
- 11.2.18 Fujifilm
- 11.2.18.1. Overview
- 11.2.18.2. Products
- 11.2.18.3. SWOT Analysis
- 11.2.18.4. Recent Developments
- 11.2.18.5. Financials (Based on Availability)
- 11.2.19 Olympus
- 11.2.19.1. Overview
- 11.2.19.2. Products
- 11.2.19.3. SWOT Analysis
- 11.2.19.4. Recent Developments
- 11.2.19.5. Financials (Based on Availability)
- 11.2.20 Stryker
- 11.2.20.1. Overview
- 11.2.20.2. Products
- 11.2.20.3. SWOT Analysis
- 11.2.20.4. Recent Developments
- 11.2.20.5. Financials (Based on Availability)
- 11.2.21 B. Braun Melsungen
- 11.2.21.1. Overview
- 11.2.21.2. Products
- 11.2.21.3. SWOT Analysis
- 11.2.21.4. Recent Developments
- 11.2.21.5. Financials (Based on Availability)
- 11.2.1 Karl Storz Gmbh
List of Figures
- Figure 1: Global Surgical Visualization Product Revenue Breakdown (undefined, %) by Region 2025 & 2033
- Figure 2: North America Surgical Visualization Product Revenue (undefined), by Application 2025 & 2033
- Figure 3: North America Surgical Visualization Product Revenue Share (%), by Application 2025 & 2033
- Figure 4: North America Surgical Visualization Product Revenue (undefined), by Types 2025 & 2033
- Figure 5: North America Surgical Visualization Product Revenue Share (%), by Types 2025 & 2033
- Figure 6: North America Surgical Visualization Product Revenue (undefined), by Country 2025 & 2033
- Figure 7: North America Surgical Visualization Product Revenue Share (%), by Country 2025 & 2033
- Figure 8: South America Surgical Visualization Product Revenue (undefined), by Application 2025 & 2033
- Figure 9: South America Surgical Visualization Product Revenue Share (%), by Application 2025 & 2033
- Figure 10: South America Surgical Visualization Product Revenue (undefined), by Types 2025 & 2033
- Figure 11: South America Surgical Visualization Product Revenue Share (%), by Types 2025 & 2033
- Figure 12: South America Surgical Visualization Product Revenue (undefined), by Country 2025 & 2033
- Figure 13: South America Surgical Visualization Product Revenue Share (%), by Country 2025 & 2033
- Figure 14: Europe Surgical Visualization Product Revenue (undefined), by Application 2025 & 2033
- Figure 15: Europe Surgical Visualization Product Revenue Share (%), by Application 2025 & 2033
- Figure 16: Europe Surgical Visualization Product Revenue (undefined), by Types 2025 & 2033
- Figure 17: Europe Surgical Visualization Product Revenue Share (%), by Types 2025 & 2033
- Figure 18: Europe Surgical Visualization Product Revenue (undefined), by Country 2025 & 2033
- Figure 19: Europe Surgical Visualization Product Revenue Share (%), by Country 2025 & 2033
- Figure 20: Middle East & Africa Surgical Visualization Product Revenue (undefined), by Application 2025 & 2033
- Figure 21: Middle East & Africa Surgical Visualization Product Revenue Share (%), by Application 2025 & 2033
- Figure 22: Middle East & Africa Surgical Visualization Product Revenue (undefined), by Types 2025 & 2033
- Figure 23: Middle East & Africa Surgical Visualization Product Revenue Share (%), by Types 2025 & 2033
- Figure 24: Middle East & Africa Surgical Visualization Product Revenue (undefined), by Country 2025 & 2033
- Figure 25: Middle East & Africa Surgical Visualization Product Revenue Share (%), by Country 2025 & 2033
- Figure 26: Asia Pacific Surgical Visualization Product Revenue (undefined), by Application 2025 & 2033
- Figure 27: Asia Pacific Surgical Visualization Product Revenue Share (%), by Application 2025 & 2033
- Figure 28: Asia Pacific Surgical Visualization Product Revenue (undefined), by Types 2025 & 2033
- Figure 29: Asia Pacific Surgical Visualization Product Revenue Share (%), by Types 2025 & 2033
- Figure 30: Asia Pacific Surgical Visualization Product Revenue (undefined), by Country 2025 & 2033
- Figure 31: Asia Pacific Surgical Visualization Product Revenue Share (%), by Country 2025 & 2033
List of Tables
- Table 1: Global Surgical Visualization Product Revenue undefined Forecast, by Application 2020 & 2033
- Table 2: Global Surgical Visualization Product Revenue undefined Forecast, by Types 2020 & 2033
- Table 3: Global Surgical Visualization Product Revenue undefined Forecast, by Region 2020 & 2033
- Table 4: Global Surgical Visualization Product Revenue undefined Forecast, by Application 2020 & 2033
- Table 5: Global Surgical Visualization Product Revenue undefined Forecast, by Types 2020 & 2033
- Table 6: Global Surgical Visualization Product Revenue undefined Forecast, by Country 2020 & 2033
- Table 7: United States Surgical Visualization Product Revenue (undefined) Forecast, by Application 2020 & 2033
- Table 8: Canada Surgical Visualization Product Revenue (undefined) Forecast, by Application 2020 & 2033
- Table 9: Mexico Surgical Visualization Product Revenue (undefined) Forecast, by Application 2020 & 2033
- Table 10: Global Surgical Visualization Product Revenue undefined Forecast, by Application 2020 & 2033
- Table 11: Global Surgical Visualization Product Revenue undefined Forecast, by Types 2020 & 2033
- Table 12: Global Surgical Visualization Product Revenue undefined Forecast, by Country 2020 & 2033
- Table 13: Brazil Surgical Visualization Product Revenue (undefined) Forecast, by Application 2020 & 2033
- Table 14: Argentina Surgical Visualization Product Revenue (undefined) Forecast, by Application 2020 & 2033
- Table 15: Rest of South America Surgical Visualization Product Revenue (undefined) Forecast, by Application 2020 & 2033
- Table 16: Global Surgical Visualization Product Revenue undefined Forecast, by Application 2020 & 2033
- Table 17: Global Surgical Visualization Product Revenue undefined Forecast, by Types 2020 & 2033
- Table 18: Global Surgical Visualization Product Revenue undefined Forecast, by Country 2020 & 2033
- Table 19: United Kingdom Surgical Visualization Product Revenue (undefined) Forecast, by Application 2020 & 2033
- Table 20: Germany Surgical Visualization Product Revenue (undefined) Forecast, by Application 2020 & 2033
- Table 21: France Surgical Visualization Product Revenue (undefined) Forecast, by Application 2020 & 2033
- Table 22: Italy Surgical Visualization Product Revenue (undefined) Forecast, by Application 2020 & 2033
- Table 23: Spain Surgical Visualization Product Revenue (undefined) Forecast, by Application 2020 & 2033
- Table 24: Russia Surgical Visualization Product Revenue (undefined) Forecast, by Application 2020 & 2033
- Table 25: Benelux Surgical Visualization Product Revenue (undefined) Forecast, by Application 2020 & 2033
- Table 26: Nordics Surgical Visualization Product Revenue (undefined) Forecast, by Application 2020 & 2033
- Table 27: Rest of Europe Surgical Visualization Product Revenue (undefined) Forecast, by Application 2020 & 2033
- Table 28: Global Surgical Visualization Product Revenue undefined Forecast, by Application 2020 & 2033
- Table 29: Global Surgical Visualization Product Revenue undefined Forecast, by Types 2020 & 2033
- Table 30: Global Surgical Visualization Product Revenue undefined Forecast, by Country 2020 & 2033
- Table 31: Turkey Surgical Visualization Product Revenue (undefined) Forecast, by Application 2020 & 2033
- Table 32: Israel Surgical Visualization Product Revenue (undefined) Forecast, by Application 2020 & 2033
- Table 33: GCC Surgical Visualization Product Revenue (undefined) Forecast, by Application 2020 & 2033
- Table 34: North Africa Surgical Visualization Product Revenue (undefined) Forecast, by Application 2020 & 2033
- Table 35: South Africa Surgical Visualization Product Revenue (undefined) Forecast, by Application 2020 & 2033
- Table 36: Rest of Middle East & Africa Surgical Visualization Product Revenue (undefined) Forecast, by Application 2020 & 2033
- Table 37: Global Surgical Visualization Product Revenue undefined Forecast, by Application 2020 & 2033
- Table 38: Global Surgical Visualization Product Revenue undefined Forecast, by Types 2020 & 2033
- Table 39: Global Surgical Visualization Product Revenue undefined Forecast, by Country 2020 & 2033
- Table 40: China Surgical Visualization Product Revenue (undefined) Forecast, by Application 2020 & 2033
- Table 41: India Surgical Visualization Product Revenue (undefined) Forecast, by Application 2020 & 2033
- Table 42: Japan Surgical Visualization Product Revenue (undefined) Forecast, by Application 2020 & 2033
- Table 43: South Korea Surgical Visualization Product Revenue (undefined) Forecast, by Application 2020 & 2033
- Table 44: ASEAN Surgical Visualization Product Revenue (undefined) Forecast, by Application 2020 & 2033
- Table 45: Oceania Surgical Visualization Product Revenue (undefined) Forecast, by Application 2020 & 2033
- Table 46: Rest of Asia Pacific Surgical Visualization Product Revenue (undefined) Forecast, by Application 2020 & 2033
Frequently Asked Questions
1. What is the projected Compound Annual Growth Rate (CAGR) of the Surgical Visualization Product?
The projected CAGR is approximately 10.7%.
2. Which companies are prominent players in the Surgical Visualization Product?
Key companies in the market include Karl Storz Gmbh, Medtronic, CONMED, Boston Scientific, COOK GROUP, Smith & Nephew, Richard Wolf GmbH, Zowietek Electronics, Cogentix Medical, ACUTRONIC Medical Systems, Optomic, Happersberger otopront, SonoScape Medical, MEDI-CARE SOLUTIONS, PENTAX Medical, Johnson & Johnson, MEDI-CARE SOLUTIONS, Fujifilm, Olympus, Stryker, B. Braun Melsungen.
3. What are the main segments of the Surgical Visualization Product?
The market segments include Application, Types.
4. Can you provide details about the market size?
The market size is estimated to be USD XXX N/A as of 2022.
5. What are some drivers contributing to market growth?
N/A
6. What are the notable trends driving market growth?
N/A
7. Are there any restraints impacting market growth?
N/A
8. Can you provide examples of recent developments in the market?
N/A
9. What pricing options are available for accessing the report?
Pricing options include single-user, multi-user, and enterprise licenses priced at USD 4900.00, USD 7350.00, and USD 9800.00 respectively.
10. Is the market size provided in terms of value or volume?
The market size is provided in terms of value, measured in N/A.
11. Are there any specific market keywords associated with the report?
Yes, the market keyword associated with the report is "Surgical Visualization Product," which aids in identifying and referencing the specific market segment covered.
12. How do I determine which pricing option suits my needs best?
The pricing options vary based on user requirements and access needs. Individual users may opt for single-user licenses, while businesses requiring broader access may choose multi-user or enterprise licenses for cost-effective access to the report.
13. Are there any additional resources or data provided in the Surgical Visualization Product report?
While the report offers comprehensive insights, it's advisable to review the specific contents or supplementary materials provided to ascertain if additional resources or data are available.
14. How can I stay updated on further developments or reports in the Surgical Visualization Product?
To stay informed about further developments, trends, and reports in the Surgical Visualization Product, consider subscribing to industry newsletters, following relevant companies and organizations, or regularly checking reputable industry news sources and publications.
Methodology
Step 1 - Identification of Relevant Samples Size from Population Database


Step 2 - Approaches for Defining Global Market Size (Value, Volume* & Price*)

Note*: In applicable scenarios
Step 3 - Data Sources
Primary Research
- Web Analytics
- Survey Reports
- Research Institute
- Latest Research Reports
- Opinion Leaders
Secondary Research
- Annual Reports
- White Paper
- Latest Press Release
- Industry Association
- Paid Database
- Investor Presentations

Step 4 - Data Triangulation
Involves using different sources of information in order to increase the validity of a study
These sources are likely to be stakeholders in a program - participants, other researchers, program staff, other community members, and so on.
Then we put all data in single framework & apply various statistical tools to find out the dynamic on the market.
During the analysis stage, feedback from the stakeholder groups would be compared to determine areas of agreement as well as areas of divergence