
Key Insights
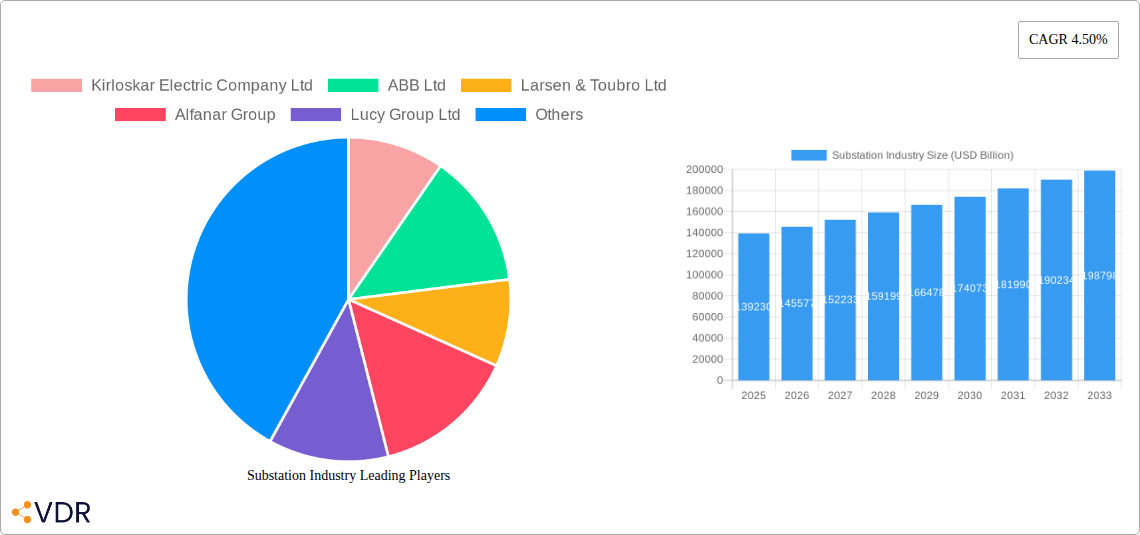
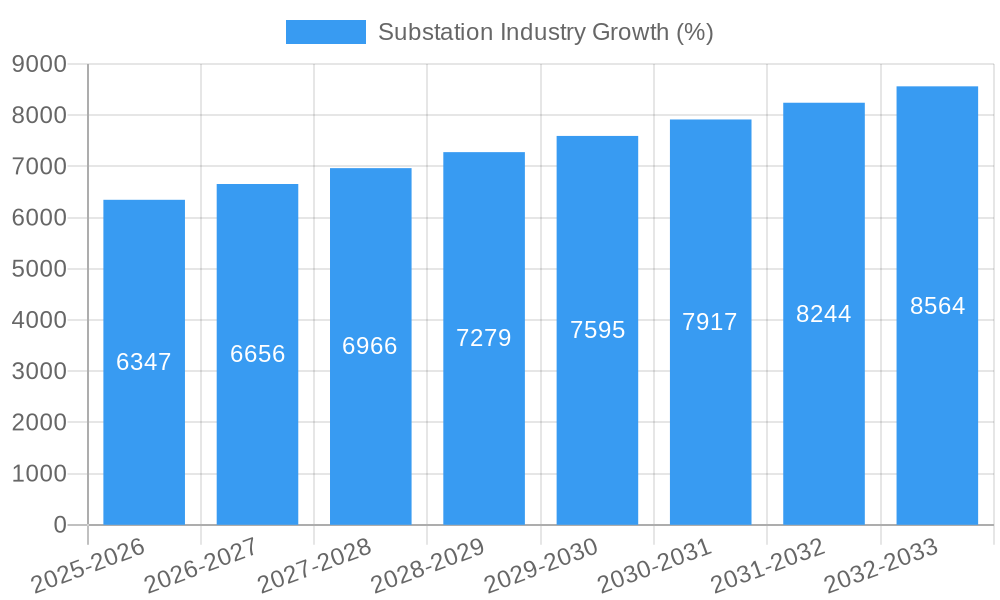
The global substation industry, valued at $139.23 billion in 2025, is projected to experience robust growth, driven by increasing electricity demand, the expansion of renewable energy sources, and the modernization of aging grid infrastructure. The 4.50% CAGR from 2025 to 2033 indicates a significant market expansion, fueled by substantial investments in smart grid technologies and the rising adoption of advanced automation and digitalization solutions within power systems. High-voltage substations are anticipated to dominate the market due to their crucial role in long-distance power transmission. Power utilities remain the largest consumer segment, followed by the commercial and industrial sectors, which are increasingly adopting substations to enhance power reliability and efficiency. Geographic growth will be varied, with regions like Asia Pacific and North America leading the charge due to rapid urbanization, industrial growth, and government initiatives promoting renewable energy integration. However, regulatory hurdles and the high initial investment costs associated with substation development may present challenges to market growth in certain regions. Key players such as ABB, Siemens, and Schneider Electric are aggressively investing in research and development to enhance their product offerings and solidify their market positions.
Competition in the industry is intense, with established players and emerging companies vying for market share through technological innovation, strategic partnerships, and expansion into new geographic markets. The industry is witnessing a significant shift toward environmentally friendly solutions, with a growing focus on sustainable materials and energy-efficient technologies. This trend is further reinforced by governmental regulations aimed at reducing carbon emissions and promoting sustainable practices within the power sector. The integration of digital technologies, such as AI and IoT, is revolutionizing substation operations, enabling enhanced grid monitoring, predictive maintenance, and improved system reliability. This trend is driving innovation and creating opportunities for technology providers to integrate their offerings into the substation ecosystem. Continued investment in grid modernization and infrastructure development will be paramount in sustaining the positive growth trajectory of the substation market.
This comprehensive report provides an in-depth analysis of the global substation industry, encompassing market dynamics, growth trends, regional performance, key players, and future outlook. Valued at $xx billion in 2025, the market is poised for significant expansion, reaching $xx billion by 2033, exhibiting a CAGR of xx% during the forecast period (2025-2033). This report covers the historical period (2019-2024), with 2025 as the base year and estimations extending to 2033. The analysis segments the market by voltage (high, medium, low) and application (power utilities, commercial & industrial, other applications), offering a granular understanding of this critical infrastructure sector.
Substation Industry Market Dynamics & Structure
The substation industry is characterized by a moderately concentrated market structure, with key players like ABB Ltd, Siemens AG, and General Electric Company holding significant market shares. However, regional variations exist, with emerging markets witnessing increased competition from local and international players. Technological innovation, driven by the need for grid modernization and increased renewable energy integration, is a primary growth driver. Stringent regulatory frameworks focused on grid reliability and safety also shape industry practices. Competitive product substitutes, primarily focusing on cost-effectiveness and efficiency, pose a moderate threat. End-user demographics heavily influence market demand, with power utilities constituting the largest segment. M&A activity is accelerating, with a notable increase in deal volumes during the past five years, driving consolidation and shaping the competitive landscape.
- Market Concentration: Highly concentrated in developed regions, more fragmented in developing markets. Top 5 players hold approximately xx% market share in 2025.
- Technological Innovation Drivers: Smart grids, renewable energy integration, digitalization, and automation.
- Regulatory Frameworks: Stringent safety and reliability standards vary across regions, impacting investment decisions.
- Competitive Substitutes: Advanced energy storage solutions and alternative grid architectures present moderate competitive pressures.
- End-User Demographics: Power utilities dominate, followed by commercial & industrial sectors.
- M&A Trends: Average of xx M&A deals per year observed from 2019-2024, indicating a consolidating market.
Substation Industry Growth Trends & Insights
The global substation market experienced robust growth during the historical period (2019-2024), fueled by rising energy demand, infrastructure development projects, and increasing government investments in grid modernization. The market size expanded from $xx billion in 2019 to $xx billion in 2024. Technological advancements such as digital substation technologies and smart grid integration are accelerating adoption rates across various segments. Consumer behavior is shifting towards greater reliance on renewable energy sources and sophisticated grid management systems, further driving industry growth. The adoption of digitalization and automation is projected to continue at a rapid pace, contributing significantly to future growth.
- CAGR (2019-2024): xx%
- Market Penetration of Smart Substations (2025): xx%
- Projected Market Size (2033): $xx billion
Dominant Regions, Countries, or Segments in Substation Industry
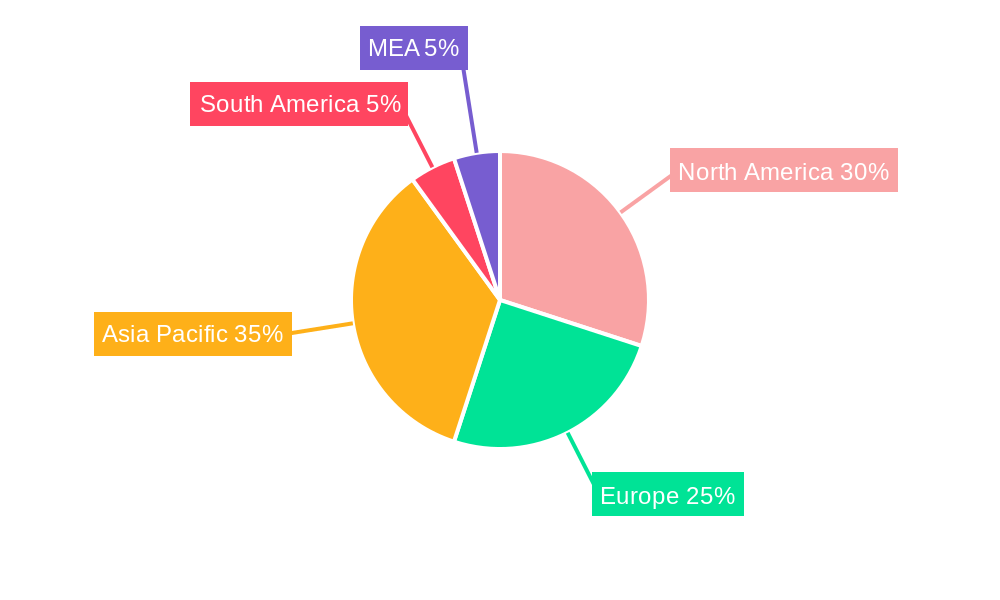
North America and Europe currently dominate the substation market, driven by robust grid infrastructure and substantial investments in renewable energy integration. However, Asia-Pacific is experiencing the fastest growth, fueled by rapid urbanization, industrialization, and government initiatives to improve power infrastructure. Within the application segment, power utilities represent the largest market share globally. High-voltage substations dominate in terms of value, driven by large-scale grid projects and the need for efficient long-distance power transmission.
- Key Drivers in North America: Strong regulatory support, significant investments in grid modernization, and high adoption of smart grid technologies.
- Key Drivers in Asia-Pacific: Rapid economic growth, increasing urbanization, and government initiatives promoting renewable energy integration.
- Key Drivers in Power Utilities Segment: Demand for grid reliability, energy efficiency, and integration of renewable energy sources.
- Market Share (2025): North America (xx%), Europe (xx%), Asia-Pacific (xx%).
Substation Industry Product Landscape
The substation industry offers a wide array of products, including transformers, circuit breakers, switchgear, protection relays, and monitoring systems. Recent innovations focus on digitalization, resulting in smart substations that leverage advanced sensors, communication networks, and data analytics for improved grid management and enhanced operational efficiency. These smart substations offer increased reliability, reduced maintenance costs, and improved grid stability. The key selling propositions are enhanced grid management capabilities, improved reliability and efficiency, and reduced operational costs.
Key Drivers, Barriers & Challenges in Substation Industry
Key Drivers:
- Rising global energy demand.
- Increasing investments in renewable energy integration.
- Government initiatives supporting grid modernization and sustainability.
- Advancements in digitalization and automation technologies.
Challenges:
- High initial investment costs for smart substation technologies.
- Supply chain disruptions impacting component availability.
- Stringent regulatory compliance requirements.
- Intense competition among established players and new entrants. This leads to price pressures resulting in a xx% reduction in average profit margin compared to 2019.
Emerging Opportunities in Substation Industry
- Growth in microgrids and distributed energy resources.
- Expansion into emerging markets with developing power infrastructure.
- Integration of advanced analytics and AI for predictive maintenance and improved grid management.
- Development of next-generation substation technologies with enhanced capabilities.
Growth Accelerators in the Substation Industry
Long-term growth in the substation industry will be driven by the continued adoption of smart grid technologies, strategic partnerships between utilities and technology providers fostering innovation and collaboration. Expanding into new markets, particularly in developing regions, presents significant opportunities for growth. Furthermore, the increasing focus on grid resilience and cybersecurity will further fuel demand for advanced substation solutions.
Key Players Shaping the Substation Industry Market
- ABB Ltd
- General Electric Company
- Larsen & Toubro Ltd
- Siemens AG
- Schneider Electric SE
- Eaton Corporation PLC
- Kirloskar Electric Company Ltd
- Alfanar Group
- Lucy Group Ltd
- C&S Electric Limited
Notable Milestones in Substation Industry Sector
- 2020: Significant increase in investments in R&D for advanced substation technologies by major players.
- 2021: Several strategic partnerships announced between utilities and technology providers to accelerate smart grid deployments.
- 2022: Government initiatives launched in several countries to promote grid modernization and sustainability.
- 2023: Several large-scale M&A deals closed, leading to industry consolidation.
- 2024: Increased focus on digitalization and automation, with numerous product launches showcasing advanced features.
In-Depth Substation Industry Market Outlook
The substation industry is poised for continued growth over the forecast period, driven by the factors outlined above. Significant opportunities exist for companies that can innovate, adapt to evolving market needs, and effectively navigate regulatory landscapes. The focus on sustainability, grid resilience, and digitalization will shape the future of the industry, creating exciting prospects for growth and innovation.
Substation Industry Segmentation
-
1. Voltage
- 1.1. High
- 1.2. Medium
- 1.3. Low
-
2. Application
- 2.1. Power Utilities
- 2.2. Commercial & Industrial
- 2.3. Other Applications
Substation Industry Segmentation By Geography
- 1. North America
- 2. Europe
- 3. Asia Pacific
- 4. South America
- 5. Middle East and Africa
Substation Industry REPORT HIGHLIGHTS
| Aspects | Details |
|---|---|
| Study Period | 2019-2033 |
| Base Year | 2024 |
| Estimated Year | 2025 |
| Forecast Period | 2025-2033 |
| Historical Period | 2019-2024 |
| Growth Rate | CAGR of 4.50% from 2019-2033 |
| Segmentation |
|
Table of Contents
- 1. Introduction
- 1.1. Research Scope
- 1.2. Market Segmentation
- 1.3. Research Methodology
- 1.4. Definitions and Assumptions
- 2. Executive Summary
- 2.1. Introduction
- 3. Market Dynamics
- 3.1. Introduction
- 3.2. Market Drivers
- 3.2.1. 4.; Growing Energy Demand4.; Renewable Energy Transition
- 3.3. Market Restrains
- 3.3.1. 4.; Phasing out of Conventional Sources of Electricity
- 3.4. Market Trends
- 3.4.1. Power Utilities Segment to Witness Significant Growth
- 4. Market Factor Analysis
- 4.1. Porters Five Forces
- 4.2. Supply/Value Chain
- 4.3. PESTEL analysis
- 4.4. Market Entropy
- 4.5. Patent/Trademark Analysis
- 5. Global Substation Industry Analysis, Insights and Forecast, 2019-2031
- 5.1. Market Analysis, Insights and Forecast - by Voltage
- 5.1.1. High
- 5.1.2. Medium
- 5.1.3. Low
- 5.2. Market Analysis, Insights and Forecast - by Application
- 5.2.1. Power Utilities
- 5.2.2. Commercial & Industrial
- 5.2.3. Other Applications
- 5.3. Market Analysis, Insights and Forecast - by Region
- 5.3.1. North America
- 5.3.2. Europe
- 5.3.3. Asia Pacific
- 5.3.4. South America
- 5.3.5. Middle East and Africa
- 5.1. Market Analysis, Insights and Forecast - by Voltage
- 6. North America Substation Industry Analysis, Insights and Forecast, 2019-2031
- 6.1. Market Analysis, Insights and Forecast - by Voltage
- 6.1.1. High
- 6.1.2. Medium
- 6.1.3. Low
- 6.2. Market Analysis, Insights and Forecast - by Application
- 6.2.1. Power Utilities
- 6.2.2. Commercial & Industrial
- 6.2.3. Other Applications
- 6.1. Market Analysis, Insights and Forecast - by Voltage
- 7. Europe Substation Industry Analysis, Insights and Forecast, 2019-2031
- 7.1. Market Analysis, Insights and Forecast - by Voltage
- 7.1.1. High
- 7.1.2. Medium
- 7.1.3. Low
- 7.2. Market Analysis, Insights and Forecast - by Application
- 7.2.1. Power Utilities
- 7.2.2. Commercial & Industrial
- 7.2.3. Other Applications
- 7.1. Market Analysis, Insights and Forecast - by Voltage
- 8. Asia Pacific Substation Industry Analysis, Insights and Forecast, 2019-2031
- 8.1. Market Analysis, Insights and Forecast - by Voltage
- 8.1.1. High
- 8.1.2. Medium
- 8.1.3. Low
- 8.2. Market Analysis, Insights and Forecast - by Application
- 8.2.1. Power Utilities
- 8.2.2. Commercial & Industrial
- 8.2.3. Other Applications
- 8.1. Market Analysis, Insights and Forecast - by Voltage
- 9. South America Substation Industry Analysis, Insights and Forecast, 2019-2031
- 9.1. Market Analysis, Insights and Forecast - by Voltage
- 9.1.1. High
- 9.1.2. Medium
- 9.1.3. Low
- 9.2. Market Analysis, Insights and Forecast - by Application
- 9.2.1. Power Utilities
- 9.2.2. Commercial & Industrial
- 9.2.3. Other Applications
- 9.1. Market Analysis, Insights and Forecast - by Voltage
- 10. Middle East and Africa Substation Industry Analysis, Insights and Forecast, 2019-2031
- 10.1. Market Analysis, Insights and Forecast - by Voltage
- 10.1.1. High
- 10.1.2. Medium
- 10.1.3. Low
- 10.2. Market Analysis, Insights and Forecast - by Application
- 10.2.1. Power Utilities
- 10.2.2. Commercial & Industrial
- 10.2.3. Other Applications
- 10.1. Market Analysis, Insights and Forecast - by Voltage
- 11. North America Substation Industry Analysis, Insights and Forecast, 2019-2031
- 11.1. Market Analysis, Insights and Forecast - By Country/Sub-region
- 11.1.1 United States
- 11.1.2 Canada
- 11.1.3 Mexico
- 12. Europe Substation Industry Analysis, Insights and Forecast, 2019-2031
- 12.1. Market Analysis, Insights and Forecast - By Country/Sub-region
- 12.1.1 Germany
- 12.1.2 United Kingdom
- 12.1.3 France
- 12.1.4 Spain
- 12.1.5 Italy
- 12.1.6 Spain
- 12.1.7 Belgium
- 12.1.8 Netherland
- 12.1.9 Nordics
- 12.1.10 Rest of Europe
- 13. Asia Pacific Substation Industry Analysis, Insights and Forecast, 2019-2031
- 13.1. Market Analysis, Insights and Forecast - By Country/Sub-region
- 13.1.1 China
- 13.1.2 Japan
- 13.1.3 India
- 13.1.4 South Korea
- 13.1.5 Southeast Asia
- 13.1.6 Australia
- 13.1.7 Indonesia
- 13.1.8 Phillipes
- 13.1.9 Singapore
- 13.1.10 Thailandc
- 13.1.11 Rest of Asia Pacific
- 14. South America Substation Industry Analysis, Insights and Forecast, 2019-2031
- 14.1. Market Analysis, Insights and Forecast - By Country/Sub-region
- 14.1.1 Brazil
- 14.1.2 Argentina
- 14.1.3 Peru
- 14.1.4 Chile
- 14.1.5 Colombia
- 14.1.6 Ecuador
- 14.1.7 Venezuela
- 14.1.8 Rest of South America
- 15. MEA Substation Industry Analysis, Insights and Forecast, 2019-2031
- 15.1. Market Analysis, Insights and Forecast - By Country/Sub-region
- 15.1.1 United Arab Emirates
- 15.1.2 Saudi Arabia
- 15.1.3 South Africa
- 15.1.4 Rest of Middle East and Africa
- 16. Competitive Analysis
- 16.1. Global Market Share Analysis 2024
- 16.2. Company Profiles
- 16.2.1 Kirloskar Electric Company Ltd
- 16.2.1.1. Overview
- 16.2.1.2. Products
- 16.2.1.3. SWOT Analysis
- 16.2.1.4. Recent Developments
- 16.2.1.5. Financials (Based on Availability)
- 16.2.2 ABB Ltd
- 16.2.2.1. Overview
- 16.2.2.2. Products
- 16.2.2.3. SWOT Analysis
- 16.2.2.4. Recent Developments
- 16.2.2.5. Financials (Based on Availability)
- 16.2.3 Larsen & Toubro Ltd
- 16.2.3.1. Overview
- 16.2.3.2. Products
- 16.2.3.3. SWOT Analysis
- 16.2.3.4. Recent Developments
- 16.2.3.5. Financials (Based on Availability)
- 16.2.4 Alfanar Group
- 16.2.4.1. Overview
- 16.2.4.2. Products
- 16.2.4.3. SWOT Analysis
- 16.2.4.4. Recent Developments
- 16.2.4.5. Financials (Based on Availability)
- 16.2.5 Lucy Group Ltd
- 16.2.5.1. Overview
- 16.2.5.2. Products
- 16.2.5.3. SWOT Analysis
- 16.2.5.4. Recent Developments
- 16.2.5.5. Financials (Based on Availability)
- 16.2.6 Schneider Electric SE
- 16.2.6.1. Overview
- 16.2.6.2. Products
- 16.2.6.3. SWOT Analysis
- 16.2.6.4. Recent Developments
- 16.2.6.5. Financials (Based on Availability)
- 16.2.7 Eaton Corporation PLC
- 16.2.7.1. Overview
- 16.2.7.2. Products
- 16.2.7.3. SWOT Analysis
- 16.2.7.4. Recent Developments
- 16.2.7.5. Financials (Based on Availability)
- 16.2.8 General Electric Company
- 16.2.8.1. Overview
- 16.2.8.2. Products
- 16.2.8.3. SWOT Analysis
- 16.2.8.4. Recent Developments
- 16.2.8.5. Financials (Based on Availability)
- 16.2.9 C&S Electric Limited*List Not Exhaustive
- 16.2.9.1. Overview
- 16.2.9.2. Products
- 16.2.9.3. SWOT Analysis
- 16.2.9.4. Recent Developments
- 16.2.9.5. Financials (Based on Availability)
- 16.2.10 Siemens AG
- 16.2.10.1. Overview
- 16.2.10.2. Products
- 16.2.10.3. SWOT Analysis
- 16.2.10.4. Recent Developments
- 16.2.10.5. Financials (Based on Availability)
- 16.2.1 Kirloskar Electric Company Ltd
List of Figures
- Figure 1: Global Substation Industry Revenue Breakdown (USD Billion, %) by Region 2024 & 2032
- Figure 2: North America Substation Industry Revenue (USD Billion), by Country 2024 & 2032
- Figure 3: North America Substation Industry Revenue Share (%), by Country 2024 & 2032
- Figure 4: Europe Substation Industry Revenue (USD Billion), by Country 2024 & 2032
- Figure 5: Europe Substation Industry Revenue Share (%), by Country 2024 & 2032
- Figure 6: Asia Pacific Substation Industry Revenue (USD Billion), by Country 2024 & 2032
- Figure 7: Asia Pacific Substation Industry Revenue Share (%), by Country 2024 & 2032
- Figure 8: South America Substation Industry Revenue (USD Billion), by Country 2024 & 2032
- Figure 9: South America Substation Industry Revenue Share (%), by Country 2024 & 2032
- Figure 10: MEA Substation Industry Revenue (USD Billion), by Country 2024 & 2032
- Figure 11: MEA Substation Industry Revenue Share (%), by Country 2024 & 2032
- Figure 12: North America Substation Industry Revenue (USD Billion), by Voltage 2024 & 2032
- Figure 13: North America Substation Industry Revenue Share (%), by Voltage 2024 & 2032
- Figure 14: North America Substation Industry Revenue (USD Billion), by Application 2024 & 2032
- Figure 15: North America Substation Industry Revenue Share (%), by Application 2024 & 2032
- Figure 16: North America Substation Industry Revenue (USD Billion), by Country 2024 & 2032
- Figure 17: North America Substation Industry Revenue Share (%), by Country 2024 & 2032
- Figure 18: Europe Substation Industry Revenue (USD Billion), by Voltage 2024 & 2032
- Figure 19: Europe Substation Industry Revenue Share (%), by Voltage 2024 & 2032
- Figure 20: Europe Substation Industry Revenue (USD Billion), by Application 2024 & 2032
- Figure 21: Europe Substation Industry Revenue Share (%), by Application 2024 & 2032
- Figure 22: Europe Substation Industry Revenue (USD Billion), by Country 2024 & 2032
- Figure 23: Europe Substation Industry Revenue Share (%), by Country 2024 & 2032
- Figure 24: Asia Pacific Substation Industry Revenue (USD Billion), by Voltage 2024 & 2032
- Figure 25: Asia Pacific Substation Industry Revenue Share (%), by Voltage 2024 & 2032
- Figure 26: Asia Pacific Substation Industry Revenue (USD Billion), by Application 2024 & 2032
- Figure 27: Asia Pacific Substation Industry Revenue Share (%), by Application 2024 & 2032
- Figure 28: Asia Pacific Substation Industry Revenue (USD Billion), by Country 2024 & 2032
- Figure 29: Asia Pacific Substation Industry Revenue Share (%), by Country 2024 & 2032
- Figure 30: South America Substation Industry Revenue (USD Billion), by Voltage 2024 & 2032
- Figure 31: South America Substation Industry Revenue Share (%), by Voltage 2024 & 2032
- Figure 32: South America Substation Industry Revenue (USD Billion), by Application 2024 & 2032
- Figure 33: South America Substation Industry Revenue Share (%), by Application 2024 & 2032
- Figure 34: South America Substation Industry Revenue (USD Billion), by Country 2024 & 2032
- Figure 35: South America Substation Industry Revenue Share (%), by Country 2024 & 2032
- Figure 36: Middle East and Africa Substation Industry Revenue (USD Billion), by Voltage 2024 & 2032
- Figure 37: Middle East and Africa Substation Industry Revenue Share (%), by Voltage 2024 & 2032
- Figure 38: Middle East and Africa Substation Industry Revenue (USD Billion), by Application 2024 & 2032
- Figure 39: Middle East and Africa Substation Industry Revenue Share (%), by Application 2024 & 2032
- Figure 40: Middle East and Africa Substation Industry Revenue (USD Billion), by Country 2024 & 2032
- Figure 41: Middle East and Africa Substation Industry Revenue Share (%), by Country 2024 & 2032
List of Tables
- Table 1: Global Substation Industry Revenue USD Billion Forecast, by Region 2019 & 2032
- Table 2: Global Substation Industry Revenue USD Billion Forecast, by Voltage 2019 & 2032
- Table 3: Global Substation Industry Revenue USD Billion Forecast, by Application 2019 & 2032
- Table 4: Global Substation Industry Revenue USD Billion Forecast, by Region 2019 & 2032
- Table 5: Global Substation Industry Revenue USD Billion Forecast, by Country 2019 & 2032
- Table 6: United States Substation Industry Revenue (USD Billion) Forecast, by Application 2019 & 2032
- Table 7: Canada Substation Industry Revenue (USD Billion) Forecast, by Application 2019 & 2032
- Table 8: Mexico Substation Industry Revenue (USD Billion) Forecast, by Application 2019 & 2032
- Table 9: Global Substation Industry Revenue USD Billion Forecast, by Country 2019 & 2032
- Table 10: Germany Substation Industry Revenue (USD Billion) Forecast, by Application 2019 & 2032
- Table 11: United Kingdom Substation Industry Revenue (USD Billion) Forecast, by Application 2019 & 2032
- Table 12: France Substation Industry Revenue (USD Billion) Forecast, by Application 2019 & 2032
- Table 13: Spain Substation Industry Revenue (USD Billion) Forecast, by Application 2019 & 2032
- Table 14: Italy Substation Industry Revenue (USD Billion) Forecast, by Application 2019 & 2032
- Table 15: Spain Substation Industry Revenue (USD Billion) Forecast, by Application 2019 & 2032
- Table 16: Belgium Substation Industry Revenue (USD Billion) Forecast, by Application 2019 & 2032
- Table 17: Netherland Substation Industry Revenue (USD Billion) Forecast, by Application 2019 & 2032
- Table 18: Nordics Substation Industry Revenue (USD Billion) Forecast, by Application 2019 & 2032
- Table 19: Rest of Europe Substation Industry Revenue (USD Billion) Forecast, by Application 2019 & 2032
- Table 20: Global Substation Industry Revenue USD Billion Forecast, by Country 2019 & 2032
- Table 21: China Substation Industry Revenue (USD Billion) Forecast, by Application 2019 & 2032
- Table 22: Japan Substation Industry Revenue (USD Billion) Forecast, by Application 2019 & 2032
- Table 23: India Substation Industry Revenue (USD Billion) Forecast, by Application 2019 & 2032
- Table 24: South Korea Substation Industry Revenue (USD Billion) Forecast, by Application 2019 & 2032
- Table 25: Southeast Asia Substation Industry Revenue (USD Billion) Forecast, by Application 2019 & 2032
- Table 26: Australia Substation Industry Revenue (USD Billion) Forecast, by Application 2019 & 2032
- Table 27: Indonesia Substation Industry Revenue (USD Billion) Forecast, by Application 2019 & 2032
- Table 28: Phillipes Substation Industry Revenue (USD Billion) Forecast, by Application 2019 & 2032
- Table 29: Singapore Substation Industry Revenue (USD Billion) Forecast, by Application 2019 & 2032
- Table 30: Thailandc Substation Industry Revenue (USD Billion) Forecast, by Application 2019 & 2032
- Table 31: Rest of Asia Pacific Substation Industry Revenue (USD Billion) Forecast, by Application 2019 & 2032
- Table 32: Global Substation Industry Revenue USD Billion Forecast, by Country 2019 & 2032
- Table 33: Brazil Substation Industry Revenue (USD Billion) Forecast, by Application 2019 & 2032
- Table 34: Argentina Substation Industry Revenue (USD Billion) Forecast, by Application 2019 & 2032
- Table 35: Peru Substation Industry Revenue (USD Billion) Forecast, by Application 2019 & 2032
- Table 36: Chile Substation Industry Revenue (USD Billion) Forecast, by Application 2019 & 2032
- Table 37: Colombia Substation Industry Revenue (USD Billion) Forecast, by Application 2019 & 2032
- Table 38: Ecuador Substation Industry Revenue (USD Billion) Forecast, by Application 2019 & 2032
- Table 39: Venezuela Substation Industry Revenue (USD Billion) Forecast, by Application 2019 & 2032
- Table 40: Rest of South America Substation Industry Revenue (USD Billion) Forecast, by Application 2019 & 2032
- Table 41: Global Substation Industry Revenue USD Billion Forecast, by Country 2019 & 2032
- Table 42: United Arab Emirates Substation Industry Revenue (USD Billion) Forecast, by Application 2019 & 2032
- Table 43: Saudi Arabia Substation Industry Revenue (USD Billion) Forecast, by Application 2019 & 2032
- Table 44: South Africa Substation Industry Revenue (USD Billion) Forecast, by Application 2019 & 2032
- Table 45: Rest of Middle East and Africa Substation Industry Revenue (USD Billion) Forecast, by Application 2019 & 2032
- Table 46: Global Substation Industry Revenue USD Billion Forecast, by Voltage 2019 & 2032
- Table 47: Global Substation Industry Revenue USD Billion Forecast, by Application 2019 & 2032
- Table 48: Global Substation Industry Revenue USD Billion Forecast, by Country 2019 & 2032
- Table 49: Global Substation Industry Revenue USD Billion Forecast, by Voltage 2019 & 2032
- Table 50: Global Substation Industry Revenue USD Billion Forecast, by Application 2019 & 2032
- Table 51: Global Substation Industry Revenue USD Billion Forecast, by Country 2019 & 2032
- Table 52: Global Substation Industry Revenue USD Billion Forecast, by Voltage 2019 & 2032
- Table 53: Global Substation Industry Revenue USD Billion Forecast, by Application 2019 & 2032
- Table 54: Global Substation Industry Revenue USD Billion Forecast, by Country 2019 & 2032
- Table 55: Global Substation Industry Revenue USD Billion Forecast, by Voltage 2019 & 2032
- Table 56: Global Substation Industry Revenue USD Billion Forecast, by Application 2019 & 2032
- Table 57: Global Substation Industry Revenue USD Billion Forecast, by Country 2019 & 2032
- Table 58: Global Substation Industry Revenue USD Billion Forecast, by Voltage 2019 & 2032
- Table 59: Global Substation Industry Revenue USD Billion Forecast, by Application 2019 & 2032
- Table 60: Global Substation Industry Revenue USD Billion Forecast, by Country 2019 & 2032
Frequently Asked Questions
1. What is the projected Compound Annual Growth Rate (CAGR) of the Substation Industry?
The projected CAGR is approximately 4.50%.
2. Which companies are prominent players in the Substation Industry?
Key companies in the market include Kirloskar Electric Company Ltd, ABB Ltd, Larsen & Toubro Ltd, Alfanar Group, Lucy Group Ltd, Schneider Electric SE, Eaton Corporation PLC, General Electric Company, C&S Electric Limited*List Not Exhaustive, Siemens AG.
3. What are the main segments of the Substation Industry?
The market segments include Voltage, Application.
4. Can you provide details about the market size?
The market size is estimated to be USD 139.23 USD Billion as of 2022.
5. What are some drivers contributing to market growth?
4.; Growing Energy Demand4.; Renewable Energy Transition.
6. What are the notable trends driving market growth?
Power Utilities Segment to Witness Significant Growth.
7. Are there any restraints impacting market growth?
4.; Phasing out of Conventional Sources of Electricity.
8. Can you provide examples of recent developments in the market?
Strategic partnerships between utilities and technology providers
9. What pricing options are available for accessing the report?
Pricing options include single-user, multi-user, and enterprise licenses priced at USD 4750, USD 5250, and USD 8750 respectively.
10. Is the market size provided in terms of value or volume?
The market size is provided in terms of value, measured in USD Billion.
11. Are there any specific market keywords associated with the report?
Yes, the market keyword associated with the report is "Substation Industry," which aids in identifying and referencing the specific market segment covered.
12. How do I determine which pricing option suits my needs best?
The pricing options vary based on user requirements and access needs. Individual users may opt for single-user licenses, while businesses requiring broader access may choose multi-user or enterprise licenses for cost-effective access to the report.
13. Are there any additional resources or data provided in the Substation Industry report?
While the report offers comprehensive insights, it's advisable to review the specific contents or supplementary materials provided to ascertain if additional resources or data are available.
14. How can I stay updated on further developments or reports in the Substation Industry?
To stay informed about further developments, trends, and reports in the Substation Industry, consider subscribing to industry newsletters, following relevant companies and organizations, or regularly checking reputable industry news sources and publications.
Methodology
Step 1 - Identification of Relevant Samples Size from Population Database


Step 2 - Approaches for Defining Global Market Size (Value, Volume* & Price*)

Note*: In applicable scenarios
Step 3 - Data Sources
Primary Research
- Web Analytics
- Survey Reports
- Research Institute
- Latest Research Reports
- Opinion Leaders
Secondary Research
- Annual Reports
- White Paper
- Latest Press Release
- Industry Association
- Paid Database
- Investor Presentations

Step 4 - Data Triangulation
Involves using different sources of information in order to increase the validity of a study
These sources are likely to be stakeholders in a program - participants, other researchers, program staff, other community members, and so on.
Then we put all data in single framework & apply various statistical tools to find out the dynamic on the market.
During the analysis stage, feedback from the stakeholder groups would be compared to determine areas of agreement as well as areas of divergence


