
Key Insights
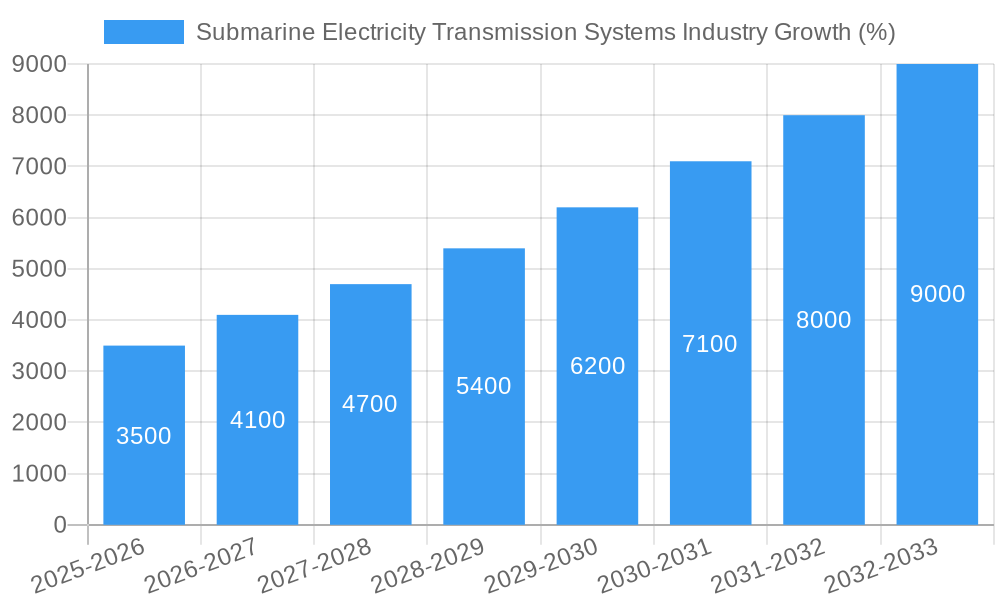
The Submarine Electricity Transmission Systems (SETS) market is experiencing robust growth, projected to maintain a Compound Annual Growth Rate (CAGR) exceeding 14% from 2025 to 2033. This expansion is fueled by the increasing demand for renewable energy sources, particularly offshore wind power, necessitating efficient and reliable long-distance electricity transmission. The rising need to connect remote islands and countries, coupled with the expansion of offshore oil and gas operations, further contributes to market growth. HVDC systems are currently dominant, leveraging their superior efficiency in transmitting high-voltage direct current over long subsea distances. However, HVAC systems are also seeing increased adoption in specific applications, driven by existing infrastructure and cost considerations. Key market players, including ABB, Nexans, Prysmian, and Siemens, are investing heavily in research and development to enhance cable technology, improve installation techniques, and broaden their geographical reach. Regional growth is diverse, with North America and Europe leading due to established offshore wind farms and robust energy grids. Asia-Pacific shows significant potential, driven by large-scale renewable energy projects and infrastructure development. While challenges remain, such as high initial investment costs and environmental concerns, technological advancements and supportive government policies are mitigating these restraints, ensuring continued market expansion.
The competitive landscape is characterized by a mix of established multinational corporations and specialized cable manufacturers. Consolidation and strategic partnerships are anticipated as companies seek to expand their market share and technological capabilities. Future growth will likely be influenced by factors like the global transition to cleaner energy, advancements in high-voltage direct current (HVDC) and alternating current (HVAC) technologies, and government initiatives supporting sustainable energy infrastructure. The ongoing development of innovative cable materials and installation methods will further contribute to reducing costs and improving reliability, creating new opportunities for market players and supporting continued, strong growth within the SETS market.
Submarine Electricity Transmission Systems Industry Market Report: 2019-2033
This comprehensive report provides a detailed analysis of the Submarine Electricity Transmission Systems industry, encompassing market dynamics, growth trends, regional dominance, product landscape, key players, and future outlook. The study period covers 2019-2033, with a base year of 2025 and a forecast period of 2025-2033. The report is invaluable for industry professionals, investors, and strategic decision-makers seeking to understand and capitalize on opportunities within this rapidly evolving sector. The parent market is the broader electricity transmission industry, while the child market focuses specifically on submarine cable systems.
Submarine Electricity Transmission Systems Industry Market Dynamics & Structure
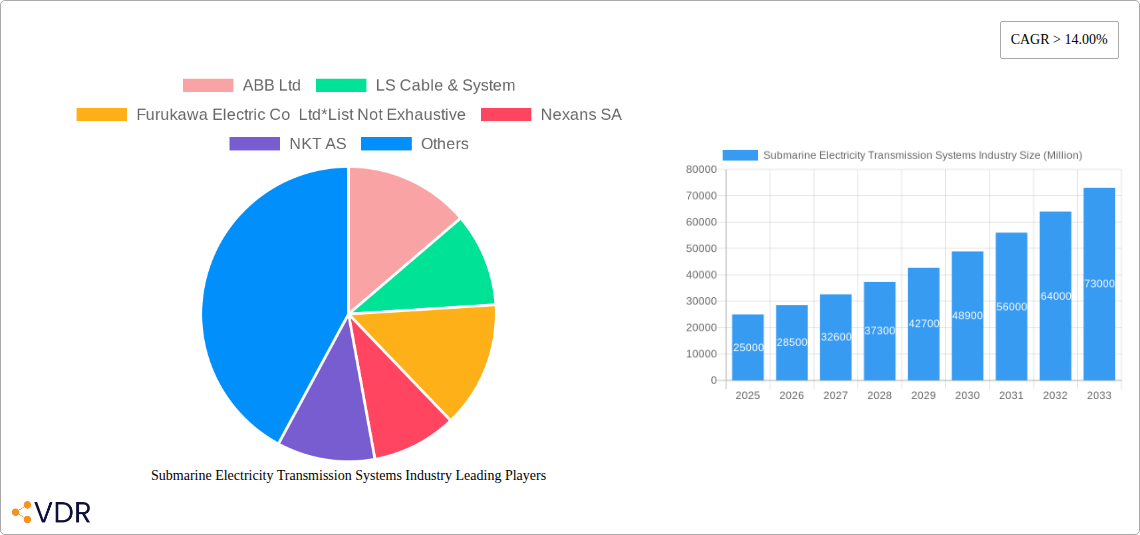
The submarine electricity transmission systems market is characterized by moderate concentration, with key players such as ABB Ltd, LS Cable & System, Furukawa Electric Co Ltd, Nexans SA, NKT AS, Prysmian SpA, Siemens AG, Norddeutsche Seekabelwerke GmbH (NSW), and Sumitomo Electric Industries Ltd holding significant market share. However, the market is witnessing increased competition from emerging players.
- Market Concentration: The top 5 players collectively hold approximately xx% of the market share (2024). This indicates a moderately consolidated market with opportunities for both expansion and disruptive innovation.
- Technological Innovation: The industry is driven by continuous technological advancements in HVDC (High-Voltage Direct Current) and HVAC (High-Voltage Alternating Current) systems, focusing on improved cable materials, higher transmission capacities, and enhanced reliability.
- Regulatory Frameworks: Government policies promoting renewable energy integration, particularly offshore wind farms, significantly influence market growth. Stringent safety and environmental regulations also shape industry practices.
- Competitive Product Substitutes: While submarine cables remain the primary method for long-distance underwater power transmission, competing technologies like wireless power transmission are in early stages of development and are not yet significant substitutes.
- End-User Demographics: The primary end-users are offshore wind turbine farms, offshore oil & gas platforms, and intercountry/island connectors. The growth of offshore renewable energy is a major driver of market expansion.
- M&A Trends: The past five years have seen xx M&A deals, with a total value of xx million, driven by strategic acquisitions to expand geographic reach and technological capabilities.
Submarine Electricity Transmission Systems Industry Growth Trends & Insights
The global submarine electricity transmission systems market exhibited a CAGR of xx% during the historical period (2019-2024) and is projected to grow at a CAGR of xx% during the forecast period (2025-2033), reaching a market size of xx million by 2033. This growth is primarily fueled by the increasing demand for renewable energy sources, particularly offshore wind power, coupled with the need for reliable and efficient interconnections between countries and islands. The adoption rate of HVDC systems is significantly higher than HVAC systems due to their superior long-distance transmission capabilities. Technological advancements, such as the development of higher-capacity cables and improved installation techniques, are further accelerating market expansion. Shifts in consumer behavior, driven by heightened environmental awareness and a focus on sustainable energy solutions, are also contributing factors.
Dominant Regions, Countries, or Segments in Submarine Electricity Transmission Systems Industry
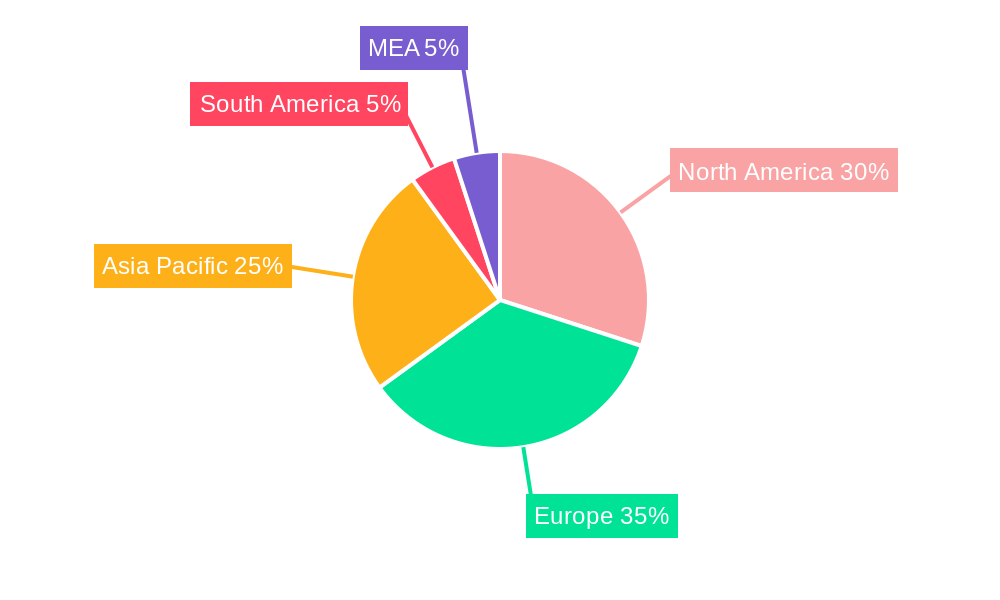
Europe and Asia-Pacific are currently the dominant regions in the submarine electricity transmission systems market, driven by substantial investments in offshore wind energy projects and expanding interconnections.
- Europe: The region's strong commitment to renewable energy targets, coupled with extensive offshore wind farm development, drives significant demand for submarine cables. Germany, the UK, and Denmark are leading countries in this market.
- Asia-Pacific: Rapid economic growth and rising energy demand in China, Japan, and South Korea fuel investments in inter-country power transmission infrastructure and offshore wind projects.
- North America: While comparatively smaller, the North American market is witnessing growth driven by offshore wind initiatives in the US.
- Dominant Segments: The offshore wind turbine segment constitutes the largest end-user segment, holding approximately xx% of the market share, with significant growth potential. HVDC systems dominate the system type segment due to their efficiency in long-distance transmission.
Key Drivers:
- Extensive offshore wind farm development.
- Government support for renewable energy and grid modernization.
- Growing demand for inter-country and island electricity connections.
Market Share and Growth Potential: Europe holds the largest market share, but the Asia-Pacific region is expected to exhibit faster growth in the coming years.
Submarine Electricity Transmission Systems Industry Product Landscape
Submarine electricity transmission systems encompass HVDC and HVAC cables, along with associated converter stations and installation services. Recent innovations focus on higher voltage and capacity cables, improved insulation materials, and enhanced monitoring technologies. Key product features include increased power transmission capabilities, improved reliability, and reduced environmental impact. Unique selling propositions revolve around superior performance under harsh underwater conditions, longevity, and integration with smart grid technologies.
Key Drivers, Barriers & Challenges in Submarine Electricity Transmission Systems Industry
Key Drivers:
- The global transition to renewable energy sources, particularly offshore wind, is a primary driver.
- Increasing demand for reliable and efficient long-distance power transmission.
- Government incentives and policies supporting grid modernization and renewable energy integration.
Key Challenges:
- High initial capital investment costs associated with cable manufacturing, installation, and maintenance.
- Complex regulatory approvals and environmental permitting processes.
- Technological challenges in developing higher-capacity and more reliable cables for deep-water applications. Supply chain disruptions have increased lead times and costs, impacting project timelines and profitability.
Emerging Opportunities in Submarine Electricity Transmission Systems Industry
- Expansion into untapped markets in developing economies.
- Growing demand for interconnector projects to facilitate regional energy trading.
- Technological advancements in high-voltage direct current (HVDC) and high-voltage alternating current (HVAC) systems.
Growth Accelerators in the Submarine Electricity Transmission Systems Industry Industry
Strategic partnerships between cable manufacturers, energy companies, and grid operators are driving growth. Technological innovations in cable materials and installation techniques are also creating new opportunities. The expansion of offshore wind farms, especially in Asia-Pacific, is a significant catalyst.
Key Players Shaping the Submarine Electricity Transmission Systems Industry Market
- ABB Ltd
- LS Cable & System
- Furukawa Electric Co Ltd
- Nexans SA
- NKT AS
- Prysmian SpA
- Siemens AG
- Norddeutsche Seekabelwerke GmbH(NSW)
- Sumitomo Electric Industries Ltd
Notable Milestones in Submarine Electricity Transmission Systems Industry Sector
- December 2022: DEME Offshore and LS Cable & System secured a contract from Vattenfall for the Norfolk Vanguard offshore wind farm, involving approximately 320 kilometers of HVDC export cables. This highlights the increasing scale of offshore wind projects and the demand for high-capacity submarine cables.
- November 2022: RTE Réseau de Transport d'Electricité awarded a contract for the construction of four HVDC converter stations and two offshore platforms, showcasing significant investment in the transmission of renewable energy from offshore wind farms.
In-Depth Submarine Electricity Transmission Systems Industry Market Outlook
The submarine electricity transmission systems market is poised for sustained growth, driven by the global energy transition, expansion of offshore renewable energy, and increased interconnectivity needs. Strategic partnerships and technological advancements will further shape the market landscape. The focus on sustainability and the development of advanced cable technologies will create significant opportunities for players in this industry. The market is expected to witness a rise in innovative solutions, including advanced cable materials and installation methods.
Submarine Electricity Transmission Systems Industry Segmentation
-
1. End User
- 1.1. Offshore Wind Turbines
- 1.2. Offshore Oil and Gas Platforms
- 1.3. Intercountry and Island Connectors
-
2. System Type
- 2.1. HVDC System
- 2.2. HVAC System
Submarine Electricity Transmission Systems Industry Segmentation By Geography
- 1. North America
- 2. Europe
- 3. Asia Pacific
- 4. South America
- 5. Middle East and Africa
Submarine Electricity Transmission Systems Industry REPORT HIGHLIGHTS
| Aspects | Details |
|---|---|
| Study Period | 2019-2033 |
| Base Year | 2024 |
| Estimated Year | 2025 |
| Forecast Period | 2025-2033 |
| Historical Period | 2019-2024 |
| Growth Rate | CAGR of > 14.00% from 2019-2033 |
| Segmentation |
|
Table of Contents
- 1. Introduction
- 1.1. Research Scope
- 1.2. Market Segmentation
- 1.3. Research Methodology
- 1.4. Definitions and Assumptions
- 2. Executive Summary
- 2.1. Introduction
- 3. Market Dynamics
- 3.1. Introduction
- 3.2. Market Drivers
- 3.2.1. 4.; Substantial Investments and Efforts to Modernize the T&D Grid
- 3.3. Market Restrains
- 3.3.1. 4.; Expansion of High Voltage Direct Current (HVDC) Networks
- 3.4. Market Trends
- 3.4.1. HVDC System to Witness Significant Growth
- 4. Market Factor Analysis
- 4.1. Porters Five Forces
- 4.2. Supply/Value Chain
- 4.3. PESTEL analysis
- 4.4. Market Entropy
- 4.5. Patent/Trademark Analysis
- 5. Global Submarine Electricity Transmission Systems Industry Analysis, Insights and Forecast, 2019-2031
- 5.1. Market Analysis, Insights and Forecast - by End User
- 5.1.1. Offshore Wind Turbines
- 5.1.2. Offshore Oil and Gas Platforms
- 5.1.3. Intercountry and Island Connectors
- 5.2. Market Analysis, Insights and Forecast - by System Type
- 5.2.1. HVDC System
- 5.2.2. HVAC System
- 5.3. Market Analysis, Insights and Forecast - by Region
- 5.3.1. North America
- 5.3.2. Europe
- 5.3.3. Asia Pacific
- 5.3.4. South America
- 5.3.5. Middle East and Africa
- 5.1. Market Analysis, Insights and Forecast - by End User
- 6. North America Submarine Electricity Transmission Systems Industry Analysis, Insights and Forecast, 2019-2031
- 6.1. Market Analysis, Insights and Forecast - by End User
- 6.1.1. Offshore Wind Turbines
- 6.1.2. Offshore Oil and Gas Platforms
- 6.1.3. Intercountry and Island Connectors
- 6.2. Market Analysis, Insights and Forecast - by System Type
- 6.2.1. HVDC System
- 6.2.2. HVAC System
- 6.1. Market Analysis, Insights and Forecast - by End User
- 7. Europe Submarine Electricity Transmission Systems Industry Analysis, Insights and Forecast, 2019-2031
- 7.1. Market Analysis, Insights and Forecast - by End User
- 7.1.1. Offshore Wind Turbines
- 7.1.2. Offshore Oil and Gas Platforms
- 7.1.3. Intercountry and Island Connectors
- 7.2. Market Analysis, Insights and Forecast - by System Type
- 7.2.1. HVDC System
- 7.2.2. HVAC System
- 7.1. Market Analysis, Insights and Forecast - by End User
- 8. Asia Pacific Submarine Electricity Transmission Systems Industry Analysis, Insights and Forecast, 2019-2031
- 8.1. Market Analysis, Insights and Forecast - by End User
- 8.1.1. Offshore Wind Turbines
- 8.1.2. Offshore Oil and Gas Platforms
- 8.1.3. Intercountry and Island Connectors
- 8.2. Market Analysis, Insights and Forecast - by System Type
- 8.2.1. HVDC System
- 8.2.2. HVAC System
- 8.1. Market Analysis, Insights and Forecast - by End User
- 9. South America Submarine Electricity Transmission Systems Industry Analysis, Insights and Forecast, 2019-2031
- 9.1. Market Analysis, Insights and Forecast - by End User
- 9.1.1. Offshore Wind Turbines
- 9.1.2. Offshore Oil and Gas Platforms
- 9.1.3. Intercountry and Island Connectors
- 9.2. Market Analysis, Insights and Forecast - by System Type
- 9.2.1. HVDC System
- 9.2.2. HVAC System
- 9.1. Market Analysis, Insights and Forecast - by End User
- 10. Middle East and Africa Submarine Electricity Transmission Systems Industry Analysis, Insights and Forecast, 2019-2031
- 10.1. Market Analysis, Insights and Forecast - by End User
- 10.1.1. Offshore Wind Turbines
- 10.1.2. Offshore Oil and Gas Platforms
- 10.1.3. Intercountry and Island Connectors
- 10.2. Market Analysis, Insights and Forecast - by System Type
- 10.2.1. HVDC System
- 10.2.2. HVAC System
- 10.1. Market Analysis, Insights and Forecast - by End User
- 11. North America Submarine Electricity Transmission Systems Industry Analysis, Insights and Forecast, 2019-2031
- 11.1. Market Analysis, Insights and Forecast - By Country/Sub-region
- 11.1.1 United States
- 11.1.2 Canada
- 11.1.3 Mexico
- 12. Europe Submarine Electricity Transmission Systems Industry Analysis, Insights and Forecast, 2019-2031
- 12.1. Market Analysis, Insights and Forecast - By Country/Sub-region
- 12.1.1 Germany
- 12.1.2 United Kingdom
- 12.1.3 France
- 12.1.4 Spain
- 12.1.5 Italy
- 12.1.6 Spain
- 12.1.7 Belgium
- 12.1.8 Netherland
- 12.1.9 Nordics
- 12.1.10 Rest of Europe
- 13. Asia Pacific Submarine Electricity Transmission Systems Industry Analysis, Insights and Forecast, 2019-2031
- 13.1. Market Analysis, Insights and Forecast - By Country/Sub-region
- 13.1.1 China
- 13.1.2 Japan
- 13.1.3 India
- 13.1.4 South Korea
- 13.1.5 Southeast Asia
- 13.1.6 Australia
- 13.1.7 Indonesia
- 13.1.8 Phillipes
- 13.1.9 Singapore
- 13.1.10 Thailandc
- 13.1.11 Rest of Asia Pacific
- 14. South America Submarine Electricity Transmission Systems Industry Analysis, Insights and Forecast, 2019-2031
- 14.1. Market Analysis, Insights and Forecast - By Country/Sub-region
- 14.1.1 Brazil
- 14.1.2 Argentina
- 14.1.3 Peru
- 14.1.4 Chile
- 14.1.5 Colombia
- 14.1.6 Ecuador
- 14.1.7 Venezuela
- 14.1.8 Rest of South America
- 15. North America Submarine Electricity Transmission Systems Industry Analysis, Insights and Forecast, 2019-2031
- 15.1. Market Analysis, Insights and Forecast - By Country/Sub-region
- 15.1.1 United States
- 15.1.2 Canada
- 15.1.3 Mexico
- 16. MEA Submarine Electricity Transmission Systems Industry Analysis, Insights and Forecast, 2019-2031
- 16.1. Market Analysis, Insights and Forecast - By Country/Sub-region
- 16.1.1 United Arab Emirates
- 16.1.2 Saudi Arabia
- 16.1.3 South Africa
- 16.1.4 Rest of Middle East and Africa
- 17. Competitive Analysis
- 17.1. Global Market Share Analysis 2024
- 17.2. Company Profiles
- 17.2.1 ABB Ltd
- 17.2.1.1. Overview
- 17.2.1.2. Products
- 17.2.1.3. SWOT Analysis
- 17.2.1.4. Recent Developments
- 17.2.1.5. Financials (Based on Availability)
- 17.2.2 LS Cable & System
- 17.2.2.1. Overview
- 17.2.2.2. Products
- 17.2.2.3. SWOT Analysis
- 17.2.2.4. Recent Developments
- 17.2.2.5. Financials (Based on Availability)
- 17.2.3 Furukawa Electric Co Ltd*List Not Exhaustive
- 17.2.3.1. Overview
- 17.2.3.2. Products
- 17.2.3.3. SWOT Analysis
- 17.2.3.4. Recent Developments
- 17.2.3.5. Financials (Based on Availability)
- 17.2.4 Nexans SA
- 17.2.4.1. Overview
- 17.2.4.2. Products
- 17.2.4.3. SWOT Analysis
- 17.2.4.4. Recent Developments
- 17.2.4.5. Financials (Based on Availability)
- 17.2.5 NKT AS
- 17.2.5.1. Overview
- 17.2.5.2. Products
- 17.2.5.3. SWOT Analysis
- 17.2.5.4. Recent Developments
- 17.2.5.5. Financials (Based on Availability)
- 17.2.6 Prysmian SpA
- 17.2.6.1. Overview
- 17.2.6.2. Products
- 17.2.6.3. SWOT Analysis
- 17.2.6.4. Recent Developments
- 17.2.6.5. Financials (Based on Availability)
- 17.2.7 Siemens AG
- 17.2.7.1. Overview
- 17.2.7.2. Products
- 17.2.7.3. SWOT Analysis
- 17.2.7.4. Recent Developments
- 17.2.7.5. Financials (Based on Availability)
- 17.2.8 Norddeutsche Seekabelwerke GmbH(NSW)
- 17.2.8.1. Overview
- 17.2.8.2. Products
- 17.2.8.3. SWOT Analysis
- 17.2.8.4. Recent Developments
- 17.2.8.5. Financials (Based on Availability)
- 17.2.9 Sumitomo Electric Industries Ltd
- 17.2.9.1. Overview
- 17.2.9.2. Products
- 17.2.9.3. SWOT Analysis
- 17.2.9.4. Recent Developments
- 17.2.9.5. Financials (Based on Availability)
- 17.2.1 ABB Ltd
List of Figures
- Figure 1: Global Submarine Electricity Transmission Systems Industry Revenue Breakdown (Million, %) by Region 2024 & 2032
- Figure 2: North America Submarine Electricity Transmission Systems Industry Revenue (Million), by Country 2024 & 2032
- Figure 3: North America Submarine Electricity Transmission Systems Industry Revenue Share (%), by Country 2024 & 2032
- Figure 4: Europe Submarine Electricity Transmission Systems Industry Revenue (Million), by Country 2024 & 2032
- Figure 5: Europe Submarine Electricity Transmission Systems Industry Revenue Share (%), by Country 2024 & 2032
- Figure 6: Asia Pacific Submarine Electricity Transmission Systems Industry Revenue (Million), by Country 2024 & 2032
- Figure 7: Asia Pacific Submarine Electricity Transmission Systems Industry Revenue Share (%), by Country 2024 & 2032
- Figure 8: South America Submarine Electricity Transmission Systems Industry Revenue (Million), by Country 2024 & 2032
- Figure 9: South America Submarine Electricity Transmission Systems Industry Revenue Share (%), by Country 2024 & 2032
- Figure 10: North America Submarine Electricity Transmission Systems Industry Revenue (Million), by Country 2024 & 2032
- Figure 11: North America Submarine Electricity Transmission Systems Industry Revenue Share (%), by Country 2024 & 2032
- Figure 12: MEA Submarine Electricity Transmission Systems Industry Revenue (Million), by Country 2024 & 2032
- Figure 13: MEA Submarine Electricity Transmission Systems Industry Revenue Share (%), by Country 2024 & 2032
- Figure 14: North America Submarine Electricity Transmission Systems Industry Revenue (Million), by End User 2024 & 2032
- Figure 15: North America Submarine Electricity Transmission Systems Industry Revenue Share (%), by End User 2024 & 2032
- Figure 16: North America Submarine Electricity Transmission Systems Industry Revenue (Million), by System Type 2024 & 2032
- Figure 17: North America Submarine Electricity Transmission Systems Industry Revenue Share (%), by System Type 2024 & 2032
- Figure 18: North America Submarine Electricity Transmission Systems Industry Revenue (Million), by Country 2024 & 2032
- Figure 19: North America Submarine Electricity Transmission Systems Industry Revenue Share (%), by Country 2024 & 2032
- Figure 20: Europe Submarine Electricity Transmission Systems Industry Revenue (Million), by End User 2024 & 2032
- Figure 21: Europe Submarine Electricity Transmission Systems Industry Revenue Share (%), by End User 2024 & 2032
- Figure 22: Europe Submarine Electricity Transmission Systems Industry Revenue (Million), by System Type 2024 & 2032
- Figure 23: Europe Submarine Electricity Transmission Systems Industry Revenue Share (%), by System Type 2024 & 2032
- Figure 24: Europe Submarine Electricity Transmission Systems Industry Revenue (Million), by Country 2024 & 2032
- Figure 25: Europe Submarine Electricity Transmission Systems Industry Revenue Share (%), by Country 2024 & 2032
- Figure 26: Asia Pacific Submarine Electricity Transmission Systems Industry Revenue (Million), by End User 2024 & 2032
- Figure 27: Asia Pacific Submarine Electricity Transmission Systems Industry Revenue Share (%), by End User 2024 & 2032
- Figure 28: Asia Pacific Submarine Electricity Transmission Systems Industry Revenue (Million), by System Type 2024 & 2032
- Figure 29: Asia Pacific Submarine Electricity Transmission Systems Industry Revenue Share (%), by System Type 2024 & 2032
- Figure 30: Asia Pacific Submarine Electricity Transmission Systems Industry Revenue (Million), by Country 2024 & 2032
- Figure 31: Asia Pacific Submarine Electricity Transmission Systems Industry Revenue Share (%), by Country 2024 & 2032
- Figure 32: South America Submarine Electricity Transmission Systems Industry Revenue (Million), by End User 2024 & 2032
- Figure 33: South America Submarine Electricity Transmission Systems Industry Revenue Share (%), by End User 2024 & 2032
- Figure 34: South America Submarine Electricity Transmission Systems Industry Revenue (Million), by System Type 2024 & 2032
- Figure 35: South America Submarine Electricity Transmission Systems Industry Revenue Share (%), by System Type 2024 & 2032
- Figure 36: South America Submarine Electricity Transmission Systems Industry Revenue (Million), by Country 2024 & 2032
- Figure 37: South America Submarine Electricity Transmission Systems Industry Revenue Share (%), by Country 2024 & 2032
- Figure 38: Middle East and Africa Submarine Electricity Transmission Systems Industry Revenue (Million), by End User 2024 & 2032
- Figure 39: Middle East and Africa Submarine Electricity Transmission Systems Industry Revenue Share (%), by End User 2024 & 2032
- Figure 40: Middle East and Africa Submarine Electricity Transmission Systems Industry Revenue (Million), by System Type 2024 & 2032
- Figure 41: Middle East and Africa Submarine Electricity Transmission Systems Industry Revenue Share (%), by System Type 2024 & 2032
- Figure 42: Middle East and Africa Submarine Electricity Transmission Systems Industry Revenue (Million), by Country 2024 & 2032
- Figure 43: Middle East and Africa Submarine Electricity Transmission Systems Industry Revenue Share (%), by Country 2024 & 2032
List of Tables
- Table 1: Global Submarine Electricity Transmission Systems Industry Revenue Million Forecast, by Region 2019 & 2032
- Table 2: Global Submarine Electricity Transmission Systems Industry Revenue Million Forecast, by End User 2019 & 2032
- Table 3: Global Submarine Electricity Transmission Systems Industry Revenue Million Forecast, by System Type 2019 & 2032
- Table 4: Global Submarine Electricity Transmission Systems Industry Revenue Million Forecast, by Region 2019 & 2032
- Table 5: Global Submarine Electricity Transmission Systems Industry Revenue Million Forecast, by Country 2019 & 2032
- Table 6: United States Submarine Electricity Transmission Systems Industry Revenue (Million) Forecast, by Application 2019 & 2032
- Table 7: Canada Submarine Electricity Transmission Systems Industry Revenue (Million) Forecast, by Application 2019 & 2032
- Table 8: Mexico Submarine Electricity Transmission Systems Industry Revenue (Million) Forecast, by Application 2019 & 2032
- Table 9: Global Submarine Electricity Transmission Systems Industry Revenue Million Forecast, by Country 2019 & 2032
- Table 10: Germany Submarine Electricity Transmission Systems Industry Revenue (Million) Forecast, by Application 2019 & 2032
- Table 11: United Kingdom Submarine Electricity Transmission Systems Industry Revenue (Million) Forecast, by Application 2019 & 2032
- Table 12: France Submarine Electricity Transmission Systems Industry Revenue (Million) Forecast, by Application 2019 & 2032
- Table 13: Spain Submarine Electricity Transmission Systems Industry Revenue (Million) Forecast, by Application 2019 & 2032
- Table 14: Italy Submarine Electricity Transmission Systems Industry Revenue (Million) Forecast, by Application 2019 & 2032
- Table 15: Spain Submarine Electricity Transmission Systems Industry Revenue (Million) Forecast, by Application 2019 & 2032
- Table 16: Belgium Submarine Electricity Transmission Systems Industry Revenue (Million) Forecast, by Application 2019 & 2032
- Table 17: Netherland Submarine Electricity Transmission Systems Industry Revenue (Million) Forecast, by Application 2019 & 2032
- Table 18: Nordics Submarine Electricity Transmission Systems Industry Revenue (Million) Forecast, by Application 2019 & 2032
- Table 19: Rest of Europe Submarine Electricity Transmission Systems Industry Revenue (Million) Forecast, by Application 2019 & 2032
- Table 20: Global Submarine Electricity Transmission Systems Industry Revenue Million Forecast, by Country 2019 & 2032
- Table 21: China Submarine Electricity Transmission Systems Industry Revenue (Million) Forecast, by Application 2019 & 2032
- Table 22: Japan Submarine Electricity Transmission Systems Industry Revenue (Million) Forecast, by Application 2019 & 2032
- Table 23: India Submarine Electricity Transmission Systems Industry Revenue (Million) Forecast, by Application 2019 & 2032
- Table 24: South Korea Submarine Electricity Transmission Systems Industry Revenue (Million) Forecast, by Application 2019 & 2032
- Table 25: Southeast Asia Submarine Electricity Transmission Systems Industry Revenue (Million) Forecast, by Application 2019 & 2032
- Table 26: Australia Submarine Electricity Transmission Systems Industry Revenue (Million) Forecast, by Application 2019 & 2032
- Table 27: Indonesia Submarine Electricity Transmission Systems Industry Revenue (Million) Forecast, by Application 2019 & 2032
- Table 28: Phillipes Submarine Electricity Transmission Systems Industry Revenue (Million) Forecast, by Application 2019 & 2032
- Table 29: Singapore Submarine Electricity Transmission Systems Industry Revenue (Million) Forecast, by Application 2019 & 2032
- Table 30: Thailandc Submarine Electricity Transmission Systems Industry Revenue (Million) Forecast, by Application 2019 & 2032
- Table 31: Rest of Asia Pacific Submarine Electricity Transmission Systems Industry Revenue (Million) Forecast, by Application 2019 & 2032
- Table 32: Global Submarine Electricity Transmission Systems Industry Revenue Million Forecast, by Country 2019 & 2032
- Table 33: Brazil Submarine Electricity Transmission Systems Industry Revenue (Million) Forecast, by Application 2019 & 2032
- Table 34: Argentina Submarine Electricity Transmission Systems Industry Revenue (Million) Forecast, by Application 2019 & 2032
- Table 35: Peru Submarine Electricity Transmission Systems Industry Revenue (Million) Forecast, by Application 2019 & 2032
- Table 36: Chile Submarine Electricity Transmission Systems Industry Revenue (Million) Forecast, by Application 2019 & 2032
- Table 37: Colombia Submarine Electricity Transmission Systems Industry Revenue (Million) Forecast, by Application 2019 & 2032
- Table 38: Ecuador Submarine Electricity Transmission Systems Industry Revenue (Million) Forecast, by Application 2019 & 2032
- Table 39: Venezuela Submarine Electricity Transmission Systems Industry Revenue (Million) Forecast, by Application 2019 & 2032
- Table 40: Rest of South America Submarine Electricity Transmission Systems Industry Revenue (Million) Forecast, by Application 2019 & 2032
- Table 41: Global Submarine Electricity Transmission Systems Industry Revenue Million Forecast, by Country 2019 & 2032
- Table 42: United States Submarine Electricity Transmission Systems Industry Revenue (Million) Forecast, by Application 2019 & 2032
- Table 43: Canada Submarine Electricity Transmission Systems Industry Revenue (Million) Forecast, by Application 2019 & 2032
- Table 44: Mexico Submarine Electricity Transmission Systems Industry Revenue (Million) Forecast, by Application 2019 & 2032
- Table 45: Global Submarine Electricity Transmission Systems Industry Revenue Million Forecast, by Country 2019 & 2032
- Table 46: United Arab Emirates Submarine Electricity Transmission Systems Industry Revenue (Million) Forecast, by Application 2019 & 2032
- Table 47: Saudi Arabia Submarine Electricity Transmission Systems Industry Revenue (Million) Forecast, by Application 2019 & 2032
- Table 48: South Africa Submarine Electricity Transmission Systems Industry Revenue (Million) Forecast, by Application 2019 & 2032
- Table 49: Rest of Middle East and Africa Submarine Electricity Transmission Systems Industry Revenue (Million) Forecast, by Application 2019 & 2032
- Table 50: Global Submarine Electricity Transmission Systems Industry Revenue Million Forecast, by End User 2019 & 2032
- Table 51: Global Submarine Electricity Transmission Systems Industry Revenue Million Forecast, by System Type 2019 & 2032
- Table 52: Global Submarine Electricity Transmission Systems Industry Revenue Million Forecast, by Country 2019 & 2032
- Table 53: Global Submarine Electricity Transmission Systems Industry Revenue Million Forecast, by End User 2019 & 2032
- Table 54: Global Submarine Electricity Transmission Systems Industry Revenue Million Forecast, by System Type 2019 & 2032
- Table 55: Global Submarine Electricity Transmission Systems Industry Revenue Million Forecast, by Country 2019 & 2032
- Table 56: Global Submarine Electricity Transmission Systems Industry Revenue Million Forecast, by End User 2019 & 2032
- Table 57: Global Submarine Electricity Transmission Systems Industry Revenue Million Forecast, by System Type 2019 & 2032
- Table 58: Global Submarine Electricity Transmission Systems Industry Revenue Million Forecast, by Country 2019 & 2032
- Table 59: Global Submarine Electricity Transmission Systems Industry Revenue Million Forecast, by End User 2019 & 2032
- Table 60: Global Submarine Electricity Transmission Systems Industry Revenue Million Forecast, by System Type 2019 & 2032
- Table 61: Global Submarine Electricity Transmission Systems Industry Revenue Million Forecast, by Country 2019 & 2032
- Table 62: Global Submarine Electricity Transmission Systems Industry Revenue Million Forecast, by End User 2019 & 2032
- Table 63: Global Submarine Electricity Transmission Systems Industry Revenue Million Forecast, by System Type 2019 & 2032
- Table 64: Global Submarine Electricity Transmission Systems Industry Revenue Million Forecast, by Country 2019 & 2032
Frequently Asked Questions
1. What is the projected Compound Annual Growth Rate (CAGR) of the Submarine Electricity Transmission Systems Industry?
The projected CAGR is approximately > 14.00%.
2. Which companies are prominent players in the Submarine Electricity Transmission Systems Industry?
Key companies in the market include ABB Ltd, LS Cable & System, Furukawa Electric Co Ltd*List Not Exhaustive, Nexans SA, NKT AS, Prysmian SpA, Siemens AG, Norddeutsche Seekabelwerke GmbH(NSW), Sumitomo Electric Industries Ltd.
3. What are the main segments of the Submarine Electricity Transmission Systems Industry?
The market segments include End User, System Type.
4. Can you provide details about the market size?
The market size is estimated to be USD XX Million as of 2022.
5. What are some drivers contributing to market growth?
4.; Substantial Investments and Efforts to Modernize the T&D Grid.
6. What are the notable trends driving market growth?
HVDC System to Witness Significant Growth.
7. Are there any restraints impacting market growth?
4.; Expansion of High Voltage Direct Current (HVDC) Networks.
8. Can you provide examples of recent developments in the market?
December 2022: DEME Offshore and LS Cable & System signed a contract with Vattenfall to provide export cables on the 1.8 GW Norfolk Vanguard offshore wind farm. The consortium will be responsible for the design, engineering, procurement, manufacturing, testing, and installation of around 320 kilometers of HVDC export cables for the offshore route.
9. What pricing options are available for accessing the report?
Pricing options include single-user, multi-user, and enterprise licenses priced at USD 4750, USD 5250, and USD 8750 respectively.
10. Is the market size provided in terms of value or volume?
The market size is provided in terms of value, measured in Million.
11. Are there any specific market keywords associated with the report?
Yes, the market keyword associated with the report is "Submarine Electricity Transmission Systems Industry," which aids in identifying and referencing the specific market segment covered.
12. How do I determine which pricing option suits my needs best?
The pricing options vary based on user requirements and access needs. Individual users may opt for single-user licenses, while businesses requiring broader access may choose multi-user or enterprise licenses for cost-effective access to the report.
13. Are there any additional resources or data provided in the Submarine Electricity Transmission Systems Industry report?
While the report offers comprehensive insights, it's advisable to review the specific contents or supplementary materials provided to ascertain if additional resources or data are available.
14. How can I stay updated on further developments or reports in the Submarine Electricity Transmission Systems Industry?
To stay informed about further developments, trends, and reports in the Submarine Electricity Transmission Systems Industry, consider subscribing to industry newsletters, following relevant companies and organizations, or regularly checking reputable industry news sources and publications.
Methodology
Step 1 - Identification of Relevant Samples Size from Population Database


Step 2 - Approaches for Defining Global Market Size (Value, Volume* & Price*)

Note*: In applicable scenarios
Step 3 - Data Sources
Primary Research
- Web Analytics
- Survey Reports
- Research Institute
- Latest Research Reports
- Opinion Leaders
Secondary Research
- Annual Reports
- White Paper
- Latest Press Release
- Industry Association
- Paid Database
- Investor Presentations

Step 4 - Data Triangulation
Involves using different sources of information in order to increase the validity of a study
These sources are likely to be stakeholders in a program - participants, other researchers, program staff, other community members, and so on.
Then we put all data in single framework & apply various statistical tools to find out the dynamic on the market.
During the analysis stage, feedback from the stakeholder groups would be compared to determine areas of agreement as well as areas of divergence


