
Key Insights
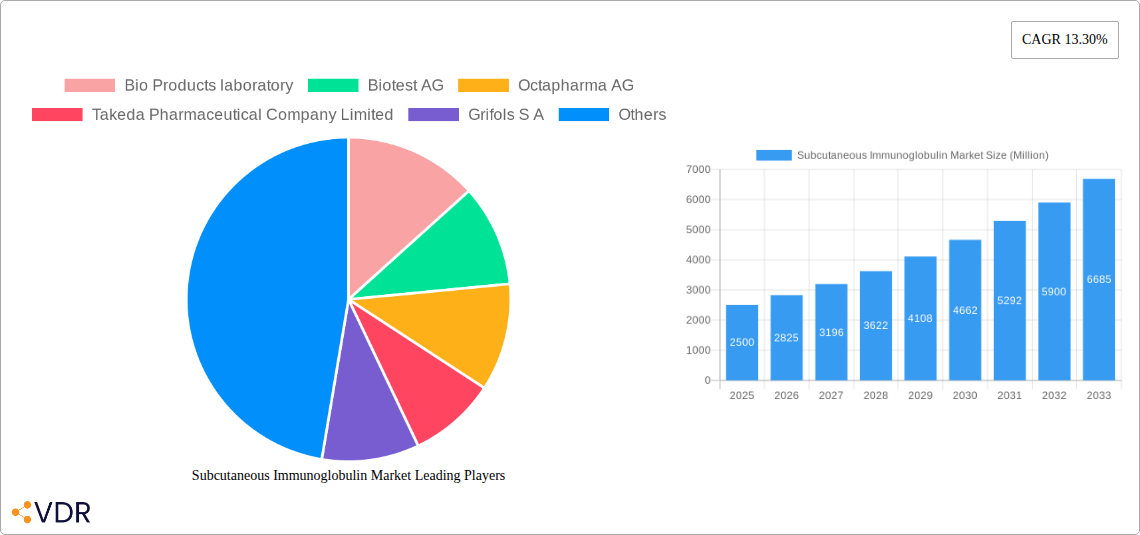
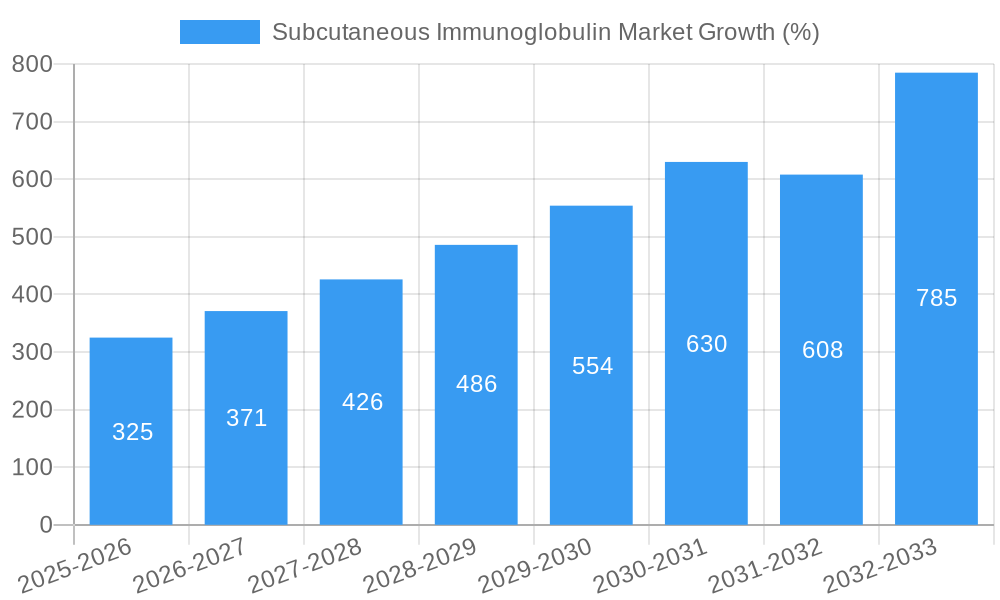
The subcutaneous immunoglobulin (SCIG) market is experiencing robust growth, driven by the increasing prevalence of primary and secondary immunodeficiency diseases, coupled with the rising adoption of homecare settings for SCIG administration. The market, valued at approximately $XX million in 2025, is projected to exhibit a compound annual growth rate (CAGR) of 13.30% from 2025 to 2033. This significant expansion is fueled by several factors. Firstly, advancements in SCIG formulations, leading to improved patient convenience and efficacy, are boosting market uptake. Secondly, a growing awareness among healthcare professionals and patients about the benefits of SCIG over intravenous immunoglobulin (IVIG) is contributing to a shift in treatment preferences. Finally, the expanding geriatric population, which is more susceptible to immunodeficiency disorders, further propels market growth. While the rising cost of SCIG therapies presents a challenge, the overall market outlook remains positive.
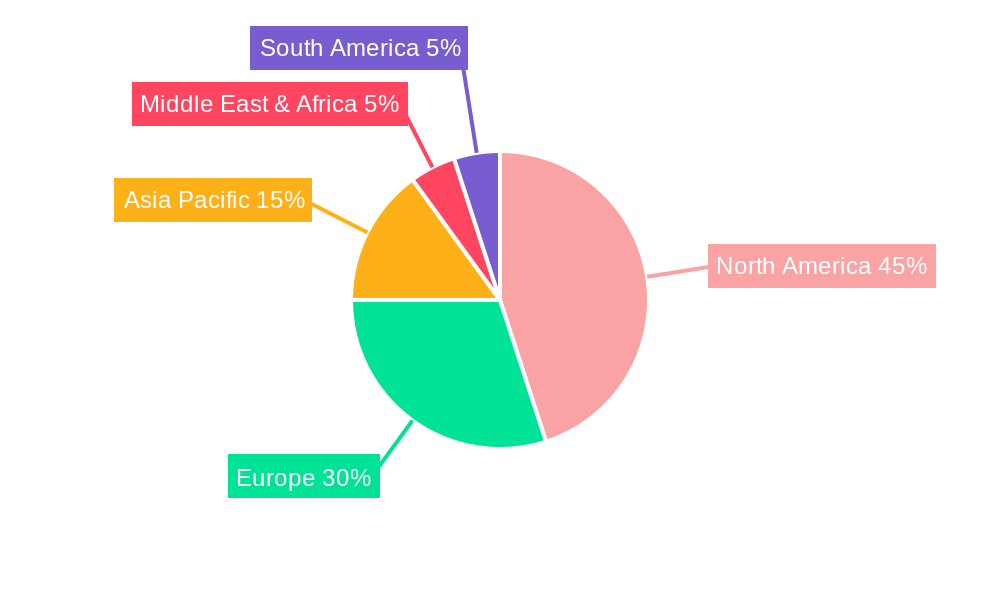
Geographic segmentation reveals significant regional variations. North America, particularly the United States, currently holds a dominant market share due to high healthcare expenditure and robust healthcare infrastructure. However, the Asia Pacific region is anticipated to witness the fastest growth rate during the forecast period, driven by increasing healthcare awareness, rising disposable incomes, and expanding healthcare infrastructure in emerging economies like India and China. Europe is also a substantial market, with Germany, the United Kingdom, and France representing key contributors. Competitive landscape analysis reveals a mix of established players like Bio Products Laboratory, Biotest AG, and Octapharma AG, alongside other significant pharmaceutical companies. These companies are actively engaged in research and development, aiming to improve product efficacy and expand their market presence through strategic collaborations and acquisitions. The competitive dynamics are expected to intensify in the coming years as more innovative SCIG formulations are introduced.
Subcutaneous Immunoglobulin Market: A Comprehensive Report (2019-2033)
This comprehensive report provides an in-depth analysis of the Subcutaneous Immunoglobulin Market, encompassing market dynamics, growth trends, regional analysis, competitive landscape, and future outlook. The report covers the period from 2019 to 2033, with 2025 as the base year and forecast period extending to 2033. The parent market is the Immunoglobulin Market, and the child market is the Subcutaneous Immunoglobulin Market, specifically focusing on applications in Primary and Secondary Immunodeficiency Diseases. The market size is expressed in Million Units.
Subcutaneous Immunoglobulin Market Market Dynamics & Structure
The Subcutaneous Immunoglobulin Market is characterized by a moderately concentrated landscape with key players like Bio Products Laboratory, Biotest AG, Octapharma AG, Takeda Pharmaceutical Company Limited, Grifols S.A, CSL Behring, and Kedrion S.p.A. Technological innovations, primarily focused on enhancing delivery systems and efficacy, are significant drivers. Stringent regulatory frameworks governing biologics influence market access and product approvals. Competitive pressures arise from alternative therapies and the emergence of biosimilars. End-user demographics, skewed towards aging populations with higher susceptibility to immunodeficiencies, significantly influence market demand. The market has witnessed a moderate level of M&A activity in recent years, with approximately xx deals completed between 2019 and 2024, representing a xx% market share consolidation.
- Market Concentration: Moderately concentrated, with top 7 players holding xx% market share in 2024.
- Technological Innovation: Focus on improved delivery systems, enhanced efficacy, and reduced adverse events.
- Regulatory Landscape: Stringent regulations governing biologics impact market entry and pricing.
- Competitive Substitutes: Alternative therapies and biosimilars pose competitive challenges.
- End-User Demographics: Aging population and rising prevalence of immunodeficiencies drive demand.
- M&A Activity: Approximately xx M&A deals (2019-2024), resulting in xx% market consolidation. Innovation barriers include high R&D costs and complex regulatory pathways.
Subcutaneous Immunoglobulin Market Growth Trends & Insights
The Subcutaneous Immunoglobulin Market exhibits a steady growth trajectory, driven by rising prevalence of immunodeficiency disorders, increasing awareness among healthcare professionals and patients, and advancements in subcutaneous delivery technologies. From 2019 to 2024, the market experienced a CAGR of xx%, reaching xx million units in 2024. This growth is anticipated to continue, with a projected CAGR of xx% from 2025 to 2033, reaching xx million units by 2033. The increasing adoption of homecare settings contributes significantly to market expansion, reflecting a shift towards convenient and cost-effective treatment options. Technological disruptions, such as the development of novel formulations and improved delivery devices, further fuel market growth. Consumer behavior is shifting towards greater preference for subcutaneous administration due to its convenience and reduced healthcare burden.
Dominant Regions, Countries, or Segments in Subcutaneous Immunoglobulin Market
North America currently dominates the Subcutaneous Immunoglobulin Market, driven by high healthcare expenditure, robust healthcare infrastructure, and a large patient population. Europe follows as a significant market, showcasing substantial growth potential. The "Primary Immunodeficiency Diseases" segment holds the largest market share within the application segment, due to the higher prevalence and severity of these conditions. Within the end-user segment, hospitals currently dominate, but the homecare settings segment is exhibiting the fastest growth due to increasing patient preference and cost-effectiveness.
- Key Drivers (North America): High healthcare expenditure, advanced healthcare infrastructure, large patient population.
- Key Drivers (Europe): Growing awareness, increasing healthcare spending, favorable regulatory environment.
- Segment Dominance: Primary Immunodeficiency Diseases (By Application) and Hospitals (By End-User) are currently leading segments.
- Growth Potential: Homecare settings segment shows the fastest growth rate.
Subcutaneous Immunoglobulin Market Product Landscape
The Subcutaneous Immunoglobulin market offers a range of products, differing in immunoglobulin concentration, formulation (liquid or lyophilized), and delivery device. Recent innovations focus on improving patient convenience and reducing injection volume and frequency. Products are differentiated based on their purity, efficacy, safety profiles, and ease of administration. Technological advancements are geared towards developing long-acting formulations, reducing the number of injections required.
Key Drivers, Barriers & Challenges in Subcutaneous Immunoglobulin Market
Key Drivers: Rising prevalence of primary and secondary immunodeficiency diseases, growing awareness among healthcare professionals and patients, technological advancements in delivery systems, and increasing demand for convenient and cost-effective treatment options.
Challenges: High cost of treatment, complex regulatory pathways, potential for adverse reactions, and the need for ongoing patient education and monitoring. Supply chain disruptions caused by xx impacted production by xx% in 2022. Competition from biosimilars is also a significant challenge, potentially impacting pricing strategies.
Emerging Opportunities in Subcutaneous Immunoglobulin Market
Emerging opportunities lie in developing novel formulations with improved efficacy and reduced adverse events, expanding into untapped markets in developing countries, and leveraging telemedicine to improve patient management and adherence. Growing demand for personalized medicine creates opportunities for tailored immunoglobulin therapies.
Growth Accelerators in the Subcutaneous Immunoglobulin Market Industry
Long-term growth is fuelled by technological advancements in delivery systems, strategic partnerships between pharmaceutical companies and healthcare providers, and market expansion into emerging economies. Increasing investment in research and development will also play a crucial role in accelerating market growth.
Key Players Shaping the Subcutaneous Immunoglobulin Market Market
- Bio Products Laboratory
- Biotest AG
- Octapharma AG
- Takeda Pharmaceutical Company Limited
- Grifols S.A
- CSL Behring
- Kedrion S.p.A
Notable Milestones in Subcutaneous Immunoglobulin Market Sector
- August 2022: Genentech (Roche Group) announced successful Phase III trial results for a subcutaneous formulation of Tecentriq (atezolizumab).
- April 2022: Kite Pharma Inc. received FDA approval for axicabtagene ciloleucel (Yescarta) for adult patients with large B-cell lymphoma.
In-Depth Subcutaneous Immunoglobulin Market Market Outlook
The Subcutaneous Immunoglobulin Market is poised for robust growth, driven by continued technological innovation, expanding patient populations, and increasing healthcare spending. Strategic partnerships and market penetration in emerging economies present significant opportunities for market players. The focus on personalized medicine and improved delivery systems will further shape the market landscape in the coming years.
Subcutaneous Immunoglobulin Market Segmentation
-
1. Application
- 1.1. Primary Immunodeficiency Diseases
- 1.2. Secondary Immunodeficiency Diseases
- 1.3. Other Applications
-
2. End User
- 2.1. Hospitals
- 2.2. Homecare Settings
- 2.3. Other End Users
Subcutaneous Immunoglobulin Market Segmentation By Geography
-
1. North America
- 1.1. United States
- 1.2. Canada
- 1.3. Mexico
-
2. Europe
- 2.1. Germany
- 2.2. United Kingdom
- 2.3. France
- 2.4. Italy
- 2.5. Spain
- 2.6. Rest of Europe
-
3. Asia Pacific
- 3.1. China
- 3.2. Japan
- 3.3. India
- 3.4. Australia
- 3.5. South Korea
- 3.6. Rest of Asia Pacific
-
4. Middle East and Africa
- 4.1. GCC
- 4.2. South Africa
- 4.3. Rest of Middle East and Africa
-
5. South America
- 5.1. Brazil
- 5.2. Argentina
- 5.3. Rest of South America
Subcutaneous Immunoglobulin Market REPORT HIGHLIGHTS
| Aspects | Details |
|---|---|
| Study Period | 2019-2033 |
| Base Year | 2024 |
| Estimated Year | 2025 |
| Forecast Period | 2025-2033 |
| Historical Period | 2019-2024 |
| Growth Rate | CAGR of 13.30% from 2019-2033 |
| Segmentation |
|
Table of Contents
- 1. Introduction
- 1.1. Research Scope
- 1.2. Market Segmentation
- 1.3. Research Methodology
- 1.4. Definitions and Assumptions
- 2. Executive Summary
- 2.1. Introduction
- 3. Market Dynamics
- 3.1. Introduction
- 3.2. Market Drivers
- 3.2.1. Increasing Use of Subcutaneous Immunoglobulin For Primary Immunodeficiency Disorders; Increasing Geriatric Population and Patient Pool; Rise in Government Funding
- 3.3. Market Restrains
- 3.3.1. Stringent Government Regulations; High Risk of Side Effects
- 3.4. Market Trends
- 3.4.1. Secondary Immunodeficiency Diseases are Expected to Witness a Strong Growth Over the Forecast Period
- 4. Market Factor Analysis
- 4.1. Porters Five Forces
- 4.2. Supply/Value Chain
- 4.3. PESTEL analysis
- 4.4. Market Entropy
- 4.5. Patent/Trademark Analysis
- 5. Global Subcutaneous Immunoglobulin Market Analysis, Insights and Forecast, 2019-2031
- 5.1. Market Analysis, Insights and Forecast - by Application
- 5.1.1. Primary Immunodeficiency Diseases
- 5.1.2. Secondary Immunodeficiency Diseases
- 5.1.3. Other Applications
- 5.2. Market Analysis, Insights and Forecast - by End User
- 5.2.1. Hospitals
- 5.2.2. Homecare Settings
- 5.2.3. Other End Users
- 5.3. Market Analysis, Insights and Forecast - by Region
- 5.3.1. North America
- 5.3.2. Europe
- 5.3.3. Asia Pacific
- 5.3.4. Middle East and Africa
- 5.3.5. South America
- 5.1. Market Analysis, Insights and Forecast - by Application
- 6. North America Subcutaneous Immunoglobulin Market Analysis, Insights and Forecast, 2019-2031
- 6.1. Market Analysis, Insights and Forecast - by Application
- 6.1.1. Primary Immunodeficiency Diseases
- 6.1.2. Secondary Immunodeficiency Diseases
- 6.1.3. Other Applications
- 6.2. Market Analysis, Insights and Forecast - by End User
- 6.2.1. Hospitals
- 6.2.2. Homecare Settings
- 6.2.3. Other End Users
- 6.1. Market Analysis, Insights and Forecast - by Application
- 7. Europe Subcutaneous Immunoglobulin Market Analysis, Insights and Forecast, 2019-2031
- 7.1. Market Analysis, Insights and Forecast - by Application
- 7.1.1. Primary Immunodeficiency Diseases
- 7.1.2. Secondary Immunodeficiency Diseases
- 7.1.3. Other Applications
- 7.2. Market Analysis, Insights and Forecast - by End User
- 7.2.1. Hospitals
- 7.2.2. Homecare Settings
- 7.2.3. Other End Users
- 7.1. Market Analysis, Insights and Forecast - by Application
- 8. Asia Pacific Subcutaneous Immunoglobulin Market Analysis, Insights and Forecast, 2019-2031
- 8.1. Market Analysis, Insights and Forecast - by Application
- 8.1.1. Primary Immunodeficiency Diseases
- 8.1.2. Secondary Immunodeficiency Diseases
- 8.1.3. Other Applications
- 8.2. Market Analysis, Insights and Forecast - by End User
- 8.2.1. Hospitals
- 8.2.2. Homecare Settings
- 8.2.3. Other End Users
- 8.1. Market Analysis, Insights and Forecast - by Application
- 9. Middle East and Africa Subcutaneous Immunoglobulin Market Analysis, Insights and Forecast, 2019-2031
- 9.1. Market Analysis, Insights and Forecast - by Application
- 9.1.1. Primary Immunodeficiency Diseases
- 9.1.2. Secondary Immunodeficiency Diseases
- 9.1.3. Other Applications
- 9.2. Market Analysis, Insights and Forecast - by End User
- 9.2.1. Hospitals
- 9.2.2. Homecare Settings
- 9.2.3. Other End Users
- 9.1. Market Analysis, Insights and Forecast - by Application
- 10. South America Subcutaneous Immunoglobulin Market Analysis, Insights and Forecast, 2019-2031
- 10.1. Market Analysis, Insights and Forecast - by Application
- 10.1.1. Primary Immunodeficiency Diseases
- 10.1.2. Secondary Immunodeficiency Diseases
- 10.1.3. Other Applications
- 10.2. Market Analysis, Insights and Forecast - by End User
- 10.2.1. Hospitals
- 10.2.2. Homecare Settings
- 10.2.3. Other End Users
- 10.1. Market Analysis, Insights and Forecast - by Application
- 11. North America Subcutaneous Immunoglobulin Market Analysis, Insights and Forecast, 2019-2031
- 11.1. Market Analysis, Insights and Forecast - By Country/Sub-region
- 11.1.1 United States
- 11.1.2 Canada
- 11.1.3 Mexico
- 12. Europe Subcutaneous Immunoglobulin Market Analysis, Insights and Forecast, 2019-2031
- 12.1. Market Analysis, Insights and Forecast - By Country/Sub-region
- 12.1.1 Germany
- 12.1.2 United Kingdom
- 12.1.3 France
- 12.1.4 Italy
- 12.1.5 Spain
- 12.1.6 Rest of Europe
- 13. Asia Pacific Subcutaneous Immunoglobulin Market Analysis, Insights and Forecast, 2019-2031
- 13.1. Market Analysis, Insights and Forecast - By Country/Sub-region
- 13.1.1 China
- 13.1.2 Japan
- 13.1.3 India
- 13.1.4 Australia
- 13.1.5 South Korea
- 13.1.6 Rest of Asia Pacific
- 14. Middle East and Africa Subcutaneous Immunoglobulin Market Analysis, Insights and Forecast, 2019-2031
- 14.1. Market Analysis, Insights and Forecast - By Country/Sub-region
- 14.1.1 GCC
- 14.1.2 South Africa
- 14.1.3 Rest of Middle East and Africa
- 15. South America Subcutaneous Immunoglobulin Market Analysis, Insights and Forecast, 2019-2031
- 15.1. Market Analysis, Insights and Forecast - By Country/Sub-region
- 15.1.1 Brazil
- 15.1.2 Argentina
- 15.1.3 Rest of South America
- 16. Competitive Analysis
- 16.1. Global Market Share Analysis 2024
- 16.2. Company Profiles
- 16.2.1 Bio Products laboratory
- 16.2.1.1. Overview
- 16.2.1.2. Products
- 16.2.1.3. SWOT Analysis
- 16.2.1.4. Recent Developments
- 16.2.1.5. Financials (Based on Availability)
- 16.2.2 Biotest AG
- 16.2.2.1. Overview
- 16.2.2.2. Products
- 16.2.2.3. SWOT Analysis
- 16.2.2.4. Recent Developments
- 16.2.2.5. Financials (Based on Availability)
- 16.2.3 Octapharma AG
- 16.2.3.1. Overview
- 16.2.3.2. Products
- 16.2.3.3. SWOT Analysis
- 16.2.3.4. Recent Developments
- 16.2.3.5. Financials (Based on Availability)
- 16.2.4 Takeda Pharmaceutical Company Limited
- 16.2.4.1. Overview
- 16.2.4.2. Products
- 16.2.4.3. SWOT Analysis
- 16.2.4.4. Recent Developments
- 16.2.4.5. Financials (Based on Availability)
- 16.2.5 Grifols S A
- 16.2.5.1. Overview
- 16.2.5.2. Products
- 16.2.5.3. SWOT Analysis
- 16.2.5.4. Recent Developments
- 16.2.5.5. Financials (Based on Availability)
- 16.2.6 CSL Behring
- 16.2.6.1. Overview
- 16.2.6.2. Products
- 16.2.6.3. SWOT Analysis
- 16.2.6.4. Recent Developments
- 16.2.6.5. Financials (Based on Availability)
- 16.2.7 Kedrion S p A
- 16.2.7.1. Overview
- 16.2.7.2. Products
- 16.2.7.3. SWOT Analysis
- 16.2.7.4. Recent Developments
- 16.2.7.5. Financials (Based on Availability)
- 16.2.1 Bio Products laboratory
List of Figures
- Figure 1: Global Subcutaneous Immunoglobulin Market Revenue Breakdown (Million, %) by Region 2024 & 2032
- Figure 2: Global Subcutaneous Immunoglobulin Market Volume Breakdown (K Unit, %) by Region 2024 & 2032
- Figure 3: North America Subcutaneous Immunoglobulin Market Revenue (Million), by Country 2024 & 2032
- Figure 4: North America Subcutaneous Immunoglobulin Market Volume (K Unit), by Country 2024 & 2032
- Figure 5: North America Subcutaneous Immunoglobulin Market Revenue Share (%), by Country 2024 & 2032
- Figure 6: North America Subcutaneous Immunoglobulin Market Volume Share (%), by Country 2024 & 2032
- Figure 7: Europe Subcutaneous Immunoglobulin Market Revenue (Million), by Country 2024 & 2032
- Figure 8: Europe Subcutaneous Immunoglobulin Market Volume (K Unit), by Country 2024 & 2032
- Figure 9: Europe Subcutaneous Immunoglobulin Market Revenue Share (%), by Country 2024 & 2032
- Figure 10: Europe Subcutaneous Immunoglobulin Market Volume Share (%), by Country 2024 & 2032
- Figure 11: Asia Pacific Subcutaneous Immunoglobulin Market Revenue (Million), by Country 2024 & 2032
- Figure 12: Asia Pacific Subcutaneous Immunoglobulin Market Volume (K Unit), by Country 2024 & 2032
- Figure 13: Asia Pacific Subcutaneous Immunoglobulin Market Revenue Share (%), by Country 2024 & 2032
- Figure 14: Asia Pacific Subcutaneous Immunoglobulin Market Volume Share (%), by Country 2024 & 2032
- Figure 15: Middle East and Africa Subcutaneous Immunoglobulin Market Revenue (Million), by Country 2024 & 2032
- Figure 16: Middle East and Africa Subcutaneous Immunoglobulin Market Volume (K Unit), by Country 2024 & 2032
- Figure 17: Middle East and Africa Subcutaneous Immunoglobulin Market Revenue Share (%), by Country 2024 & 2032
- Figure 18: Middle East and Africa Subcutaneous Immunoglobulin Market Volume Share (%), by Country 2024 & 2032
- Figure 19: South America Subcutaneous Immunoglobulin Market Revenue (Million), by Country 2024 & 2032
- Figure 20: South America Subcutaneous Immunoglobulin Market Volume (K Unit), by Country 2024 & 2032
- Figure 21: South America Subcutaneous Immunoglobulin Market Revenue Share (%), by Country 2024 & 2032
- Figure 22: South America Subcutaneous Immunoglobulin Market Volume Share (%), by Country 2024 & 2032
- Figure 23: North America Subcutaneous Immunoglobulin Market Revenue (Million), by Application 2024 & 2032
- Figure 24: North America Subcutaneous Immunoglobulin Market Volume (K Unit), by Application 2024 & 2032
- Figure 25: North America Subcutaneous Immunoglobulin Market Revenue Share (%), by Application 2024 & 2032
- Figure 26: North America Subcutaneous Immunoglobulin Market Volume Share (%), by Application 2024 & 2032
- Figure 27: North America Subcutaneous Immunoglobulin Market Revenue (Million), by End User 2024 & 2032
- Figure 28: North America Subcutaneous Immunoglobulin Market Volume (K Unit), by End User 2024 & 2032
- Figure 29: North America Subcutaneous Immunoglobulin Market Revenue Share (%), by End User 2024 & 2032
- Figure 30: North America Subcutaneous Immunoglobulin Market Volume Share (%), by End User 2024 & 2032
- Figure 31: North America Subcutaneous Immunoglobulin Market Revenue (Million), by Country 2024 & 2032
- Figure 32: North America Subcutaneous Immunoglobulin Market Volume (K Unit), by Country 2024 & 2032
- Figure 33: North America Subcutaneous Immunoglobulin Market Revenue Share (%), by Country 2024 & 2032
- Figure 34: North America Subcutaneous Immunoglobulin Market Volume Share (%), by Country 2024 & 2032
- Figure 35: Europe Subcutaneous Immunoglobulin Market Revenue (Million), by Application 2024 & 2032
- Figure 36: Europe Subcutaneous Immunoglobulin Market Volume (K Unit), by Application 2024 & 2032
- Figure 37: Europe Subcutaneous Immunoglobulin Market Revenue Share (%), by Application 2024 & 2032
- Figure 38: Europe Subcutaneous Immunoglobulin Market Volume Share (%), by Application 2024 & 2032
- Figure 39: Europe Subcutaneous Immunoglobulin Market Revenue (Million), by End User 2024 & 2032
- Figure 40: Europe Subcutaneous Immunoglobulin Market Volume (K Unit), by End User 2024 & 2032
- Figure 41: Europe Subcutaneous Immunoglobulin Market Revenue Share (%), by End User 2024 & 2032
- Figure 42: Europe Subcutaneous Immunoglobulin Market Volume Share (%), by End User 2024 & 2032
- Figure 43: Europe Subcutaneous Immunoglobulin Market Revenue (Million), by Country 2024 & 2032
- Figure 44: Europe Subcutaneous Immunoglobulin Market Volume (K Unit), by Country 2024 & 2032
- Figure 45: Europe Subcutaneous Immunoglobulin Market Revenue Share (%), by Country 2024 & 2032
- Figure 46: Europe Subcutaneous Immunoglobulin Market Volume Share (%), by Country 2024 & 2032
- Figure 47: Asia Pacific Subcutaneous Immunoglobulin Market Revenue (Million), by Application 2024 & 2032
- Figure 48: Asia Pacific Subcutaneous Immunoglobulin Market Volume (K Unit), by Application 2024 & 2032
- Figure 49: Asia Pacific Subcutaneous Immunoglobulin Market Revenue Share (%), by Application 2024 & 2032
- Figure 50: Asia Pacific Subcutaneous Immunoglobulin Market Volume Share (%), by Application 2024 & 2032
- Figure 51: Asia Pacific Subcutaneous Immunoglobulin Market Revenue (Million), by End User 2024 & 2032
- Figure 52: Asia Pacific Subcutaneous Immunoglobulin Market Volume (K Unit), by End User 2024 & 2032
- Figure 53: Asia Pacific Subcutaneous Immunoglobulin Market Revenue Share (%), by End User 2024 & 2032
- Figure 54: Asia Pacific Subcutaneous Immunoglobulin Market Volume Share (%), by End User 2024 & 2032
- Figure 55: Asia Pacific Subcutaneous Immunoglobulin Market Revenue (Million), by Country 2024 & 2032
- Figure 56: Asia Pacific Subcutaneous Immunoglobulin Market Volume (K Unit), by Country 2024 & 2032
- Figure 57: Asia Pacific Subcutaneous Immunoglobulin Market Revenue Share (%), by Country 2024 & 2032
- Figure 58: Asia Pacific Subcutaneous Immunoglobulin Market Volume Share (%), by Country 2024 & 2032
- Figure 59: Middle East and Africa Subcutaneous Immunoglobulin Market Revenue (Million), by Application 2024 & 2032
- Figure 60: Middle East and Africa Subcutaneous Immunoglobulin Market Volume (K Unit), by Application 2024 & 2032
- Figure 61: Middle East and Africa Subcutaneous Immunoglobulin Market Revenue Share (%), by Application 2024 & 2032
- Figure 62: Middle East and Africa Subcutaneous Immunoglobulin Market Volume Share (%), by Application 2024 & 2032
- Figure 63: Middle East and Africa Subcutaneous Immunoglobulin Market Revenue (Million), by End User 2024 & 2032
- Figure 64: Middle East and Africa Subcutaneous Immunoglobulin Market Volume (K Unit), by End User 2024 & 2032
- Figure 65: Middle East and Africa Subcutaneous Immunoglobulin Market Revenue Share (%), by End User 2024 & 2032
- Figure 66: Middle East and Africa Subcutaneous Immunoglobulin Market Volume Share (%), by End User 2024 & 2032
- Figure 67: Middle East and Africa Subcutaneous Immunoglobulin Market Revenue (Million), by Country 2024 & 2032
- Figure 68: Middle East and Africa Subcutaneous Immunoglobulin Market Volume (K Unit), by Country 2024 & 2032
- Figure 69: Middle East and Africa Subcutaneous Immunoglobulin Market Revenue Share (%), by Country 2024 & 2032
- Figure 70: Middle East and Africa Subcutaneous Immunoglobulin Market Volume Share (%), by Country 2024 & 2032
- Figure 71: South America Subcutaneous Immunoglobulin Market Revenue (Million), by Application 2024 & 2032
- Figure 72: South America Subcutaneous Immunoglobulin Market Volume (K Unit), by Application 2024 & 2032
- Figure 73: South America Subcutaneous Immunoglobulin Market Revenue Share (%), by Application 2024 & 2032
- Figure 74: South America Subcutaneous Immunoglobulin Market Volume Share (%), by Application 2024 & 2032
- Figure 75: South America Subcutaneous Immunoglobulin Market Revenue (Million), by End User 2024 & 2032
- Figure 76: South America Subcutaneous Immunoglobulin Market Volume (K Unit), by End User 2024 & 2032
- Figure 77: South America Subcutaneous Immunoglobulin Market Revenue Share (%), by End User 2024 & 2032
- Figure 78: South America Subcutaneous Immunoglobulin Market Volume Share (%), by End User 2024 & 2032
- Figure 79: South America Subcutaneous Immunoglobulin Market Revenue (Million), by Country 2024 & 2032
- Figure 80: South America Subcutaneous Immunoglobulin Market Volume (K Unit), by Country 2024 & 2032
- Figure 81: South America Subcutaneous Immunoglobulin Market Revenue Share (%), by Country 2024 & 2032
- Figure 82: South America Subcutaneous Immunoglobulin Market Volume Share (%), by Country 2024 & 2032
List of Tables
- Table 1: Global Subcutaneous Immunoglobulin Market Revenue Million Forecast, by Region 2019 & 2032
- Table 2: Global Subcutaneous Immunoglobulin Market Volume K Unit Forecast, by Region 2019 & 2032
- Table 3: Global Subcutaneous Immunoglobulin Market Revenue Million Forecast, by Application 2019 & 2032
- Table 4: Global Subcutaneous Immunoglobulin Market Volume K Unit Forecast, by Application 2019 & 2032
- Table 5: Global Subcutaneous Immunoglobulin Market Revenue Million Forecast, by End User 2019 & 2032
- Table 6: Global Subcutaneous Immunoglobulin Market Volume K Unit Forecast, by End User 2019 & 2032
- Table 7: Global Subcutaneous Immunoglobulin Market Revenue Million Forecast, by Region 2019 & 2032
- Table 8: Global Subcutaneous Immunoglobulin Market Volume K Unit Forecast, by Region 2019 & 2032
- Table 9: Global Subcutaneous Immunoglobulin Market Revenue Million Forecast, by Country 2019 & 2032
- Table 10: Global Subcutaneous Immunoglobulin Market Volume K Unit Forecast, by Country 2019 & 2032
- Table 11: United States Subcutaneous Immunoglobulin Market Revenue (Million) Forecast, by Application 2019 & 2032
- Table 12: United States Subcutaneous Immunoglobulin Market Volume (K Unit) Forecast, by Application 2019 & 2032
- Table 13: Canada Subcutaneous Immunoglobulin Market Revenue (Million) Forecast, by Application 2019 & 2032
- Table 14: Canada Subcutaneous Immunoglobulin Market Volume (K Unit) Forecast, by Application 2019 & 2032
- Table 15: Mexico Subcutaneous Immunoglobulin Market Revenue (Million) Forecast, by Application 2019 & 2032
- Table 16: Mexico Subcutaneous Immunoglobulin Market Volume (K Unit) Forecast, by Application 2019 & 2032
- Table 17: Global Subcutaneous Immunoglobulin Market Revenue Million Forecast, by Country 2019 & 2032
- Table 18: Global Subcutaneous Immunoglobulin Market Volume K Unit Forecast, by Country 2019 & 2032
- Table 19: Germany Subcutaneous Immunoglobulin Market Revenue (Million) Forecast, by Application 2019 & 2032
- Table 20: Germany Subcutaneous Immunoglobulin Market Volume (K Unit) Forecast, by Application 2019 & 2032
- Table 21: United Kingdom Subcutaneous Immunoglobulin Market Revenue (Million) Forecast, by Application 2019 & 2032
- Table 22: United Kingdom Subcutaneous Immunoglobulin Market Volume (K Unit) Forecast, by Application 2019 & 2032
- Table 23: France Subcutaneous Immunoglobulin Market Revenue (Million) Forecast, by Application 2019 & 2032
- Table 24: France Subcutaneous Immunoglobulin Market Volume (K Unit) Forecast, by Application 2019 & 2032
- Table 25: Italy Subcutaneous Immunoglobulin Market Revenue (Million) Forecast, by Application 2019 & 2032
- Table 26: Italy Subcutaneous Immunoglobulin Market Volume (K Unit) Forecast, by Application 2019 & 2032
- Table 27: Spain Subcutaneous Immunoglobulin Market Revenue (Million) Forecast, by Application 2019 & 2032
- Table 28: Spain Subcutaneous Immunoglobulin Market Volume (K Unit) Forecast, by Application 2019 & 2032
- Table 29: Rest of Europe Subcutaneous Immunoglobulin Market Revenue (Million) Forecast, by Application 2019 & 2032
- Table 30: Rest of Europe Subcutaneous Immunoglobulin Market Volume (K Unit) Forecast, by Application 2019 & 2032
- Table 31: Global Subcutaneous Immunoglobulin Market Revenue Million Forecast, by Country 2019 & 2032
- Table 32: Global Subcutaneous Immunoglobulin Market Volume K Unit Forecast, by Country 2019 & 2032
- Table 33: China Subcutaneous Immunoglobulin Market Revenue (Million) Forecast, by Application 2019 & 2032
- Table 34: China Subcutaneous Immunoglobulin Market Volume (K Unit) Forecast, by Application 2019 & 2032
- Table 35: Japan Subcutaneous Immunoglobulin Market Revenue (Million) Forecast, by Application 2019 & 2032
- Table 36: Japan Subcutaneous Immunoglobulin Market Volume (K Unit) Forecast, by Application 2019 & 2032
- Table 37: India Subcutaneous Immunoglobulin Market Revenue (Million) Forecast, by Application 2019 & 2032
- Table 38: India Subcutaneous Immunoglobulin Market Volume (K Unit) Forecast, by Application 2019 & 2032
- Table 39: Australia Subcutaneous Immunoglobulin Market Revenue (Million) Forecast, by Application 2019 & 2032
- Table 40: Australia Subcutaneous Immunoglobulin Market Volume (K Unit) Forecast, by Application 2019 & 2032
- Table 41: South Korea Subcutaneous Immunoglobulin Market Revenue (Million) Forecast, by Application 2019 & 2032
- Table 42: South Korea Subcutaneous Immunoglobulin Market Volume (K Unit) Forecast, by Application 2019 & 2032
- Table 43: Rest of Asia Pacific Subcutaneous Immunoglobulin Market Revenue (Million) Forecast, by Application 2019 & 2032
- Table 44: Rest of Asia Pacific Subcutaneous Immunoglobulin Market Volume (K Unit) Forecast, by Application 2019 & 2032
- Table 45: Global Subcutaneous Immunoglobulin Market Revenue Million Forecast, by Country 2019 & 2032
- Table 46: Global Subcutaneous Immunoglobulin Market Volume K Unit Forecast, by Country 2019 & 2032
- Table 47: GCC Subcutaneous Immunoglobulin Market Revenue (Million) Forecast, by Application 2019 & 2032
- Table 48: GCC Subcutaneous Immunoglobulin Market Volume (K Unit) Forecast, by Application 2019 & 2032
- Table 49: South Africa Subcutaneous Immunoglobulin Market Revenue (Million) Forecast, by Application 2019 & 2032
- Table 50: South Africa Subcutaneous Immunoglobulin Market Volume (K Unit) Forecast, by Application 2019 & 2032
- Table 51: Rest of Middle East and Africa Subcutaneous Immunoglobulin Market Revenue (Million) Forecast, by Application 2019 & 2032
- Table 52: Rest of Middle East and Africa Subcutaneous Immunoglobulin Market Volume (K Unit) Forecast, by Application 2019 & 2032
- Table 53: Global Subcutaneous Immunoglobulin Market Revenue Million Forecast, by Country 2019 & 2032
- Table 54: Global Subcutaneous Immunoglobulin Market Volume K Unit Forecast, by Country 2019 & 2032
- Table 55: Brazil Subcutaneous Immunoglobulin Market Revenue (Million) Forecast, by Application 2019 & 2032
- Table 56: Brazil Subcutaneous Immunoglobulin Market Volume (K Unit) Forecast, by Application 2019 & 2032
- Table 57: Argentina Subcutaneous Immunoglobulin Market Revenue (Million) Forecast, by Application 2019 & 2032
- Table 58: Argentina Subcutaneous Immunoglobulin Market Volume (K Unit) Forecast, by Application 2019 & 2032
- Table 59: Rest of South America Subcutaneous Immunoglobulin Market Revenue (Million) Forecast, by Application 2019 & 2032
- Table 60: Rest of South America Subcutaneous Immunoglobulin Market Volume (K Unit) Forecast, by Application 2019 & 2032
- Table 61: Global Subcutaneous Immunoglobulin Market Revenue Million Forecast, by Application 2019 & 2032
- Table 62: Global Subcutaneous Immunoglobulin Market Volume K Unit Forecast, by Application 2019 & 2032
- Table 63: Global Subcutaneous Immunoglobulin Market Revenue Million Forecast, by End User 2019 & 2032
- Table 64: Global Subcutaneous Immunoglobulin Market Volume K Unit Forecast, by End User 2019 & 2032
- Table 65: Global Subcutaneous Immunoglobulin Market Revenue Million Forecast, by Country 2019 & 2032
- Table 66: Global Subcutaneous Immunoglobulin Market Volume K Unit Forecast, by Country 2019 & 2032
- Table 67: United States Subcutaneous Immunoglobulin Market Revenue (Million) Forecast, by Application 2019 & 2032
- Table 68: United States Subcutaneous Immunoglobulin Market Volume (K Unit) Forecast, by Application 2019 & 2032
- Table 69: Canada Subcutaneous Immunoglobulin Market Revenue (Million) Forecast, by Application 2019 & 2032
- Table 70: Canada Subcutaneous Immunoglobulin Market Volume (K Unit) Forecast, by Application 2019 & 2032
- Table 71: Mexico Subcutaneous Immunoglobulin Market Revenue (Million) Forecast, by Application 2019 & 2032
- Table 72: Mexico Subcutaneous Immunoglobulin Market Volume (K Unit) Forecast, by Application 2019 & 2032
- Table 73: Global Subcutaneous Immunoglobulin Market Revenue Million Forecast, by Application 2019 & 2032
- Table 74: Global Subcutaneous Immunoglobulin Market Volume K Unit Forecast, by Application 2019 & 2032
- Table 75: Global Subcutaneous Immunoglobulin Market Revenue Million Forecast, by End User 2019 & 2032
- Table 76: Global Subcutaneous Immunoglobulin Market Volume K Unit Forecast, by End User 2019 & 2032
- Table 77: Global Subcutaneous Immunoglobulin Market Revenue Million Forecast, by Country 2019 & 2032
- Table 78: Global Subcutaneous Immunoglobulin Market Volume K Unit Forecast, by Country 2019 & 2032
- Table 79: Germany Subcutaneous Immunoglobulin Market Revenue (Million) Forecast, by Application 2019 & 2032
- Table 80: Germany Subcutaneous Immunoglobulin Market Volume (K Unit) Forecast, by Application 2019 & 2032
- Table 81: United Kingdom Subcutaneous Immunoglobulin Market Revenue (Million) Forecast, by Application 2019 & 2032
- Table 82: United Kingdom Subcutaneous Immunoglobulin Market Volume (K Unit) Forecast, by Application 2019 & 2032
- Table 83: France Subcutaneous Immunoglobulin Market Revenue (Million) Forecast, by Application 2019 & 2032
- Table 84: France Subcutaneous Immunoglobulin Market Volume (K Unit) Forecast, by Application 2019 & 2032
- Table 85: Italy Subcutaneous Immunoglobulin Market Revenue (Million) Forecast, by Application 2019 & 2032
- Table 86: Italy Subcutaneous Immunoglobulin Market Volume (K Unit) Forecast, by Application 2019 & 2032
- Table 87: Spain Subcutaneous Immunoglobulin Market Revenue (Million) Forecast, by Application 2019 & 2032
- Table 88: Spain Subcutaneous Immunoglobulin Market Volume (K Unit) Forecast, by Application 2019 & 2032
- Table 89: Rest of Europe Subcutaneous Immunoglobulin Market Revenue (Million) Forecast, by Application 2019 & 2032
- Table 90: Rest of Europe Subcutaneous Immunoglobulin Market Volume (K Unit) Forecast, by Application 2019 & 2032
- Table 91: Global Subcutaneous Immunoglobulin Market Revenue Million Forecast, by Application 2019 & 2032
- Table 92: Global Subcutaneous Immunoglobulin Market Volume K Unit Forecast, by Application 2019 & 2032
- Table 93: Global Subcutaneous Immunoglobulin Market Revenue Million Forecast, by End User 2019 & 2032
- Table 94: Global Subcutaneous Immunoglobulin Market Volume K Unit Forecast, by End User 2019 & 2032
- Table 95: Global Subcutaneous Immunoglobulin Market Revenue Million Forecast, by Country 2019 & 2032
- Table 96: Global Subcutaneous Immunoglobulin Market Volume K Unit Forecast, by Country 2019 & 2032
- Table 97: China Subcutaneous Immunoglobulin Market Revenue (Million) Forecast, by Application 2019 & 2032
- Table 98: China Subcutaneous Immunoglobulin Market Volume (K Unit) Forecast, by Application 2019 & 2032
- Table 99: Japan Subcutaneous Immunoglobulin Market Revenue (Million) Forecast, by Application 2019 & 2032
- Table 100: Japan Subcutaneous Immunoglobulin Market Volume (K Unit) Forecast, by Application 2019 & 2032
- Table 101: India Subcutaneous Immunoglobulin Market Revenue (Million) Forecast, by Application 2019 & 2032
- Table 102: India Subcutaneous Immunoglobulin Market Volume (K Unit) Forecast, by Application 2019 & 2032
- Table 103: Australia Subcutaneous Immunoglobulin Market Revenue (Million) Forecast, by Application 2019 & 2032
- Table 104: Australia Subcutaneous Immunoglobulin Market Volume (K Unit) Forecast, by Application 2019 & 2032
- Table 105: South Korea Subcutaneous Immunoglobulin Market Revenue (Million) Forecast, by Application 2019 & 2032
- Table 106: South Korea Subcutaneous Immunoglobulin Market Volume (K Unit) Forecast, by Application 2019 & 2032
- Table 107: Rest of Asia Pacific Subcutaneous Immunoglobulin Market Revenue (Million) Forecast, by Application 2019 & 2032
- Table 108: Rest of Asia Pacific Subcutaneous Immunoglobulin Market Volume (K Unit) Forecast, by Application 2019 & 2032
- Table 109: Global Subcutaneous Immunoglobulin Market Revenue Million Forecast, by Application 2019 & 2032
- Table 110: Global Subcutaneous Immunoglobulin Market Volume K Unit Forecast, by Application 2019 & 2032
- Table 111: Global Subcutaneous Immunoglobulin Market Revenue Million Forecast, by End User 2019 & 2032
- Table 112: Global Subcutaneous Immunoglobulin Market Volume K Unit Forecast, by End User 2019 & 2032
- Table 113: Global Subcutaneous Immunoglobulin Market Revenue Million Forecast, by Country 2019 & 2032
- Table 114: Global Subcutaneous Immunoglobulin Market Volume K Unit Forecast, by Country 2019 & 2032
- Table 115: GCC Subcutaneous Immunoglobulin Market Revenue (Million) Forecast, by Application 2019 & 2032
- Table 116: GCC Subcutaneous Immunoglobulin Market Volume (K Unit) Forecast, by Application 2019 & 2032
- Table 117: South Africa Subcutaneous Immunoglobulin Market Revenue (Million) Forecast, by Application 2019 & 2032
- Table 118: South Africa Subcutaneous Immunoglobulin Market Volume (K Unit) Forecast, by Application 2019 & 2032
- Table 119: Rest of Middle East and Africa Subcutaneous Immunoglobulin Market Revenue (Million) Forecast, by Application 2019 & 2032
- Table 120: Rest of Middle East and Africa Subcutaneous Immunoglobulin Market Volume (K Unit) Forecast, by Application 2019 & 2032
- Table 121: Global Subcutaneous Immunoglobulin Market Revenue Million Forecast, by Application 2019 & 2032
- Table 122: Global Subcutaneous Immunoglobulin Market Volume K Unit Forecast, by Application 2019 & 2032
- Table 123: Global Subcutaneous Immunoglobulin Market Revenue Million Forecast, by End User 2019 & 2032
- Table 124: Global Subcutaneous Immunoglobulin Market Volume K Unit Forecast, by End User 2019 & 2032
- Table 125: Global Subcutaneous Immunoglobulin Market Revenue Million Forecast, by Country 2019 & 2032
- Table 126: Global Subcutaneous Immunoglobulin Market Volume K Unit Forecast, by Country 2019 & 2032
- Table 127: Brazil Subcutaneous Immunoglobulin Market Revenue (Million) Forecast, by Application 2019 & 2032
- Table 128: Brazil Subcutaneous Immunoglobulin Market Volume (K Unit) Forecast, by Application 2019 & 2032
- Table 129: Argentina Subcutaneous Immunoglobulin Market Revenue (Million) Forecast, by Application 2019 & 2032
- Table 130: Argentina Subcutaneous Immunoglobulin Market Volume (K Unit) Forecast, by Application 2019 & 2032
- Table 131: Rest of South America Subcutaneous Immunoglobulin Market Revenue (Million) Forecast, by Application 2019 & 2032
- Table 132: Rest of South America Subcutaneous Immunoglobulin Market Volume (K Unit) Forecast, by Application 2019 & 2032
Frequently Asked Questions
1. What is the projected Compound Annual Growth Rate (CAGR) of the Subcutaneous Immunoglobulin Market?
The projected CAGR is approximately 13.30%.
2. Which companies are prominent players in the Subcutaneous Immunoglobulin Market?
Key companies in the market include Bio Products laboratory, Biotest AG, Octapharma AG, Takeda Pharmaceutical Company Limited, Grifols S A, CSL Behring, Kedrion S p A.
3. What are the main segments of the Subcutaneous Immunoglobulin Market?
The market segments include Application, End User.
4. Can you provide details about the market size?
The market size is estimated to be USD XX Million as of 2022.
5. What are some drivers contributing to market growth?
Increasing Use of Subcutaneous Immunoglobulin For Primary Immunodeficiency Disorders; Increasing Geriatric Population and Patient Pool; Rise in Government Funding.
6. What are the notable trends driving market growth?
Secondary Immunodeficiency Diseases are Expected to Witness a Strong Growth Over the Forecast Period.
7. Are there any restraints impacting market growth?
Stringent Government Regulations; High Risk of Side Effects.
8. Can you provide examples of recent developments in the market?
In August 2022, Genentech, a member of the Roche Group announced that the Phase III IMscin001 study evaluating a subcutaneous formulation of Tecentriq (atezolizumab) met its co-primary endpoints.
9. What pricing options are available for accessing the report?
Pricing options include single-user, multi-user, and enterprise licenses priced at USD 4750, USD 5250, and USD 8750 respectively.
10. Is the market size provided in terms of value or volume?
The market size is provided in terms of value, measured in Million and volume, measured in K Unit.
11. Are there any specific market keywords associated with the report?
Yes, the market keyword associated with the report is "Subcutaneous Immunoglobulin Market," which aids in identifying and referencing the specific market segment covered.
12. How do I determine which pricing option suits my needs best?
The pricing options vary based on user requirements and access needs. Individual users may opt for single-user licenses, while businesses requiring broader access may choose multi-user or enterprise licenses for cost-effective access to the report.
13. Are there any additional resources or data provided in the Subcutaneous Immunoglobulin Market report?
While the report offers comprehensive insights, it's advisable to review the specific contents or supplementary materials provided to ascertain if additional resources or data are available.
14. How can I stay updated on further developments or reports in the Subcutaneous Immunoglobulin Market?
To stay informed about further developments, trends, and reports in the Subcutaneous Immunoglobulin Market, consider subscribing to industry newsletters, following relevant companies and organizations, or regularly checking reputable industry news sources and publications.
Methodology
Step 1 - Identification of Relevant Samples Size from Population Database


Step 2 - Approaches for Defining Global Market Size (Value, Volume* & Price*)

Note*: In applicable scenarios
Step 3 - Data Sources
Primary Research
- Web Analytics
- Survey Reports
- Research Institute
- Latest Research Reports
- Opinion Leaders
Secondary Research
- Annual Reports
- White Paper
- Latest Press Release
- Industry Association
- Paid Database
- Investor Presentations

Step 4 - Data Triangulation
Involves using different sources of information in order to increase the validity of a study
These sources are likely to be stakeholders in a program - participants, other researchers, program staff, other community members, and so on.
Then we put all data in single framework & apply various statistical tools to find out the dynamic on the market.
During the analysis stage, feedback from the stakeholder groups would be compared to determine areas of agreement as well as areas of divergence


