

Key Insights
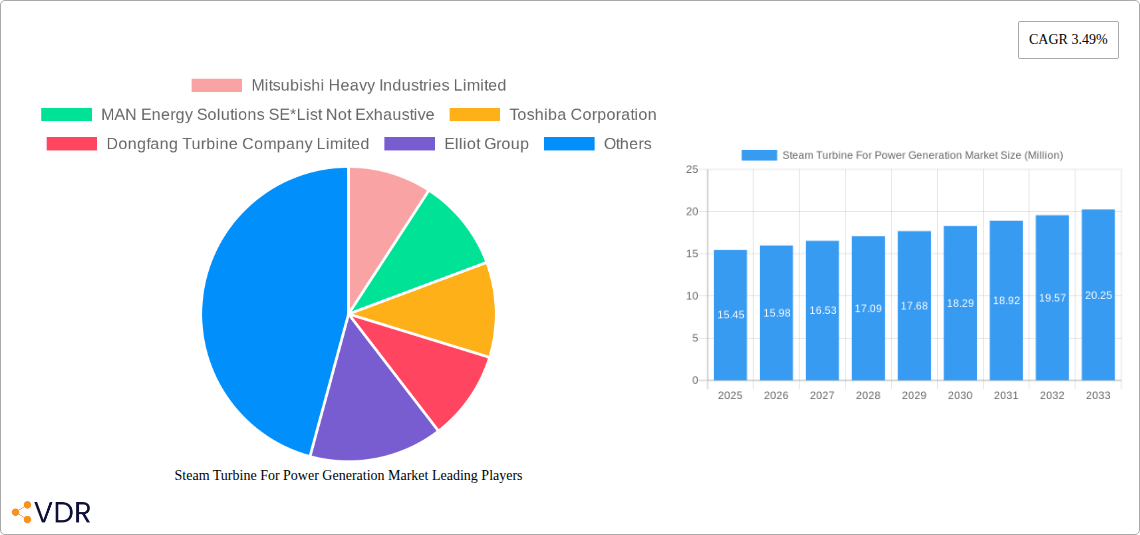
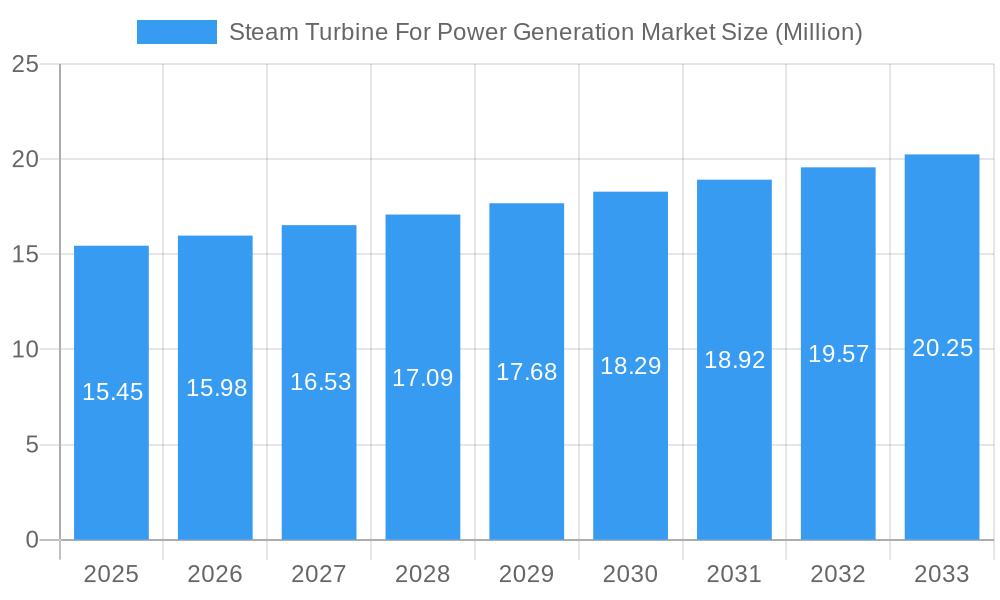
The global Steam Turbine for Power Generation Market is poised for steady expansion, projected to reach a valuation of $15.45 billion by 2025, with an estimated Compound Annual Growth Rate (CAGR) of 3.49% during the forecast period of 2025-2033. This growth is underpinned by the escalating global demand for electricity, driven by industrialization, urbanization, and the increasing adoption of energy-intensive technologies. Steam turbines remain a cornerstone of power generation due to their reliability, efficiency, and versatility in utilizing a wide range of fuel sources, including coal, natural gas, and nuclear energy. The market's trajectory will be significantly influenced by investments in new power plant construction and upgrades to existing facilities, particularly in emerging economies seeking to bolster their energy infrastructure.
Steam Turbine For Power Generation Market Market Size (In Million)
Key market drivers include the ongoing transition towards cleaner energy sources, which spurs the development of advanced steam turbine technologies capable of higher efficiencies and reduced emissions. The increasing deployment of combined heat and power (CHP) systems, where steam turbines play a crucial role in maximizing energy utilization, also contributes to market growth. However, the market faces certain restraints, such as the substantial capital investment required for steam turbine installations and maintenance, alongside increasing regulatory pressures and environmental concerns associated with fossil fuel-based power generation. Nevertheless, innovations in materials science, control systems, and turbine design are expected to mitigate these challenges and sustain the market's upward trend, with significant opportunities arising from the modernization of aging power infrastructure worldwide.
Steam Turbine For Power Generation Market Company Market Share
Steam Turbine for Power Generation Market: Comprehensive Industry Report 2025-2033
This in-depth report provides a detailed analysis of the global Steam Turbine for Power Generation Market, offering critical insights into market dynamics, growth trends, competitive landscape, and future outlook. Covering the period from 2019 to 2033, with a base year of 2025, this study is essential for stakeholders seeking to understand and capitalize on opportunities in this vital sector. We explore parent and child market segments, analyze key drivers and restraints, and highlight the innovations shaping the future of power generation turbines.
Steam Turbine For Power Generation Market Market Dynamics & Structure
The Steam Turbine for Power Generation Market exhibits a moderately concentrated structure, with a few key global players dominating innovation and market share. Technological advancements in efficiency, emissions reduction, and digitalization are primary drivers, fueled by stringent environmental regulations and the growing demand for reliable baseload power. Competitive product substitutes, such as advanced gas turbines and renewable energy storage solutions, present evolving challenges. End-user demographics are shifting towards utilities and independent power producers (IPPs) seeking cost-effective and sustainable energy solutions. Mergers and acquisitions (M&A) activity remains a significant trend, as larger companies consolidate their positions and expand their technological portfolios.
- Market Concentration: Dominated by established manufacturers with significant R&D investments.
- Technological Innovation Drivers: Focus on high efficiency, low emissions (e.g., NOx), increased power output, and integration with smart grid technologies.
- Regulatory Frameworks: Stringent environmental standards (e.g., CO2 emissions caps) and energy security policies influencing turbine design and fuel choices.
- Competitive Product Substitutes: Advancements in renewable energy technologies and energy storage solutions impacting long-term baseload demand.
- End-User Demographics: Growth in IPPs, utilities with decarbonization goals, and emerging markets with increasing energy needs.
- M&A Trends: Strategic acquisitions to gain market access, acquire new technologies, or achieve economies of scale.
Steam Turbine For Power Generation Market Growth Trends & Insights
The Steam Turbine for Power Generation Market is poised for significant growth, driven by the escalating global energy demand and the continuous need for efficient and reliable power generation. Market size is projected to expand substantially, propelled by retrofitting and modernization projects of existing thermal power plants, as well as the construction of new facilities. Adoption rates are influenced by government policies promoting energy security and the transition towards cleaner energy sources. Technological disruptions are leading to the development of more efficient steam turbines, capable of higher heat rates and lower emissions. Consumer behavior, primarily driven by utilities and large industrial consumers, is increasingly focused on total cost of ownership, operational flexibility, and environmental impact. The market penetration of advanced turbine technologies is expected to rise as power producers prioritize performance and sustainability.
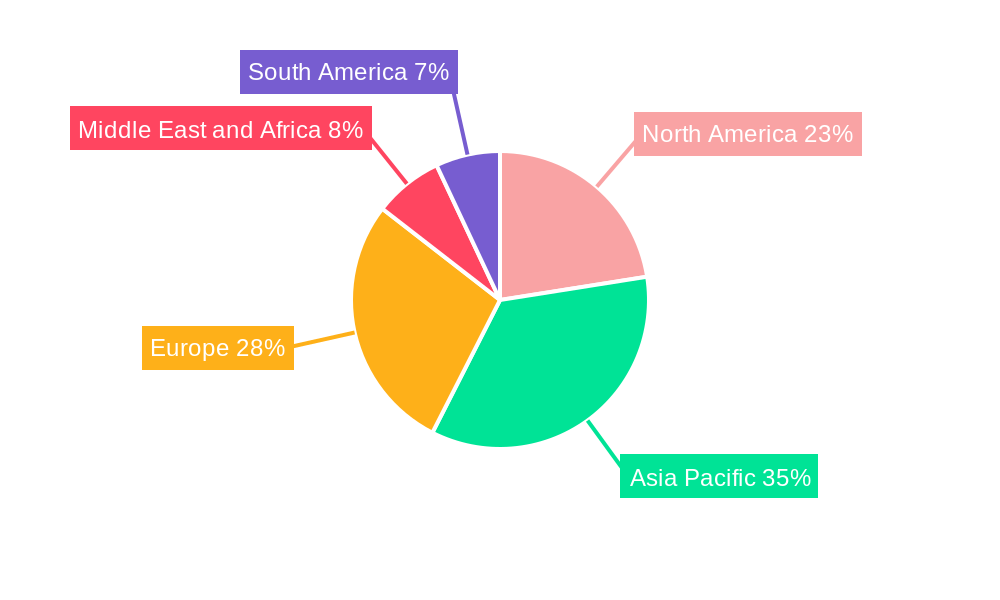
Dominant Regions, Countries, or Segments in Steam Turbine For Power Generation Market
Asia-Pacific, particularly China and India, currently dominates the Steam Turbine for Power Generation Market. This regional dominance is propelled by robust economic growth, substantial investments in power infrastructure, and a persistent reliance on coal and gas-fired power plants to meet their ever-increasing energy demands. Within plant types, Coal power generation remains a significant segment, although Gas turbines are gaining traction due to their flexibility and lower emissions. In terms of capacity, Above 40 MW turbines represent the largest market share, catering to the needs of large-scale power plants essential for grid stability.
- Dominant Region: Asia-Pacific (China, India)
- Key Drivers: Rapid industrialization, expanding populations, and the need for consistent baseload power.
- Market Share: Holds a substantial portion of global new installations and aftermarket services.
- Growth Potential: Continued investment in power generation infrastructure, despite growing renewable energy adoption.
- Dominant Plant Type: Coal
- Key Drivers: Established infrastructure, cost-effectiveness for baseload power, and a significant portion of the existing global installed base.
- Market Share: While declining in some regions, it remains a crucial segment globally.
- Growth Potential: Primarily through modernization and efficiency upgrades of existing coal-fired power stations.
- Dominant Capacity Segment: Above 40 MW
- Key Drivers: Essential for utility-scale power generation, providing economies of scale and grid stability.
- Market Share: Accounts for the majority of new steam turbine orders.
- Growth Potential: Tied to the development of new large-scale power projects and upgrades to existing ones.
Steam Turbine For Power Generation Market Product Landscape
The Steam Turbine for Power Generation Market is characterized by continuous product innovation focused on enhancing efficiency, reducing operational costs, and minimizing environmental impact. Manufacturers are introducing advanced blade designs, improved sealing technologies, and sophisticated control systems to optimize performance across various operating conditions. Applications span traditional thermal power plants (coal, gas), nuclear power generation, and emerging sectors like concentrated solar power (CSP) and waste-to-energy facilities. Key performance metrics being improved include thermal efficiency, power output per unit size, and extended operational lifespans. Unique selling propositions often revolve around tailored solutions for specific plant requirements, lower emissions, and integration with digital monitoring and predictive maintenance systems.
Key Drivers, Barriers & Challenges in Steam Turbine For Power Generation Market
Key Drivers:
- Growing Global Energy Demand: Sustained need for electricity to support economic development and population growth.
- Need for Reliable Baseload Power: Steam turbines remain critical for providing consistent and dependable power output, complementing intermittent renewable sources.
- Modernization and Retrofitting: Upgrades to existing thermal power plants to improve efficiency and meet stricter environmental regulations.
- Energy Security Concerns: Governments investing in domestic power generation capabilities to reduce reliance on imported fuels.
Barriers & Challenges:
- Transition to Renewable Energy: Increasing adoption of solar, wind, and other renewables posing competition to traditional thermal power.
- Environmental Regulations: Strict emissions standards and carbon pricing mechanisms can increase operational costs for fossil fuel-based plants.
- High Capital Investment: The upfront cost of new steam turbine installations and associated power plant infrastructure is significant.
- Supply Chain Volatility: Potential disruptions in the global supply of critical components and raw materials.
- Skilled Workforce Shortage: Demand for specialized engineers and technicians for installation, operation, and maintenance.
Emerging Opportunities in Steam Turbine For Power Generation Market
Emerging opportunities in the Steam Turbine for Power Generation Market lie in the growing adoption of Combined Heat and Power (CHP) systems, offering enhanced energy efficiency for industrial and district heating applications. The development of waste-to-energy (EfW) facilities presents a significant untapped market, utilizing municipal and industrial waste as a fuel source. Furthermore, advancements in materials science are enabling the design of turbines capable of operating at higher temperatures, leading to improved efficiency in both new builds and retrofits. The increasing focus on decarbonization also opens avenues for exploring green hydrogen as a supplementary fuel in certain gas turbine applications, which could eventually extend to hybrid steam turbine cycles.
Growth Accelerators in the Steam Turbine For Power Generation Market Industry
Growth in the Steam Turbine for Power Generation Market is being accelerated by significant technological breakthroughs, including the development of ultra-supercritical (USC) and advanced ultra-supercritical (A-USC) steam turbine technologies, which offer unprecedented levels of thermal efficiency. Strategic partnerships between turbine manufacturers and power plant developers are crucial for undertaking large-scale projects. Market expansion is also being fueled by developing economies with a substantial need for new power generation capacity. The increasing integration of digitalization, including AI-powered predictive maintenance and remote monitoring, is enhancing operational reliability and reducing downtime, making steam turbines a more attractive investment.
Key Players Shaping the Steam Turbine For Power Generation Market Market
- General Electric Company
- Siemens Energy AG
- Mitsubishi Heavy Industries Limited
- Toshiba Corporation
- Bharat Heavy Electricals Limited
- MAN Energy Solutions SE
- Doosan Enerbility Co Ltd
- WEG S A
- Elliot Group
- Dongfang Turbine Company Limited
Notable Milestones in Steam Turbine For Power Generation Market Sector
- April 2023: Doosan Koda Power awarded a contract to supply a steam turbine to the South Clyde Energy Centre, a Scottish energy-from-waste facility, expected to power 70,000 homes upon completion in 2025. This development is influenced by Scotland's ban on landfilling biodegradable municipal garbage.
- April 2023: The Thar Block-1 thermal power plant commenced commercial operation after successfully completing reliability run tests. This 1,320 MW project, supported by an integrated coal mine, features Shanghai Electric's steam turbines and associated power generation equipment.
- January 2023: Bharat Heavy Electricals Limited (BHEL) secured a contract worth USD 36.46 Million for the rehabilitation and modernization of steam turbines at Gujarat's Ukai Thermal Power Station (TPS). This deal specifically targets Unit-3 (200 MW) and Unit-5 (210 MW) of the station, ordered by Gujarat State Electricity Corporation Limited.
In-Depth Steam Turbine For Power Generation Market Market Outlook
The future outlook for the Steam Turbine for Power Generation Market is characterized by sustained demand for reliable and efficient power solutions. Growth accelerators include the ongoing global push for energy security, necessitating robust baseload power generation capabilities. Technological advancements in efficiency, emissions reduction, and smart grid integration will continue to drive innovation and adoption of advanced power generation turbines. Strategic partnerships, particularly in emerging markets, and the increasing application of digital technologies for enhanced operational performance will further bolster market expansion. Opportunities in sectors like waste-to-energy and the potential for hybrid systems incorporating new fuel sources present promising avenues for long-term growth and market resilience.
Steam Turbine For Power Generation Market Segmentation
-
1. Plant Type
- 1.1. Gas
- 1.2. Coal
- 1.3. Other Plant Types (Nuclear, CHP, etc.)
-
2. Capacity
- 2.1. Below 40 MW
- 2.2. Above 40 MW
Steam Turbine For Power Generation Market Segmentation By Geography
-
1. North America
- 1.1. United States
- 1.2. Canada
- 1.3. Rest of North America
-
2. Asia Pacific
- 2.1. China
- 2.2. India
- 2.3. Japan
- 2.4. South Korea
- 2.5. Malaysia
- 2.6. Thailand
- 2.7. Indonesia
- 2.8. Vietnam
- 2.9. Rest of Asia Pacific
-
3. Europe
- 3.1. Germany
- 3.2. France
- 3.3. United Kingdom
- 3.4. Italy
- 3.5. Spain
- 3.6. NORDIC
- 3.7. Turkey
- 3.8. Russia
- 3.9. Rest of Europe
-
4. Middle East and Africa
- 4.1. Saudi Arabia
- 4.2. United Arab Emirates
- 4.3. South Africa
- 4.4. Qatar
- 4.5. Nigeria
- 4.6. Oman
- 4.7. Egypt
- 4.8. Algeria
- 4.9. Rest of Middle East and Africa
-
5. South America
- 5.1. Brazil
- 5.2. Argentina
- 5.3. Colombia
- 5.4. Rest of South America
Steam Turbine For Power Generation Market Regional Market Share
Geographic Coverage of Steam Turbine For Power Generation Market
Steam Turbine For Power Generation Market REPORT HIGHLIGHTS
| Aspects | Details |
|---|---|
| Study Period | 2020-2034 |
| Base Year | 2025 |
| Estimated Year | 2026 |
| Forecast Period | 2026-2034 |
| Historical Period | 2020-2025 |
| Growth Rate | CAGR of 3.49% from 2020-2034 |
| Segmentation |
|
Table of Contents
- 1. Introduction
- 1.1. Research Scope
- 1.2. Market Segmentation
- 1.3. Research Objective
- 1.4. Definitions and Assumptions
- 2. Executive Summary
- 2.1. Market Snapshot
- 3. Market Dynamics
- 3.1. Market Drivers
- 3.2. Market Restrains
- 3.3. Market Trends
- 3.4. Market Opportunities
- 4. Market Factor Analysis
- 4.1. Porters Five Forces
- 4.1.1. Bargaining Power of Suppliers
- 4.1.2. Bargaining Power of Buyers
- 4.1.3. Threat of New Entrants
- 4.1.4. Threat of Substitutes
- 4.1.5. Competitive Rivalry
- 4.2. PESTEL analysis
- 4.3. BCG Analysis
- 4.3.1. Stars (High Growth, High Market Share)
- 4.3.2. Cash Cows (Low Growth, High Market Share)
- 4.3.3. Question Mark (High Growth, Low Market Share)
- 4.3.4. Dogs (Low Growth, Low Market Share)
- 4.4. Ansoff Matrix Analysis
- 4.5. Supply Chain Analysis
- 4.6. Regulatory Landscape
- 4.7. Current Market Potential and Opportunity Assessment (TAM–SAM–SOM Framework)
- 4.8. VDR Analyst Note
- 4.1. Porters Five Forces
- 5. Market Analysis, Insights and Forecast 2021-2033
- 5.1. Market Analysis, Insights and Forecast - by Plant Type
- 5.1.1. Gas
- 5.1.2. Coal
- 5.1.3. Other Plant Types (Nuclear, CHP, etc.)
- 5.2. Market Analysis, Insights and Forecast - by Capacity
- 5.2.1. Below 40 MW
- 5.2.2. Above 40 MW
- 5.3. Market Analysis, Insights and Forecast - by Region
- 5.3.1. North America
- 5.3.2. Asia Pacific
- 5.3.3. Europe
- 5.3.4. Middle East and Africa
- 5.3.5. South America
- 5.1. Market Analysis, Insights and Forecast - by Plant Type
- 6. Global Steam Turbine For Power Generation Market Analysis, Insights and Forecast, 2021-2033
- 6.1. Market Analysis, Insights and Forecast - by Plant Type
- 6.1.1. Gas
- 6.1.2. Coal
- 6.1.3. Other Plant Types (Nuclear, CHP, etc.)
- 6.2. Market Analysis, Insights and Forecast - by Capacity
- 6.2.1. Below 40 MW
- 6.2.2. Above 40 MW
- 6.1. Market Analysis, Insights and Forecast - by Plant Type
- 7. North America Steam Turbine For Power Generation Market Analysis, Insights and Forecast, 2021-2033
- 7.1. Market Analysis, Insights and Forecast - by Plant Type
- 7.1.1. Gas
- 7.1.2. Coal
- 7.1.3. Other Plant Types (Nuclear, CHP, etc.)
- 7.2. Market Analysis, Insights and Forecast - by Capacity
- 7.2.1. Below 40 MW
- 7.2.2. Above 40 MW
- 7.1. Market Analysis, Insights and Forecast - by Plant Type
- 8. Asia Pacific Steam Turbine For Power Generation Market Analysis, Insights and Forecast, 2021-2033
- 8.1. Market Analysis, Insights and Forecast - by Plant Type
- 8.1.1. Gas
- 8.1.2. Coal
- 8.1.3. Other Plant Types (Nuclear, CHP, etc.)
- 8.2. Market Analysis, Insights and Forecast - by Capacity
- 8.2.1. Below 40 MW
- 8.2.2. Above 40 MW
- 8.1. Market Analysis, Insights and Forecast - by Plant Type
- 9. Europe Steam Turbine For Power Generation Market Analysis, Insights and Forecast, 2021-2033
- 9.1. Market Analysis, Insights and Forecast - by Plant Type
- 9.1.1. Gas
- 9.1.2. Coal
- 9.1.3. Other Plant Types (Nuclear, CHP, etc.)
- 9.2. Market Analysis, Insights and Forecast - by Capacity
- 9.2.1. Below 40 MW
- 9.2.2. Above 40 MW
- 9.1. Market Analysis, Insights and Forecast - by Plant Type
- 10. Middle East and Africa Steam Turbine For Power Generation Market Analysis, Insights and Forecast, 2021-2033
- 10.1. Market Analysis, Insights and Forecast - by Plant Type
- 10.1.1. Gas
- 10.1.2. Coal
- 10.1.3. Other Plant Types (Nuclear, CHP, etc.)
- 10.2. Market Analysis, Insights and Forecast - by Capacity
- 10.2.1. Below 40 MW
- 10.2.2. Above 40 MW
- 10.1. Market Analysis, Insights and Forecast - by Plant Type
- 11. South America Steam Turbine For Power Generation Market Analysis, Insights and Forecast, 2021-2033
- 11.1. Market Analysis, Insights and Forecast - by Plant Type
- 11.1.1. Gas
- 11.1.2. Coal
- 11.1.3. Other Plant Types (Nuclear, CHP, etc.)
- 11.2. Market Analysis, Insights and Forecast - by Capacity
- 11.2.1. Below 40 MW
- 11.2.2. Above 40 MW
- 11.1. Market Analysis, Insights and Forecast - by Plant Type
- 12. Competitive Analysis
- 12.1. Company Profiles
- 12.1.1 Mitsubishi Heavy Industries Limited
- 12.1.1.1. Company Overview
- 12.1.1.2. Products
- 12.1.1.3. Company Financials
- 12.1.1.4. SWOT Analysis
- 12.1.2 MAN Energy Solutions SE*List Not Exhaustive
- 12.1.2.1. Company Overview
- 12.1.2.2. Products
- 12.1.2.3. Company Financials
- 12.1.2.4. SWOT Analysis
- 12.1.3 Toshiba Corporation
- 12.1.3.1. Company Overview
- 12.1.3.2. Products
- 12.1.3.3. Company Financials
- 12.1.3.4. SWOT Analysis
- 12.1.4 Dongfang Turbine Company Limited
- 12.1.4.1. Company Overview
- 12.1.4.2. Products
- 12.1.4.3. Company Financials
- 12.1.4.4. SWOT Analysis
- 12.1.5 Elliot Group
- 12.1.5.1. Company Overview
- 12.1.5.2. Products
- 12.1.5.3. Company Financials
- 12.1.5.4. SWOT Analysis
- 12.1.6 Bharat Heavy Electricals Limited
- 12.1.6.1. Company Overview
- 12.1.6.2. Products
- 12.1.6.3. Company Financials
- 12.1.6.4. SWOT Analysis
- 12.1.7 WEG S A
- 12.1.7.1. Company Overview
- 12.1.7.2. Products
- 12.1.7.3. Company Financials
- 12.1.7.4. SWOT Analysis
- 12.1.8 Doosan Enerbility Co Ltd
- 12.1.8.1. Company Overview
- 12.1.8.2. Products
- 12.1.8.3. Company Financials
- 12.1.8.4. SWOT Analysis
- 12.1.9 Siemens Energy AG
- 12.1.9.1. Company Overview
- 12.1.9.2. Products
- 12.1.9.3. Company Financials
- 12.1.9.4. SWOT Analysis
- 12.1.10 General Electric Company
- 12.1.10.1. Company Overview
- 12.1.10.2. Products
- 12.1.10.3. Company Financials
- 12.1.10.4. SWOT Analysis
- 12.1.1 Mitsubishi Heavy Industries Limited
- 12.2. Market Entropy
- 12.2.1 Company's Key Areas Served
- 12.2.2 Recent Developments
- 12.3. Company Market Share Analysis 2025
- 12.3.1 Top 5 Companies Market Share Analysis
- 12.3.2 Top 3 Companies Market Share Analysis
- 12.4. List of Potential Customers
- 13. Research Methodology
List of Figures
- Figure 1: Global Steam Turbine For Power Generation Market Revenue Breakdown (Million, %) by Region 2025 & 2033
- Figure 2: North America Steam Turbine For Power Generation Market Revenue (Million), by Plant Type 2025 & 2033
- Figure 3: North America Steam Turbine For Power Generation Market Revenue Share (%), by Plant Type 2025 & 2033
- Figure 4: North America Steam Turbine For Power Generation Market Revenue (Million), by Capacity 2025 & 2033
- Figure 5: North America Steam Turbine For Power Generation Market Revenue Share (%), by Capacity 2025 & 2033
- Figure 6: North America Steam Turbine For Power Generation Market Revenue (Million), by Country 2025 & 2033
- Figure 7: North America Steam Turbine For Power Generation Market Revenue Share (%), by Country 2025 & 2033
- Figure 8: Asia Pacific Steam Turbine For Power Generation Market Revenue (Million), by Plant Type 2025 & 2033
- Figure 9: Asia Pacific Steam Turbine For Power Generation Market Revenue Share (%), by Plant Type 2025 & 2033
- Figure 10: Asia Pacific Steam Turbine For Power Generation Market Revenue (Million), by Capacity 2025 & 2033
- Figure 11: Asia Pacific Steam Turbine For Power Generation Market Revenue Share (%), by Capacity 2025 & 2033
- Figure 12: Asia Pacific Steam Turbine For Power Generation Market Revenue (Million), by Country 2025 & 2033
- Figure 13: Asia Pacific Steam Turbine For Power Generation Market Revenue Share (%), by Country 2025 & 2033
- Figure 14: Europe Steam Turbine For Power Generation Market Revenue (Million), by Plant Type 2025 & 2033
- Figure 15: Europe Steam Turbine For Power Generation Market Revenue Share (%), by Plant Type 2025 & 2033
- Figure 16: Europe Steam Turbine For Power Generation Market Revenue (Million), by Capacity 2025 & 2033
- Figure 17: Europe Steam Turbine For Power Generation Market Revenue Share (%), by Capacity 2025 & 2033
- Figure 18: Europe Steam Turbine For Power Generation Market Revenue (Million), by Country 2025 & 2033
- Figure 19: Europe Steam Turbine For Power Generation Market Revenue Share (%), by Country 2025 & 2033
- Figure 20: Middle East and Africa Steam Turbine For Power Generation Market Revenue (Million), by Plant Type 2025 & 2033
- Figure 21: Middle East and Africa Steam Turbine For Power Generation Market Revenue Share (%), by Plant Type 2025 & 2033
- Figure 22: Middle East and Africa Steam Turbine For Power Generation Market Revenue (Million), by Capacity 2025 & 2033
- Figure 23: Middle East and Africa Steam Turbine For Power Generation Market Revenue Share (%), by Capacity 2025 & 2033
- Figure 24: Middle East and Africa Steam Turbine For Power Generation Market Revenue (Million), by Country 2025 & 2033
- Figure 25: Middle East and Africa Steam Turbine For Power Generation Market Revenue Share (%), by Country 2025 & 2033
- Figure 26: South America Steam Turbine For Power Generation Market Revenue (Million), by Plant Type 2025 & 2033
- Figure 27: South America Steam Turbine For Power Generation Market Revenue Share (%), by Plant Type 2025 & 2033
- Figure 28: South America Steam Turbine For Power Generation Market Revenue (Million), by Capacity 2025 & 2033
- Figure 29: South America Steam Turbine For Power Generation Market Revenue Share (%), by Capacity 2025 & 2033
- Figure 30: South America Steam Turbine For Power Generation Market Revenue (Million), by Country 2025 & 2033
- Figure 31: South America Steam Turbine For Power Generation Market Revenue Share (%), by Country 2025 & 2033
List of Tables
- Table 1: Global Steam Turbine For Power Generation Market Revenue Million Forecast, by Plant Type 2020 & 2033
- Table 2: Global Steam Turbine For Power Generation Market Revenue Million Forecast, by Capacity 2020 & 2033
- Table 3: Global Steam Turbine For Power Generation Market Revenue Million Forecast, by Region 2020 & 2033
- Table 4: Global Steam Turbine For Power Generation Market Revenue Million Forecast, by Plant Type 2020 & 2033
- Table 5: Global Steam Turbine For Power Generation Market Revenue Million Forecast, by Capacity 2020 & 2033
- Table 6: Global Steam Turbine For Power Generation Market Revenue Million Forecast, by Country 2020 & 2033
- Table 7: United States Steam Turbine For Power Generation Market Revenue (Million) Forecast, by Application 2020 & 2033
- Table 8: Canada Steam Turbine For Power Generation Market Revenue (Million) Forecast, by Application 2020 & 2033
- Table 9: Rest of North America Steam Turbine For Power Generation Market Revenue (Million) Forecast, by Application 2020 & 2033
- Table 10: Global Steam Turbine For Power Generation Market Revenue Million Forecast, by Plant Type 2020 & 2033
- Table 11: Global Steam Turbine For Power Generation Market Revenue Million Forecast, by Capacity 2020 & 2033
- Table 12: Global Steam Turbine For Power Generation Market Revenue Million Forecast, by Country 2020 & 2033
- Table 13: China Steam Turbine For Power Generation Market Revenue (Million) Forecast, by Application 2020 & 2033
- Table 14: India Steam Turbine For Power Generation Market Revenue (Million) Forecast, by Application 2020 & 2033
- Table 15: Japan Steam Turbine For Power Generation Market Revenue (Million) Forecast, by Application 2020 & 2033
- Table 16: South Korea Steam Turbine For Power Generation Market Revenue (Million) Forecast, by Application 2020 & 2033
- Table 17: Malaysia Steam Turbine For Power Generation Market Revenue (Million) Forecast, by Application 2020 & 2033
- Table 18: Thailand Steam Turbine For Power Generation Market Revenue (Million) Forecast, by Application 2020 & 2033
- Table 19: Indonesia Steam Turbine For Power Generation Market Revenue (Million) Forecast, by Application 2020 & 2033
- Table 20: Vietnam Steam Turbine For Power Generation Market Revenue (Million) Forecast, by Application 2020 & 2033
- Table 21: Rest of Asia Pacific Steam Turbine For Power Generation Market Revenue (Million) Forecast, by Application 2020 & 2033
- Table 22: Global Steam Turbine For Power Generation Market Revenue Million Forecast, by Plant Type 2020 & 2033
- Table 23: Global Steam Turbine For Power Generation Market Revenue Million Forecast, by Capacity 2020 & 2033
- Table 24: Global Steam Turbine For Power Generation Market Revenue Million Forecast, by Country 2020 & 2033
- Table 25: Germany Steam Turbine For Power Generation Market Revenue (Million) Forecast, by Application 2020 & 2033
- Table 26: France Steam Turbine For Power Generation Market Revenue (Million) Forecast, by Application 2020 & 2033
- Table 27: United Kingdom Steam Turbine For Power Generation Market Revenue (Million) Forecast, by Application 2020 & 2033
- Table 28: Italy Steam Turbine For Power Generation Market Revenue (Million) Forecast, by Application 2020 & 2033
- Table 29: Spain Steam Turbine For Power Generation Market Revenue (Million) Forecast, by Application 2020 & 2033
- Table 30: NORDIC Steam Turbine For Power Generation Market Revenue (Million) Forecast, by Application 2020 & 2033
- Table 31: Turkey Steam Turbine For Power Generation Market Revenue (Million) Forecast, by Application 2020 & 2033
- Table 32: Russia Steam Turbine For Power Generation Market Revenue (Million) Forecast, by Application 2020 & 2033
- Table 33: Rest of Europe Steam Turbine For Power Generation Market Revenue (Million) Forecast, by Application 2020 & 2033
- Table 34: Global Steam Turbine For Power Generation Market Revenue Million Forecast, by Plant Type 2020 & 2033
- Table 35: Global Steam Turbine For Power Generation Market Revenue Million Forecast, by Capacity 2020 & 2033
- Table 36: Global Steam Turbine For Power Generation Market Revenue Million Forecast, by Country 2020 & 2033
- Table 37: Saudi Arabia Steam Turbine For Power Generation Market Revenue (Million) Forecast, by Application 2020 & 2033
- Table 38: United Arab Emirates Steam Turbine For Power Generation Market Revenue (Million) Forecast, by Application 2020 & 2033
- Table 39: South Africa Steam Turbine For Power Generation Market Revenue (Million) Forecast, by Application 2020 & 2033
- Table 40: Qatar Steam Turbine For Power Generation Market Revenue (Million) Forecast, by Application 2020 & 2033
- Table 41: Nigeria Steam Turbine For Power Generation Market Revenue (Million) Forecast, by Application 2020 & 2033
- Table 42: Oman Steam Turbine For Power Generation Market Revenue (Million) Forecast, by Application 2020 & 2033
- Table 43: Egypt Steam Turbine For Power Generation Market Revenue (Million) Forecast, by Application 2020 & 2033
- Table 44: Algeria Steam Turbine For Power Generation Market Revenue (Million) Forecast, by Application 2020 & 2033
- Table 45: Rest of Middle East and Africa Steam Turbine For Power Generation Market Revenue (Million) Forecast, by Application 2020 & 2033
- Table 46: Global Steam Turbine For Power Generation Market Revenue Million Forecast, by Plant Type 2020 & 2033
- Table 47: Global Steam Turbine For Power Generation Market Revenue Million Forecast, by Capacity 2020 & 2033
- Table 48: Global Steam Turbine For Power Generation Market Revenue Million Forecast, by Country 2020 & 2033
- Table 49: Brazil Steam Turbine For Power Generation Market Revenue (Million) Forecast, by Application 2020 & 2033
- Table 50: Argentina Steam Turbine For Power Generation Market Revenue (Million) Forecast, by Application 2020 & 2033
- Table 51: Colombia Steam Turbine For Power Generation Market Revenue (Million) Forecast, by Application 2020 & 2033
- Table 52: Rest of South America Steam Turbine For Power Generation Market Revenue (Million) Forecast, by Application 2020 & 2033
Frequently Asked Questions
1. What is the projected Compound Annual Growth Rate (CAGR) of the Steam Turbine For Power Generation Market?
The projected CAGR is approximately 3.49%.
2. Which companies are prominent players in the Steam Turbine For Power Generation Market?
Key companies in the market include Mitsubishi Heavy Industries Limited, MAN Energy Solutions SE*List Not Exhaustive, Toshiba Corporation, Dongfang Turbine Company Limited, Elliot Group, Bharat Heavy Electricals Limited, WEG S A, Doosan Enerbility Co Ltd, Siemens Energy AG, General Electric Company.
3. What are the main segments of the Steam Turbine For Power Generation Market?
The market segments include Plant Type, Capacity.
4. Can you provide details about the market size?
The market size is estimated to be USD 15.45 Million as of 2022.
5. What are some drivers contributing to market growth?
4.; Need for Continuous 24/7 Supply of Electricity 4.; Increasing Penetration of Natural Gas for Power Generation.
6. What are the notable trends driving market growth?
Natural Gas Plants to Witness Significant Growth.
7. Are there any restraints impacting market growth?
4.; The Complex Maintenance Process of Components And the Emergence of Toxic Wastes that Affect the Environment.
8. Can you provide examples of recent developments in the market?
April 2023: Doosan Koda Power was awarded a contract to supply a steam turbine to the South Clyde Energy Centre, a Scottish energy-from-waste (EfW) facility. When completed, this new facility will likely power 70,000 homes. Commercial operations will begin in 2025, with Scotland's ban on landfilling biodegradable municipal garbage.
9. What pricing options are available for accessing the report?
Pricing options include single-user, multi-user, and enterprise licenses priced at USD 4750, USD 5250, and USD 8750 respectively.
10. Is the market size provided in terms of value or volume?
The market size is provided in terms of value, measured in Million.
11. Are there any specific market keywords associated with the report?
Yes, the market keyword associated with the report is "Steam Turbine For Power Generation Market," which aids in identifying and referencing the specific market segment covered.
12. How do I determine which pricing option suits my needs best?
The pricing options vary based on user requirements and access needs. Individual users may opt for single-user licenses, while businesses requiring broader access may choose multi-user or enterprise licenses for cost-effective access to the report.
13. Are there any additional resources or data provided in the Steam Turbine For Power Generation Market report?
While the report offers comprehensive insights, it's advisable to review the specific contents or supplementary materials provided to ascertain if additional resources or data are available.
14. How can I stay updated on further developments or reports in the Steam Turbine For Power Generation Market?
To stay informed about further developments, trends, and reports in the Steam Turbine For Power Generation Market, consider subscribing to industry newsletters, following relevant companies and organizations, or regularly checking reputable industry news sources and publications.
Methodology
Step 1 - Identification of Relevant Samples Size from Population Database


Step 2 - Approaches for Defining Global Market Size (Value, Volume* & Price*)

Note*: In applicable scenarios
Step 3 - Data Sources
Primary Research
- Web Analytics
- Survey Reports
- Research Institute
- Latest Research Reports
- Opinion Leaders
Secondary Research
- Annual Reports
- White Paper
- Latest Press Release
- Industry Association
- Paid Database
- Investor Presentations

Step 4 - Data Triangulation
Involves using different sources of information in order to increase the validity of a study
These sources are likely to be stakeholders in a program - participants, other researchers, program staff, other community members, and so on.
Then we put all data in single framework & apply various statistical tools to find out the dynamic on the market.
During the analysis stage, feedback from the stakeholder groups would be compared to determine areas of agreement as well as areas of divergence