

Key Insights
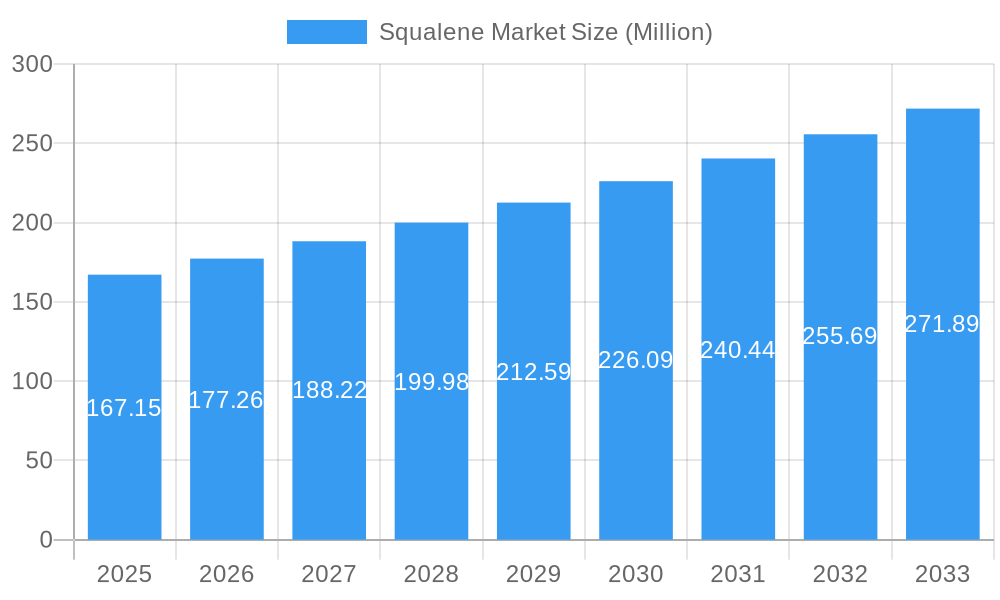
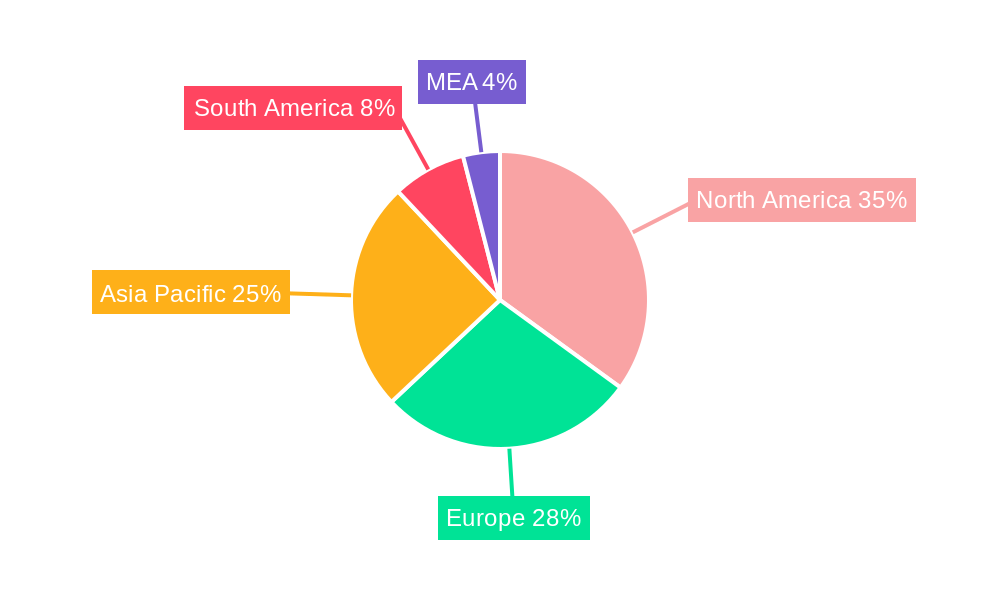
The global squalene market, valued at $167.15 million in 2025, is projected to experience robust growth, exhibiting a compound annual growth rate (CAGR) of 5.96% from 2025 to 2033. This expansion is driven by the increasing demand for squalene across diverse end-user industries, primarily cosmetics, food, and pharmaceuticals. The cosmetics industry's significant reliance on squalene as a moisturizing and skin-conditioning agent fuels market growth, as consumers increasingly seek natural and effective skincare solutions. Simultaneously, the growing awareness of squalene's health benefits in the food and pharmaceutical sectors—as a potent antioxidant and immune system booster—further contributes to market expansion. The availability of squalene from various sources, including animal (primarily shark liver oil, though sustainable alternatives are gaining traction), vegetable (olive oil, amaranth), and biosynthetic routes, provides market flexibility and caters to diverse consumer preferences and ethical considerations. However, fluctuations in raw material prices and the emergence of synthetic alternatives could pose challenges to market growth. Regional market dominance is expected to be shared, with North America and Asia-Pacific showing strong growth trajectories, driven by high consumer spending on personal care products and rising disposable incomes.
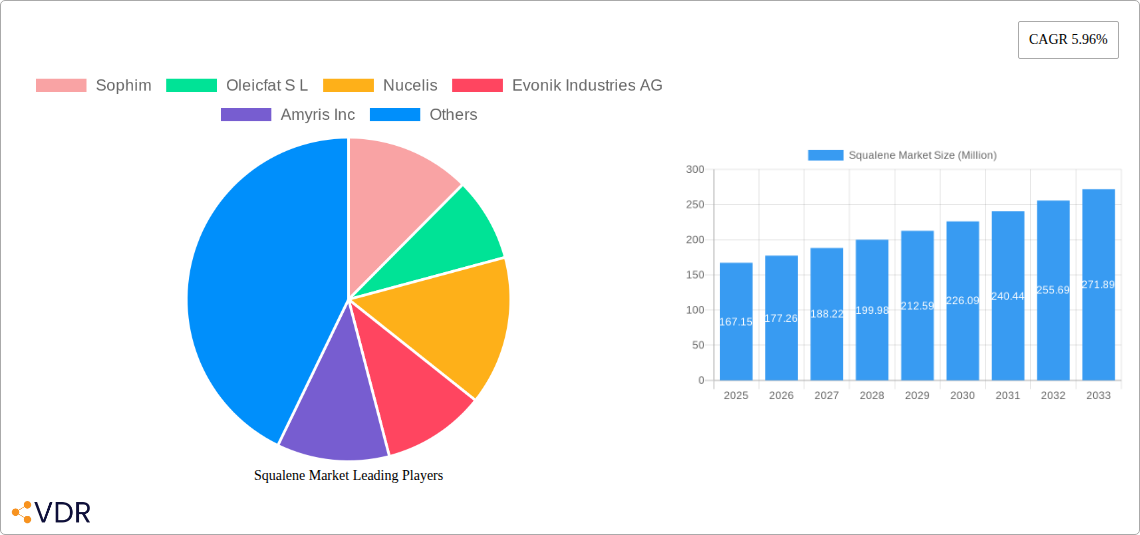
Squalene Market Market Size (In Million)
The market segmentation reveals significant opportunities within specific niches. The cosmetics segment is currently leading, but the food and pharmaceutical applications of squalene are showing promising growth potential. The shift towards sustainable sourcing practices is influencing the vegetable and biosynthetic segments significantly. Key players like Sophim, Oleicfat S.L., and Evonik Industries AG are leveraging their expertise in production and formulation to capture market share, while emerging companies are introducing innovative products and exploring new applications. The forecast period anticipates continued growth, driven by technological advancements in extraction and production, along with expanding research and development in squalene's applications across different sectors. This growth will likely be accompanied by increased focus on sustainable sourcing and transparency in the supply chain, satisfying consumer demand for ethically produced and environmentally friendly products.
Squalene Market Company Market Share
Squalene Market: A Comprehensive Report (2019-2033)
This comprehensive report provides an in-depth analysis of the global squalene market, encompassing market dynamics, growth trends, regional segmentation, product landscape, key players, and future outlook. The study period spans from 2019 to 2033, with 2025 serving as the base and estimated year. This report is crucial for businesses, investors, and researchers seeking to understand and capitalize on the burgeoning opportunities within the squalene market. The report covers parent markets like the cosmetic ingredients market and child markets such as pharmaceutical excipients, thus providing a holistic view.
Squalene Market Dynamics & Structure
The global squalene market is characterized by moderate concentration, with key players like Evonik Industries AG and Amyris Inc. holding significant market share (xx%). Technological innovations, particularly in biosynthetic production methods, are driving market expansion. Stringent regulations regarding animal-derived squalene are shaping market dynamics, favoring the growth of plant-based and synthetic alternatives. Competitive pressures stem from substitute ingredients, and mergers and acquisitions (M&A) are becoming increasingly common, as evidenced by xx M&A deals in the past five years.
- Market Concentration: Moderately concentrated, with top 5 players holding xx% market share.
- Technological Innovation: Biosynthetic production and improved extraction methods are key drivers.
- Regulatory Framework: Growing regulations against animal-derived squalene are favoring plant-based and synthetic sources.
- Competitive Substitutes: Other moisturizing and emollient ingredients pose a competitive challenge.
- End-User Demographics: Growing demand from cosmetics, pharmaceuticals, and food industries are fueling market growth.
- M&A Trends: Increased M&A activity reflects consolidation and expansion strategies within the industry.
Squalene Market Growth Trends & Insights
The global squalene market experienced significant growth during the historical period (2019-2024), driven by rising demand for natural and sustainable ingredients across various end-use industries. The market size reached xx Million units in 2024 and is projected to grow at a Compound Annual Growth Rate (CAGR) of xx% during the forecast period (2025-2033), reaching xx Million units by 2033. This growth is attributed to factors such as the increasing awareness of the skincare benefits of squalene, the rising demand for natural and organic products in the cosmetics industry, and its expanding use in the pharmaceutical sector as an adjuvant and excipient. Market penetration in the cosmetics sector is expected to reach xx% by 2033. Technological disruptions, such as the advancement of biosynthetic production methods, are also contributing to market expansion. Consumer behavior shifts toward sustainable and ethically sourced products further boost market growth.
Dominant Regions, Countries, or Segments in Squalene Market
North America currently dominates the squalene market, driven by high demand from the cosmetics and pharmaceuticals sectors, strong regulatory frameworks, and robust economic conditions. Europe is expected to witness significant growth due to the increasing consumer awareness of natural and sustainable products. The cosmetics segment holds the largest market share, followed by pharmaceuticals and food. Biosynthetic squalene is experiencing rapid growth due to its ethical and sustainable production methods.
- Key Drivers (North America): High consumer spending on cosmetics & pharmaceuticals, stringent quality control, strong regulatory compliance.
- Key Drivers (Europe): Growing consumer preference for natural and organic products, increasing demand from the personal care industry.
- Market Share: Cosmetics (xx%), Pharmaceuticals (xx%), Food (xx%).
- Growth Potential: Biosynthetic squalene (highest growth potential).
Squalene Market Product Landscape
Squalene products are available in various forms, including oils, powders, and emulsions, catering to diverse applications across different industries. Recent innovations focus on enhancing purity, stability, and efficacy. Biosynthetic squalene is gaining traction due to its consistent quality, sustainability, and ethical sourcing, offering a significant competitive advantage compared to animal-derived squalene. The emphasis is on developing high-quality, cost-effective, and sustainable products that meet the growing demands of diverse applications.
Key Drivers, Barriers & Challenges in Squalene Market
Key Drivers:
- Increasing demand for natural and sustainable ingredients in cosmetics and pharmaceuticals.
- Growing awareness of squalene's beneficial properties for skin health.
- Technological advancements in biosynthetic production methods.
Key Challenges:
- High production costs for biosynthetic squalene.
- Supply chain limitations for certain sources (e.g., shark liver oil).
- Regulatory hurdles related to the use of squalene in specific applications.
- Intense competition from substitute ingredients.
Emerging Opportunities in Squalene Market
Emerging opportunities include the expansion into untapped markets in Asia and Latin America, the development of novel applications in nutraceuticals and personal care products, and the growing interest in squalane-based products for cosmeceuticals. Customization of squalene products to meet specific end-use requirements also presents significant opportunities.
Growth Accelerators in the Squalene Market Industry
Strategic partnerships between raw material suppliers and end-product manufacturers are accelerating market growth. Technological advancements in biosynthetic production methods are making squalene more accessible and affordable. The expansion of market presence in emerging economies will further enhance market growth and penetration.
Key Players Shaping the Squalene Market Market
- Sophim
- Oleicfat S L
- Nucelis
- Evonik Industries AG
- Amyris Inc
- Gracefruit Limited
- Vestan S A
- Arbee
- Efpbiotek
- Kishimoto Special Liver Oil Co Ltd
Notable Milestones in Squalene Market Sector
- June 2022: Amyris announced the inauguration of the production of 13 molecules, including squalene, at its plant in Brazil, offering a sustainable alternative to shark-derived squalene.
- December 2022: Evonik Industries AG launched PhytoSquene, a non-animal-derived squalene suitable for vaccines and pharmaceutical applications.
- May 2023: Amyris partnered with Croda International Plc to supply biotechnology-derived, pharmaceutical-grade squalene for adjuvants.
In-Depth Squalene Market Market Outlook
The squalene market is poised for robust growth driven by technological innovations, expanding applications, and increasing consumer demand for natural and sustainable products. Strategic partnerships and market expansions into new regions will play a pivotal role in shaping the future of the squalene market. The continued development of sustainable and cost-effective biosynthetic production methods will further enhance market growth and affordability, resulting in a significant expansion of the market size over the forecast period.
Squalene Market Segmentation
-
1. Source
- 1.1. Animal Source
- 1.2. Vegetable Source
- 1.3. Biosynthetic
- 1.4. Other Sources
-
2. End-user Industry
- 2.1. Cosmetics
- 2.2. Food
- 2.3. Pharmaceuticals
- 2.4. Other End-user Industries
Squalene Market Segmentation By Geography
-
1. Asia Pacific
- 1.1. China
- 1.2. India
- 1.3. Japan
- 1.4. South Korea
- 1.5. Malaysia
- 1.6. Thailand
- 1.7. Indonesia
- 1.8. Vietnam
- 1.9. Rest of Asia Pacific
-
2. North America
- 2.1. United States
- 2.2. Canada
- 2.3. Mexico
-
3. Europe
- 3.1. Germany
- 3.2. United Kingdom
- 3.3. France
- 3.4. Italy
- 3.5. Spain
- 3.6. NORDIC Countries
- 3.7. Turkey
- 3.8. Russia
- 3.9. Rest of Europe
-
4. South America
- 4.1. Brazil
- 4.2. Argentina
- 4.3. Colombia
- 4.4. Rest of South America
-
5. Middle East and Africa
- 5.1. Saudi Arabia
- 5.2. Qatar
- 5.3. United Arab Emirates
- 5.4. Nigeria
- 5.5. Egypt
- 5.6. South Africa
- 5.7. Rest of Middle East and Africa
Squalene Market Regional Market Share
Geographic Coverage of Squalene Market
Squalene Market REPORT HIGHLIGHTS
| Aspects | Details |
|---|---|
| Study Period | 2020-2034 |
| Base Year | 2025 |
| Estimated Year | 2026 |
| Forecast Period | 2026-2034 |
| Historical Period | 2020-2025 |
| Growth Rate | CAGR of 5.96% from 2020-2034 |
| Segmentation |
|
Table of Contents
- 1. Introduction
- 1.1. Research Scope
- 1.2. Market Segmentation
- 1.3. Research Objective
- 1.4. Definitions and Assumptions
- 2. Executive Summary
- 2.1. Market Snapshot
- 3. Market Dynamics
- 3.1. Market Drivers
- 3.2. Market Restrains
- 3.3. Market Trends
- 3.4. Market Opportunities
- 4. Market Factor Analysis
- 4.1. Porters Five Forces
- 4.1.1. Bargaining Power of Suppliers
- 4.1.2. Bargaining Power of Buyers
- 4.1.3. Threat of New Entrants
- 4.1.4. Threat of Substitutes
- 4.1.5. Competitive Rivalry
- 4.2. PESTEL analysis
- 4.3. BCG Analysis
- 4.3.1. Stars (High Growth, High Market Share)
- 4.3.2. Cash Cows (Low Growth, High Market Share)
- 4.3.3. Question Mark (High Growth, Low Market Share)
- 4.3.4. Dogs (Low Growth, Low Market Share)
- 4.4. Ansoff Matrix Analysis
- 4.5. Supply Chain Analysis
- 4.6. Regulatory Landscape
- 4.7. Current Market Potential and Opportunity Assessment (TAM–SAM–SOM Framework)
- 4.8. VDR Analyst Note
- 4.1. Porters Five Forces
- 5. Market Analysis, Insights and Forecast 2021-2033
- 5.1. Market Analysis, Insights and Forecast - by Source
- 5.1.1. Animal Source
- 5.1.2. Vegetable Source
- 5.1.3. Biosynthetic
- 5.1.4. Other Sources
- 5.2. Market Analysis, Insights and Forecast - by End-user Industry
- 5.2.1. Cosmetics
- 5.2.2. Food
- 5.2.3. Pharmaceuticals
- 5.2.4. Other End-user Industries
- 5.3. Market Analysis, Insights and Forecast - by Region
- 5.3.1. Asia Pacific
- 5.3.2. North America
- 5.3.3. Europe
- 5.3.4. South America
- 5.3.5. Middle East and Africa
- 5.1. Market Analysis, Insights and Forecast - by Source
- 6. Global Squalene Market Analysis, Insights and Forecast, 2021-2033
- 6.1. Market Analysis, Insights and Forecast - by Source
- 6.1.1. Animal Source
- 6.1.2. Vegetable Source
- 6.1.3. Biosynthetic
- 6.1.4. Other Sources
- 6.2. Market Analysis, Insights and Forecast - by End-user Industry
- 6.2.1. Cosmetics
- 6.2.2. Food
- 6.2.3. Pharmaceuticals
- 6.2.4. Other End-user Industries
- 6.1. Market Analysis, Insights and Forecast - by Source
- 7. Asia Pacific Squalene Market Analysis, Insights and Forecast, 2021-2033
- 7.1. Market Analysis, Insights and Forecast - by Source
- 7.1.1. Animal Source
- 7.1.2. Vegetable Source
- 7.1.3. Biosynthetic
- 7.1.4. Other Sources
- 7.2. Market Analysis, Insights and Forecast - by End-user Industry
- 7.2.1. Cosmetics
- 7.2.2. Food
- 7.2.3. Pharmaceuticals
- 7.2.4. Other End-user Industries
- 7.1. Market Analysis, Insights and Forecast - by Source
- 8. North America Squalene Market Analysis, Insights and Forecast, 2021-2033
- 8.1. Market Analysis, Insights and Forecast - by Source
- 8.1.1. Animal Source
- 8.1.2. Vegetable Source
- 8.1.3. Biosynthetic
- 8.1.4. Other Sources
- 8.2. Market Analysis, Insights and Forecast - by End-user Industry
- 8.2.1. Cosmetics
- 8.2.2. Food
- 8.2.3. Pharmaceuticals
- 8.2.4. Other End-user Industries
- 8.1. Market Analysis, Insights and Forecast - by Source
- 9. Europe Squalene Market Analysis, Insights and Forecast, 2021-2033
- 9.1. Market Analysis, Insights and Forecast - by Source
- 9.1.1. Animal Source
- 9.1.2. Vegetable Source
- 9.1.3. Biosynthetic
- 9.1.4. Other Sources
- 9.2. Market Analysis, Insights and Forecast - by End-user Industry
- 9.2.1. Cosmetics
- 9.2.2. Food
- 9.2.3. Pharmaceuticals
- 9.2.4. Other End-user Industries
- 9.1. Market Analysis, Insights and Forecast - by Source
- 10. South America Squalene Market Analysis, Insights and Forecast, 2021-2033
- 10.1. Market Analysis, Insights and Forecast - by Source
- 10.1.1. Animal Source
- 10.1.2. Vegetable Source
- 10.1.3. Biosynthetic
- 10.1.4. Other Sources
- 10.2. Market Analysis, Insights and Forecast - by End-user Industry
- 10.2.1. Cosmetics
- 10.2.2. Food
- 10.2.3. Pharmaceuticals
- 10.2.4. Other End-user Industries
- 10.1. Market Analysis, Insights and Forecast - by Source
- 11. Middle East and Africa Squalene Market Analysis, Insights and Forecast, 2021-2033
- 11.1. Market Analysis, Insights and Forecast - by Source
- 11.1.1. Animal Source
- 11.1.2. Vegetable Source
- 11.1.3. Biosynthetic
- 11.1.4. Other Sources
- 11.2. Market Analysis, Insights and Forecast - by End-user Industry
- 11.2.1. Cosmetics
- 11.2.2. Food
- 11.2.3. Pharmaceuticals
- 11.2.4. Other End-user Industries
- 11.1. Market Analysis, Insights and Forecast - by Source
- 12. Competitive Analysis
- 12.1. Company Profiles
- 12.1.1 Sophim
- 12.1.1.1. Company Overview
- 12.1.1.2. Products
- 12.1.1.3. Company Financials
- 12.1.1.4. SWOT Analysis
- 12.1.2 Oleicfat S L
- 12.1.2.1. Company Overview
- 12.1.2.2. Products
- 12.1.2.3. Company Financials
- 12.1.2.4. SWOT Analysis
- 12.1.3 Nucelis
- 12.1.3.1. Company Overview
- 12.1.3.2. Products
- 12.1.3.3. Company Financials
- 12.1.3.4. SWOT Analysis
- 12.1.4 Evonik Industries AG
- 12.1.4.1. Company Overview
- 12.1.4.2. Products
- 12.1.4.3. Company Financials
- 12.1.4.4. SWOT Analysis
- 12.1.5 Amyris Inc
- 12.1.5.1. Company Overview
- 12.1.5.2. Products
- 12.1.5.3. Company Financials
- 12.1.5.4. SWOT Analysis
- 12.1.6 Gracefruit Limited
- 12.1.6.1. Company Overview
- 12.1.6.2. Products
- 12.1.6.3. Company Financials
- 12.1.6.4. SWOT Analysis
- 12.1.7 Vestan S A
- 12.1.7.1. Company Overview
- 12.1.7.2. Products
- 12.1.7.3. Company Financials
- 12.1.7.4. SWOT Analysis
- 12.1.8 Arbee
- 12.1.8.1. Company Overview
- 12.1.8.2. Products
- 12.1.8.3. Company Financials
- 12.1.8.4. SWOT Analysis
- 12.1.9 Efpbiotek
- 12.1.9.1. Company Overview
- 12.1.9.2. Products
- 12.1.9.3. Company Financials
- 12.1.9.4. SWOT Analysis
- 12.1.10 Kishimoto Special Liver Oil Co Ltd
- 12.1.10.1. Company Overview
- 12.1.10.2. Products
- 12.1.10.3. Company Financials
- 12.1.10.4. SWOT Analysis
- 12.1.1 Sophim
- 12.2. Market Entropy
- 12.2.1 Company's Key Areas Served
- 12.2.2 Recent Developments
- 12.3. Company Market Share Analysis 2025
- 12.3.1 Top 5 Companies Market Share Analysis
- 12.3.2 Top 3 Companies Market Share Analysis
- 12.4. List of Potential Customers
- 13. Research Methodology
List of Figures
- Figure 1: Global Squalene Market Revenue Breakdown (Million, %) by Region 2025 & 2033
- Figure 2: Global Squalene Market Volume Breakdown (K Tons, %) by Region 2025 & 2033
- Figure 3: Asia Pacific Squalene Market Revenue (Million), by Source 2025 & 2033
- Figure 4: Asia Pacific Squalene Market Volume (K Tons), by Source 2025 & 2033
- Figure 5: Asia Pacific Squalene Market Revenue Share (%), by Source 2025 & 2033
- Figure 6: Asia Pacific Squalene Market Volume Share (%), by Source 2025 & 2033
- Figure 7: Asia Pacific Squalene Market Revenue (Million), by End-user Industry 2025 & 2033
- Figure 8: Asia Pacific Squalene Market Volume (K Tons), by End-user Industry 2025 & 2033
- Figure 9: Asia Pacific Squalene Market Revenue Share (%), by End-user Industry 2025 & 2033
- Figure 10: Asia Pacific Squalene Market Volume Share (%), by End-user Industry 2025 & 2033
- Figure 11: Asia Pacific Squalene Market Revenue (Million), by Country 2025 & 2033
- Figure 12: Asia Pacific Squalene Market Volume (K Tons), by Country 2025 & 2033
- Figure 13: Asia Pacific Squalene Market Revenue Share (%), by Country 2025 & 2033
- Figure 14: Asia Pacific Squalene Market Volume Share (%), by Country 2025 & 2033
- Figure 15: North America Squalene Market Revenue (Million), by Source 2025 & 2033
- Figure 16: North America Squalene Market Volume (K Tons), by Source 2025 & 2033
- Figure 17: North America Squalene Market Revenue Share (%), by Source 2025 & 2033
- Figure 18: North America Squalene Market Volume Share (%), by Source 2025 & 2033
- Figure 19: North America Squalene Market Revenue (Million), by End-user Industry 2025 & 2033
- Figure 20: North America Squalene Market Volume (K Tons), by End-user Industry 2025 & 2033
- Figure 21: North America Squalene Market Revenue Share (%), by End-user Industry 2025 & 2033
- Figure 22: North America Squalene Market Volume Share (%), by End-user Industry 2025 & 2033
- Figure 23: North America Squalene Market Revenue (Million), by Country 2025 & 2033
- Figure 24: North America Squalene Market Volume (K Tons), by Country 2025 & 2033
- Figure 25: North America Squalene Market Revenue Share (%), by Country 2025 & 2033
- Figure 26: North America Squalene Market Volume Share (%), by Country 2025 & 2033
- Figure 27: Europe Squalene Market Revenue (Million), by Source 2025 & 2033
- Figure 28: Europe Squalene Market Volume (K Tons), by Source 2025 & 2033
- Figure 29: Europe Squalene Market Revenue Share (%), by Source 2025 & 2033
- Figure 30: Europe Squalene Market Volume Share (%), by Source 2025 & 2033
- Figure 31: Europe Squalene Market Revenue (Million), by End-user Industry 2025 & 2033
- Figure 32: Europe Squalene Market Volume (K Tons), by End-user Industry 2025 & 2033
- Figure 33: Europe Squalene Market Revenue Share (%), by End-user Industry 2025 & 2033
- Figure 34: Europe Squalene Market Volume Share (%), by End-user Industry 2025 & 2033
- Figure 35: Europe Squalene Market Revenue (Million), by Country 2025 & 2033
- Figure 36: Europe Squalene Market Volume (K Tons), by Country 2025 & 2033
- Figure 37: Europe Squalene Market Revenue Share (%), by Country 2025 & 2033
- Figure 38: Europe Squalene Market Volume Share (%), by Country 2025 & 2033
- Figure 39: South America Squalene Market Revenue (Million), by Source 2025 & 2033
- Figure 40: South America Squalene Market Volume (K Tons), by Source 2025 & 2033
- Figure 41: South America Squalene Market Revenue Share (%), by Source 2025 & 2033
- Figure 42: South America Squalene Market Volume Share (%), by Source 2025 & 2033
- Figure 43: South America Squalene Market Revenue (Million), by End-user Industry 2025 & 2033
- Figure 44: South America Squalene Market Volume (K Tons), by End-user Industry 2025 & 2033
- Figure 45: South America Squalene Market Revenue Share (%), by End-user Industry 2025 & 2033
- Figure 46: South America Squalene Market Volume Share (%), by End-user Industry 2025 & 2033
- Figure 47: South America Squalene Market Revenue (Million), by Country 2025 & 2033
- Figure 48: South America Squalene Market Volume (K Tons), by Country 2025 & 2033
- Figure 49: South America Squalene Market Revenue Share (%), by Country 2025 & 2033
- Figure 50: South America Squalene Market Volume Share (%), by Country 2025 & 2033
- Figure 51: Middle East and Africa Squalene Market Revenue (Million), by Source 2025 & 2033
- Figure 52: Middle East and Africa Squalene Market Volume (K Tons), by Source 2025 & 2033
- Figure 53: Middle East and Africa Squalene Market Revenue Share (%), by Source 2025 & 2033
- Figure 54: Middle East and Africa Squalene Market Volume Share (%), by Source 2025 & 2033
- Figure 55: Middle East and Africa Squalene Market Revenue (Million), by End-user Industry 2025 & 2033
- Figure 56: Middle East and Africa Squalene Market Volume (K Tons), by End-user Industry 2025 & 2033
- Figure 57: Middle East and Africa Squalene Market Revenue Share (%), by End-user Industry 2025 & 2033
- Figure 58: Middle East and Africa Squalene Market Volume Share (%), by End-user Industry 2025 & 2033
- Figure 59: Middle East and Africa Squalene Market Revenue (Million), by Country 2025 & 2033
- Figure 60: Middle East and Africa Squalene Market Volume (K Tons), by Country 2025 & 2033
- Figure 61: Middle East and Africa Squalene Market Revenue Share (%), by Country 2025 & 2033
- Figure 62: Middle East and Africa Squalene Market Volume Share (%), by Country 2025 & 2033
List of Tables
- Table 1: Global Squalene Market Revenue Million Forecast, by Source 2020 & 2033
- Table 2: Global Squalene Market Volume K Tons Forecast, by Source 2020 & 2033
- Table 3: Global Squalene Market Revenue Million Forecast, by End-user Industry 2020 & 2033
- Table 4: Global Squalene Market Volume K Tons Forecast, by End-user Industry 2020 & 2033
- Table 5: Global Squalene Market Revenue Million Forecast, by Region 2020 & 2033
- Table 6: Global Squalene Market Volume K Tons Forecast, by Region 2020 & 2033
- Table 7: Global Squalene Market Revenue Million Forecast, by Source 2020 & 2033
- Table 8: Global Squalene Market Volume K Tons Forecast, by Source 2020 & 2033
- Table 9: Global Squalene Market Revenue Million Forecast, by End-user Industry 2020 & 2033
- Table 10: Global Squalene Market Volume K Tons Forecast, by End-user Industry 2020 & 2033
- Table 11: Global Squalene Market Revenue Million Forecast, by Country 2020 & 2033
- Table 12: Global Squalene Market Volume K Tons Forecast, by Country 2020 & 2033
- Table 13: China Squalene Market Revenue (Million) Forecast, by Application 2020 & 2033
- Table 14: China Squalene Market Volume (K Tons) Forecast, by Application 2020 & 2033
- Table 15: India Squalene Market Revenue (Million) Forecast, by Application 2020 & 2033
- Table 16: India Squalene Market Volume (K Tons) Forecast, by Application 2020 & 2033
- Table 17: Japan Squalene Market Revenue (Million) Forecast, by Application 2020 & 2033
- Table 18: Japan Squalene Market Volume (K Tons) Forecast, by Application 2020 & 2033
- Table 19: South Korea Squalene Market Revenue (Million) Forecast, by Application 2020 & 2033
- Table 20: South Korea Squalene Market Volume (K Tons) Forecast, by Application 2020 & 2033
- Table 21: Malaysia Squalene Market Revenue (Million) Forecast, by Application 2020 & 2033
- Table 22: Malaysia Squalene Market Volume (K Tons) Forecast, by Application 2020 & 2033
- Table 23: Thailand Squalene Market Revenue (Million) Forecast, by Application 2020 & 2033
- Table 24: Thailand Squalene Market Volume (K Tons) Forecast, by Application 2020 & 2033
- Table 25: Indonesia Squalene Market Revenue (Million) Forecast, by Application 2020 & 2033
- Table 26: Indonesia Squalene Market Volume (K Tons) Forecast, by Application 2020 & 2033
- Table 27: Vietnam Squalene Market Revenue (Million) Forecast, by Application 2020 & 2033
- Table 28: Vietnam Squalene Market Volume (K Tons) Forecast, by Application 2020 & 2033
- Table 29: Rest of Asia Pacific Squalene Market Revenue (Million) Forecast, by Application 2020 & 2033
- Table 30: Rest of Asia Pacific Squalene Market Volume (K Tons) Forecast, by Application 2020 & 2033
- Table 31: Global Squalene Market Revenue Million Forecast, by Source 2020 & 2033
- Table 32: Global Squalene Market Volume K Tons Forecast, by Source 2020 & 2033
- Table 33: Global Squalene Market Revenue Million Forecast, by End-user Industry 2020 & 2033
- Table 34: Global Squalene Market Volume K Tons Forecast, by End-user Industry 2020 & 2033
- Table 35: Global Squalene Market Revenue Million Forecast, by Country 2020 & 2033
- Table 36: Global Squalene Market Volume K Tons Forecast, by Country 2020 & 2033
- Table 37: United States Squalene Market Revenue (Million) Forecast, by Application 2020 & 2033
- Table 38: United States Squalene Market Volume (K Tons) Forecast, by Application 2020 & 2033
- Table 39: Canada Squalene Market Revenue (Million) Forecast, by Application 2020 & 2033
- Table 40: Canada Squalene Market Volume (K Tons) Forecast, by Application 2020 & 2033
- Table 41: Mexico Squalene Market Revenue (Million) Forecast, by Application 2020 & 2033
- Table 42: Mexico Squalene Market Volume (K Tons) Forecast, by Application 2020 & 2033
- Table 43: Global Squalene Market Revenue Million Forecast, by Source 2020 & 2033
- Table 44: Global Squalene Market Volume K Tons Forecast, by Source 2020 & 2033
- Table 45: Global Squalene Market Revenue Million Forecast, by End-user Industry 2020 & 2033
- Table 46: Global Squalene Market Volume K Tons Forecast, by End-user Industry 2020 & 2033
- Table 47: Global Squalene Market Revenue Million Forecast, by Country 2020 & 2033
- Table 48: Global Squalene Market Volume K Tons Forecast, by Country 2020 & 2033
- Table 49: Germany Squalene Market Revenue (Million) Forecast, by Application 2020 & 2033
- Table 50: Germany Squalene Market Volume (K Tons) Forecast, by Application 2020 & 2033
- Table 51: United Kingdom Squalene Market Revenue (Million) Forecast, by Application 2020 & 2033
- Table 52: United Kingdom Squalene Market Volume (K Tons) Forecast, by Application 2020 & 2033
- Table 53: France Squalene Market Revenue (Million) Forecast, by Application 2020 & 2033
- Table 54: France Squalene Market Volume (K Tons) Forecast, by Application 2020 & 2033
- Table 55: Italy Squalene Market Revenue (Million) Forecast, by Application 2020 & 2033
- Table 56: Italy Squalene Market Volume (K Tons) Forecast, by Application 2020 & 2033
- Table 57: Spain Squalene Market Revenue (Million) Forecast, by Application 2020 & 2033
- Table 58: Spain Squalene Market Volume (K Tons) Forecast, by Application 2020 & 2033
- Table 59: NORDIC Countries Squalene Market Revenue (Million) Forecast, by Application 2020 & 2033
- Table 60: NORDIC Countries Squalene Market Volume (K Tons) Forecast, by Application 2020 & 2033
- Table 61: Turkey Squalene Market Revenue (Million) Forecast, by Application 2020 & 2033
- Table 62: Turkey Squalene Market Volume (K Tons) Forecast, by Application 2020 & 2033
- Table 63: Russia Squalene Market Revenue (Million) Forecast, by Application 2020 & 2033
- Table 64: Russia Squalene Market Volume (K Tons) Forecast, by Application 2020 & 2033
- Table 65: Rest of Europe Squalene Market Revenue (Million) Forecast, by Application 2020 & 2033
- Table 66: Rest of Europe Squalene Market Volume (K Tons) Forecast, by Application 2020 & 2033
- Table 67: Global Squalene Market Revenue Million Forecast, by Source 2020 & 2033
- Table 68: Global Squalene Market Volume K Tons Forecast, by Source 2020 & 2033
- Table 69: Global Squalene Market Revenue Million Forecast, by End-user Industry 2020 & 2033
- Table 70: Global Squalene Market Volume K Tons Forecast, by End-user Industry 2020 & 2033
- Table 71: Global Squalene Market Revenue Million Forecast, by Country 2020 & 2033
- Table 72: Global Squalene Market Volume K Tons Forecast, by Country 2020 & 2033
- Table 73: Brazil Squalene Market Revenue (Million) Forecast, by Application 2020 & 2033
- Table 74: Brazil Squalene Market Volume (K Tons) Forecast, by Application 2020 & 2033
- Table 75: Argentina Squalene Market Revenue (Million) Forecast, by Application 2020 & 2033
- Table 76: Argentina Squalene Market Volume (K Tons) Forecast, by Application 2020 & 2033
- Table 77: Colombia Squalene Market Revenue (Million) Forecast, by Application 2020 & 2033
- Table 78: Colombia Squalene Market Volume (K Tons) Forecast, by Application 2020 & 2033
- Table 79: Rest of South America Squalene Market Revenue (Million) Forecast, by Application 2020 & 2033
- Table 80: Rest of South America Squalene Market Volume (K Tons) Forecast, by Application 2020 & 2033
- Table 81: Global Squalene Market Revenue Million Forecast, by Source 2020 & 2033
- Table 82: Global Squalene Market Volume K Tons Forecast, by Source 2020 & 2033
- Table 83: Global Squalene Market Revenue Million Forecast, by End-user Industry 2020 & 2033
- Table 84: Global Squalene Market Volume K Tons Forecast, by End-user Industry 2020 & 2033
- Table 85: Global Squalene Market Revenue Million Forecast, by Country 2020 & 2033
- Table 86: Global Squalene Market Volume K Tons Forecast, by Country 2020 & 2033
- Table 87: Saudi Arabia Squalene Market Revenue (Million) Forecast, by Application 2020 & 2033
- Table 88: Saudi Arabia Squalene Market Volume (K Tons) Forecast, by Application 2020 & 2033
- Table 89: Qatar Squalene Market Revenue (Million) Forecast, by Application 2020 & 2033
- Table 90: Qatar Squalene Market Volume (K Tons) Forecast, by Application 2020 & 2033
- Table 91: United Arab Emirates Squalene Market Revenue (Million) Forecast, by Application 2020 & 2033
- Table 92: United Arab Emirates Squalene Market Volume (K Tons) Forecast, by Application 2020 & 2033
- Table 93: Nigeria Squalene Market Revenue (Million) Forecast, by Application 2020 & 2033
- Table 94: Nigeria Squalene Market Volume (K Tons) Forecast, by Application 2020 & 2033
- Table 95: Egypt Squalene Market Revenue (Million) Forecast, by Application 2020 & 2033
- Table 96: Egypt Squalene Market Volume (K Tons) Forecast, by Application 2020 & 2033
- Table 97: South Africa Squalene Market Revenue (Million) Forecast, by Application 2020 & 2033
- Table 98: South Africa Squalene Market Volume (K Tons) Forecast, by Application 2020 & 2033
- Table 99: Rest of Middle East and Africa Squalene Market Revenue (Million) Forecast, by Application 2020 & 2033
- Table 100: Rest of Middle East and Africa Squalene Market Volume (K Tons) Forecast, by Application 2020 & 2033
Frequently Asked Questions
1. What is the projected Compound Annual Growth Rate (CAGR) of the Squalene Market?
The projected CAGR is approximately 5.96%.
2. Which companies are prominent players in the Squalene Market?
Key companies in the market include Sophim, Oleicfat S L, Nucelis, Evonik Industries AG, Amyris Inc, Gracefruit Limited, Vestan S A, Arbee, Efpbiotek, Kishimoto Special Liver Oil Co Ltd.
3. What are the main segments of the Squalene Market?
The market segments include Source, End-user Industry.
4. Can you provide details about the market size?
The market size is estimated to be USD 167.15 Million as of 2022.
5. What are some drivers contributing to market growth?
Growing Cosmetics Industry; Growing Demand from the Nutraceutical Industry; Growing Consumption in Pharmaceutical Industry.
6. What are the notable trends driving market growth?
Cosmetics Industry to Dominate the Market.
7. Are there any restraints impacting market growth?
Shark Killing Concerns and Limitations; Other Restraints.
8. Can you provide examples of recent developments in the market?
May 2023: Amyris announced its partnership with Croda International Plc (Croda) to supply biotechnology-derived, pharmaceutical-grade squalene used in adjuvants to boost immune responses.
9. What pricing options are available for accessing the report?
Pricing options include single-user, multi-user, and enterprise licenses priced at USD 4750, USD 5250, and USD 8750 respectively.
10. Is the market size provided in terms of value or volume?
The market size is provided in terms of value, measured in Million and volume, measured in K Tons.
11. Are there any specific market keywords associated with the report?
Yes, the market keyword associated with the report is "Squalene Market," which aids in identifying and referencing the specific market segment covered.
12. How do I determine which pricing option suits my needs best?
The pricing options vary based on user requirements and access needs. Individual users may opt for single-user licenses, while businesses requiring broader access may choose multi-user or enterprise licenses for cost-effective access to the report.
13. Are there any additional resources or data provided in the Squalene Market report?
While the report offers comprehensive insights, it's advisable to review the specific contents or supplementary materials provided to ascertain if additional resources or data are available.
14. How can I stay updated on further developments or reports in the Squalene Market?
To stay informed about further developments, trends, and reports in the Squalene Market, consider subscribing to industry newsletters, following relevant companies and organizations, or regularly checking reputable industry news sources and publications.
Methodology
Step 1 - Identification of Relevant Samples Size from Population Database


Step 2 - Approaches for Defining Global Market Size (Value, Volume* & Price*)

Note*: In applicable scenarios
Step 3 - Data Sources
Primary Research
- Web Analytics
- Survey Reports
- Research Institute
- Latest Research Reports
- Opinion Leaders
Secondary Research
- Annual Reports
- White Paper
- Latest Press Release
- Industry Association
- Paid Database
- Investor Presentations

Step 4 - Data Triangulation
Involves using different sources of information in order to increase the validity of a study
These sources are likely to be stakeholders in a program - participants, other researchers, program staff, other community members, and so on.
Then we put all data in single framework & apply various statistical tools to find out the dynamic on the market.
During the analysis stage, feedback from the stakeholder groups would be compared to determine areas of agreement as well as areas of divergence