
Key Insights
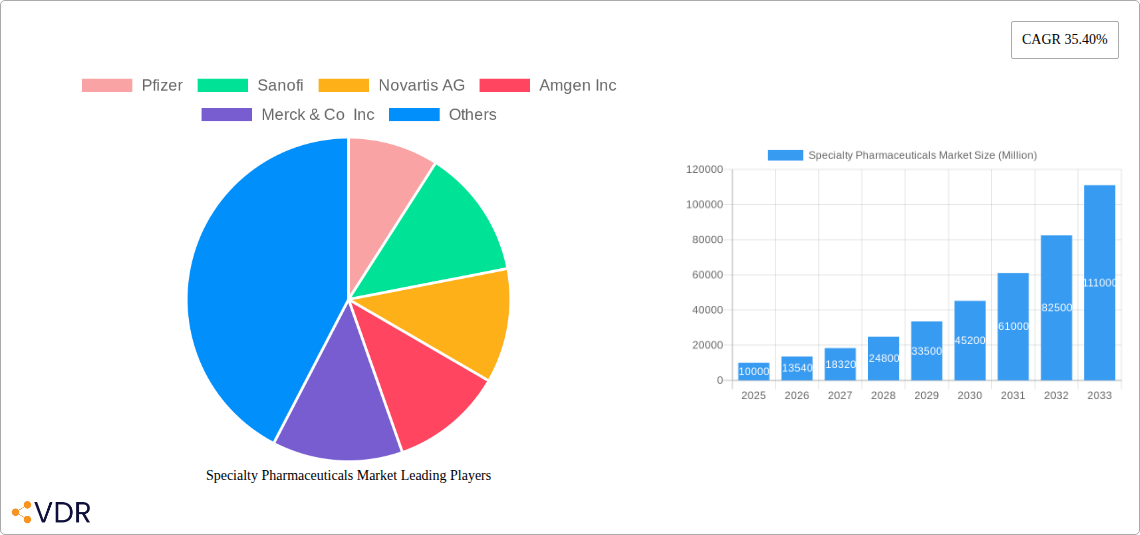
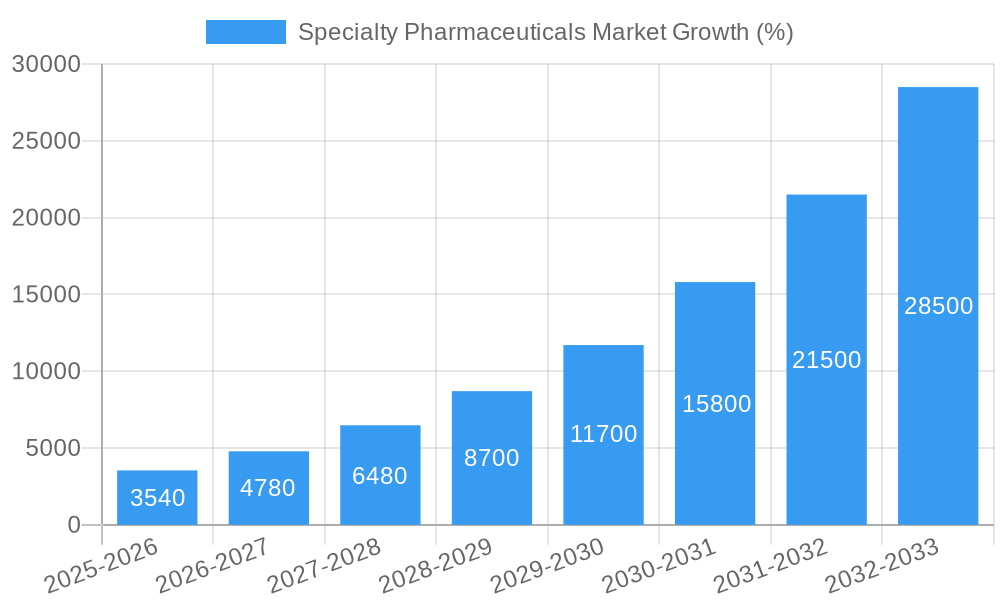
The specialty pharmaceuticals market is experiencing robust growth, projected to reach a significant market size within the forecast period (2025-2033). A compound annual growth rate (CAGR) of 35.40% signifies a dynamic and expanding sector driven by several key factors. The increasing prevalence of chronic diseases like cancer, inflammatory conditions, and multiple sclerosis fuels demand for innovative and specialized treatments. Advancements in biotechnology and pharmaceutical research are continuously delivering novel therapies, further stimulating market expansion. Furthermore, the rising geriatric population globally contributes to higher healthcare spending and increased demand for specialty pharmaceuticals. The market is segmented by therapeutic area (oncology leading the way), route of administration (with parenteral and oral routes dominating), and distribution channel (hospitals and specialty pharmacies holding significant shares). While pricing pressures and regulatory hurdles represent challenges, the overall market outlook remains positive, driven by the unmet medical needs and the continuous pipeline of promising new drugs.
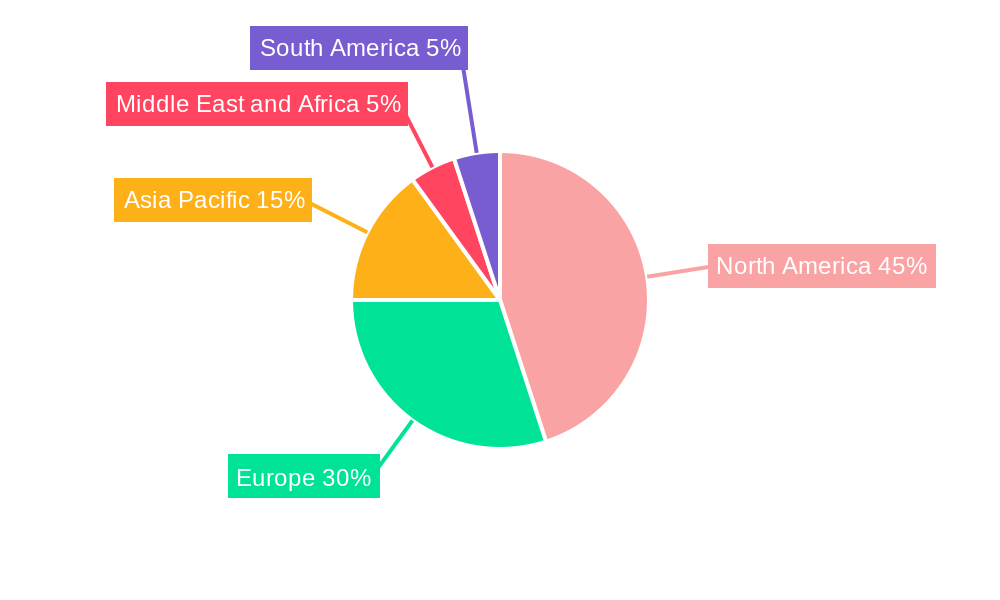
The North American region, particularly the United States, is expected to maintain a dominant market share due to high healthcare expenditure, advanced healthcare infrastructure, and a large patient population. However, other regions like Asia Pacific are experiencing rapid growth, driven by increasing healthcare awareness, rising disposable incomes, and expanding access to advanced medical treatments. Key players like Pfizer, Sanofi, Novartis, and others are actively engaged in research and development, strategic partnerships, and mergers and acquisitions to strengthen their market positions and capitalize on the lucrative opportunities within the specialty pharmaceuticals landscape. The market's future growth will be shaped by factors such as the successful launch of new therapies, government policies promoting healthcare access, and the evolving landscape of reimbursement models. Competition among established players and emerging biotech companies will intensify, driving innovation and potentially leading to more affordable and accessible specialty medications.
Specialty Pharmaceuticals Market: A Comprehensive Report (2019-2033)
This comprehensive report provides a detailed analysis of the Specialty Pharmaceuticals Market, encompassing market dynamics, growth trends, regional insights, product landscapes, and key player strategies. The report covers the period from 2019 to 2033, with a focus on the forecast period from 2025 to 2033 and a base year of 2025. The market is segmented by therapeutic area (Oncology, Inflammatory Conditions, Multiple Sclerosis, Infectious Diseases, Others), route of administration (Oral, Parenteral, Transdermal), and distribution channel (Hospitals, Retail Pharmacies, Specialty Pharmacies). The report offers crucial insights for industry professionals, investors, and stakeholders seeking to navigate this rapidly evolving market. The total market value in 2025 is estimated at XXX million units.
Specialty Pharmaceuticals Market Dynamics & Structure
The specialty pharmaceuticals market is characterized by high concentration among leading players, significant technological innovation, and complex regulatory frameworks. Market concentration is high, with the top 10 companies holding an estimated xx% market share in 2025. Technological advancements, particularly in biologics and targeted therapies, are driving substantial growth. However, stringent regulatory approvals and high R&D costs present significant barriers to entry. The market is also witnessing a rise in mergers and acquisitions (M&A) activity, with an estimated xx M&A deals in 2024.
- Market Concentration: High, with top 10 companies holding xx% market share (2025).
- Technological Innovation: Significant advancements in biologics, targeted therapies, and personalized medicine.
- Regulatory Frameworks: Stringent approval processes and evolving regulations.
- Competitive Product Substitutes: Generic competition and biosimilars pose challenges.
- End-User Demographics: Growing aging population and increasing prevalence of chronic diseases.
- M&A Trends: High M&A activity, driven by market consolidation and expansion strategies.
Specialty Pharmaceuticals Market Growth Trends & Insights
The specialty pharmaceuticals market exhibits robust growth, driven by factors such as the rising prevalence of chronic diseases, an aging population, and continuous technological advancements. The market size is projected to experience a Compound Annual Growth Rate (CAGR) of xx% during the forecast period (2025-2033), expanding from XXX million units in 2025 to an estimated XXX million units by 2033. Technological disruptions, including the development of novel drug delivery systems and personalized medicine approaches, are significantly impacting market adoption rates. Consumer behavior is shifting towards greater demand for convenient, targeted, and effective therapies.
Dominant Regions, Countries, or Segments in Specialty Pharmaceuticals Market
North America is currently the dominant region in the specialty pharmaceuticals market, driven by high healthcare expenditure, advanced healthcare infrastructure, and a large patient population with chronic diseases. Within therapeutic areas, Oncology holds the largest market share due to the escalating prevalence of cancer and the development of innovative cancer therapies. The Parenteral route of administration is also experiencing significant growth, owing to its efficacy in delivering complex drugs. Specialty pharmacies are playing an increasingly crucial role in distribution, given their expertise in handling specialized medications.
- Leading Region: North America
- Leading Therapeutic Area: Oncology
- Leading Route of Administration: Parenteral
- Leading Distribution Channel: Specialty Pharmacies
- Key Drivers: High healthcare expenditure, advanced healthcare infrastructure, increasing prevalence of chronic diseases, technological advancements.
Specialty Pharmaceuticals Market Product Landscape
The specialty pharmaceuticals market showcases a diverse range of innovative products, encompassing targeted therapies, biologics, and advanced drug delivery systems. These products are characterized by high efficacy, improved safety profiles, and enhanced patient compliance. Key technological advancements include the development of personalized medicine approaches, biosimilars, and novel drug delivery methods such as nanoparticles and liposomes. These innovations cater to specific patient needs and improve treatment outcomes.
Key Drivers, Barriers & Challenges in Specialty Pharmaceuticals Market
Key Drivers: The rising prevalence of chronic diseases, an aging global population, technological advancements in drug development, and increasing healthcare expenditure are the key drivers accelerating market growth. Government initiatives promoting innovative drug development further propel market expansion.
Key Barriers and Challenges: High R&D costs, stringent regulatory hurdles, and the risk of generic competition and biosimilars pose significant challenges to market growth. Supply chain disruptions and pricing pressures further complicate the landscape.
Emerging Opportunities in Specialty Pharmaceuticals Market
Untapped markets in developing economies, the rising demand for personalized medicine, and innovative applications of artificial intelligence (AI) in drug discovery present substantial opportunities. Evolving consumer preferences towards convenient and effective therapies, coupled with advancements in gene therapy and immunotherapy, offer fertile ground for market expansion.
Growth Accelerators in the Specialty Pharmaceuticals Market Industry
Technological breakthroughs in areas like gene editing, immunotherapy, and AI-driven drug discovery are significantly accelerating market growth. Strategic partnerships between pharmaceutical companies and technology providers are enhancing innovation and market access. Expansion into emerging markets and the development of novel drug delivery systems further catalyze market expansion.
Key Players Shaping the Specialty Pharmaceuticals Market Market
- Pfizer
- Sanofi
- Novartis AG
- Amgen Inc
- Merck & Co Inc
- F Hoffmann-La Roche Ltd
- Johnson and Johnson
- Teva Pharmaceutical Industries Ltd
- Viatris
- AbbVie Inc
- Gilead Sciences Inc
- Bristol-Myers Squibb Company
Notable Milestones in Specialty Pharmaceuticals Market Sector
- March 2022: Intellia Therapeutics received FDA orphan drug designation for NTLA-5001 (AML treatment).
- February 2022: Optum launched Optum Specialty Fusion, a specialty medication management solution.
In-Depth Specialty Pharmaceuticals Market Market Outlook
The specialty pharmaceuticals market is poised for continued strong growth, driven by persistent technological advancements, strategic partnerships, and expansion into new markets. The focus on personalized medicine and innovative drug delivery systems will further enhance market potential. Strategic acquisitions and collaborations will shape the competitive landscape, fostering innovation and driving market expansion. The market presents substantial opportunities for companies investing in R&D and developing innovative therapies for unmet medical needs.
Specialty Pharmaceuticals Market Segmentation
-
1. Therapeutic Area
- 1.1. Oncology
- 1.2. Inflammatory Conditions
- 1.3. Multiple Sclerosis
- 1.4. Infectious Diseases
- 1.5. Others (Women's Health and Respiratory)
-
2. Route of Administration
- 2.1. Oral
- 2.2. Parenteral
- 2.3. Transdermal
-
3. Distribution Channel
- 3.1. Hospitals
- 3.2. Retail Pharmacies
- 3.3. Specialty Pharmacies
Specialty Pharmaceuticals Market Segmentation By Geography
-
1. North America
- 1.1. United States
- 1.2. Canada
- 1.3. Mexico
-
2. Europe
- 2.1. Germany
- 2.2. United Kingdom
- 2.3. France
- 2.4. Italy
- 2.5. Spain
- 2.6. Rest of Europe
-
3. Asia Pacific
- 3.1. China
- 3.2. Japan
- 3.3. India
- 3.4. Australia
- 3.5. South Korea
- 3.6. Rest of Asia Pacific
-
4. Middle East and Africa
- 4.1. GCC
- 4.2. South Africa
- 4.3. Rest of Middle East and Africa
-
5. South America
- 5.1. Brazil
- 5.2. Argentina
- 5.3. Rest of South America
Specialty Pharmaceuticals Market REPORT HIGHLIGHTS
| Aspects | Details |
|---|---|
| Study Period | 2019-2033 |
| Base Year | 2024 |
| Estimated Year | 2025 |
| Forecast Period | 2025-2033 |
| Historical Period | 2019-2024 |
| Growth Rate | CAGR of 35.40% from 2019-2033 |
| Segmentation |
|
Table of Contents
- 1. Introduction
- 1.1. Research Scope
- 1.2. Market Segmentation
- 1.3. Research Methodology
- 1.4. Definitions and Assumptions
- 2. Executive Summary
- 2.1. Introduction
- 3. Market Dynamics
- 3.1. Introduction
- 3.2. Market Drivers
- 3.2.1. Increasing Burden of Chronic and Rare Diseases; Growing Research and Development Activities
- 3.3. Market Restrains
- 3.3.1. High Cost of Drugs
- 3.4. Market Trends
- 3.4.1. Oncology Segment is Expected to Account for the Large Market Share Over the Forecast Period
- 4. Market Factor Analysis
- 4.1. Porters Five Forces
- 4.2. Supply/Value Chain
- 4.3. PESTEL analysis
- 4.4. Market Entropy
- 4.5. Patent/Trademark Analysis
- 5. Global Specialty Pharmaceuticals Market Analysis, Insights and Forecast, 2019-2031
- 5.1. Market Analysis, Insights and Forecast - by Therapeutic Area
- 5.1.1. Oncology
- 5.1.2. Inflammatory Conditions
- 5.1.3. Multiple Sclerosis
- 5.1.4. Infectious Diseases
- 5.1.5. Others (Women's Health and Respiratory)
- 5.2. Market Analysis, Insights and Forecast - by Route of Administration
- 5.2.1. Oral
- 5.2.2. Parenteral
- 5.2.3. Transdermal
- 5.3. Market Analysis, Insights and Forecast - by Distribution Channel
- 5.3.1. Hospitals
- 5.3.2. Retail Pharmacies
- 5.3.3. Specialty Pharmacies
- 5.4. Market Analysis, Insights and Forecast - by Region
- 5.4.1. North America
- 5.4.2. Europe
- 5.4.3. Asia Pacific
- 5.4.4. Middle East and Africa
- 5.4.5. South America
- 5.1. Market Analysis, Insights and Forecast - by Therapeutic Area
- 6. North America Specialty Pharmaceuticals Market Analysis, Insights and Forecast, 2019-2031
- 6.1. Market Analysis, Insights and Forecast - by Therapeutic Area
- 6.1.1. Oncology
- 6.1.2. Inflammatory Conditions
- 6.1.3. Multiple Sclerosis
- 6.1.4. Infectious Diseases
- 6.1.5. Others (Women's Health and Respiratory)
- 6.2. Market Analysis, Insights and Forecast - by Route of Administration
- 6.2.1. Oral
- 6.2.2. Parenteral
- 6.2.3. Transdermal
- 6.3. Market Analysis, Insights and Forecast - by Distribution Channel
- 6.3.1. Hospitals
- 6.3.2. Retail Pharmacies
- 6.3.3. Specialty Pharmacies
- 6.1. Market Analysis, Insights and Forecast - by Therapeutic Area
- 7. Europe Specialty Pharmaceuticals Market Analysis, Insights and Forecast, 2019-2031
- 7.1. Market Analysis, Insights and Forecast - by Therapeutic Area
- 7.1.1. Oncology
- 7.1.2. Inflammatory Conditions
- 7.1.3. Multiple Sclerosis
- 7.1.4. Infectious Diseases
- 7.1.5. Others (Women's Health and Respiratory)
- 7.2. Market Analysis, Insights and Forecast - by Route of Administration
- 7.2.1. Oral
- 7.2.2. Parenteral
- 7.2.3. Transdermal
- 7.3. Market Analysis, Insights and Forecast - by Distribution Channel
- 7.3.1. Hospitals
- 7.3.2. Retail Pharmacies
- 7.3.3. Specialty Pharmacies
- 7.1. Market Analysis, Insights and Forecast - by Therapeutic Area
- 8. Asia Pacific Specialty Pharmaceuticals Market Analysis, Insights and Forecast, 2019-2031
- 8.1. Market Analysis, Insights and Forecast - by Therapeutic Area
- 8.1.1. Oncology
- 8.1.2. Inflammatory Conditions
- 8.1.3. Multiple Sclerosis
- 8.1.4. Infectious Diseases
- 8.1.5. Others (Women's Health and Respiratory)
- 8.2. Market Analysis, Insights and Forecast - by Route of Administration
- 8.2.1. Oral
- 8.2.2. Parenteral
- 8.2.3. Transdermal
- 8.3. Market Analysis, Insights and Forecast - by Distribution Channel
- 8.3.1. Hospitals
- 8.3.2. Retail Pharmacies
- 8.3.3. Specialty Pharmacies
- 8.1. Market Analysis, Insights and Forecast - by Therapeutic Area
- 9. Middle East and Africa Specialty Pharmaceuticals Market Analysis, Insights and Forecast, 2019-2031
- 9.1. Market Analysis, Insights and Forecast - by Therapeutic Area
- 9.1.1. Oncology
- 9.1.2. Inflammatory Conditions
- 9.1.3. Multiple Sclerosis
- 9.1.4. Infectious Diseases
- 9.1.5. Others (Women's Health and Respiratory)
- 9.2. Market Analysis, Insights and Forecast - by Route of Administration
- 9.2.1. Oral
- 9.2.2. Parenteral
- 9.2.3. Transdermal
- 9.3. Market Analysis, Insights and Forecast - by Distribution Channel
- 9.3.1. Hospitals
- 9.3.2. Retail Pharmacies
- 9.3.3. Specialty Pharmacies
- 9.1. Market Analysis, Insights and Forecast - by Therapeutic Area
- 10. South America Specialty Pharmaceuticals Market Analysis, Insights and Forecast, 2019-2031
- 10.1. Market Analysis, Insights and Forecast - by Therapeutic Area
- 10.1.1. Oncology
- 10.1.2. Inflammatory Conditions
- 10.1.3. Multiple Sclerosis
- 10.1.4. Infectious Diseases
- 10.1.5. Others (Women's Health and Respiratory)
- 10.2. Market Analysis, Insights and Forecast - by Route of Administration
- 10.2.1. Oral
- 10.2.2. Parenteral
- 10.2.3. Transdermal
- 10.3. Market Analysis, Insights and Forecast - by Distribution Channel
- 10.3.1. Hospitals
- 10.3.2. Retail Pharmacies
- 10.3.3. Specialty Pharmacies
- 10.1. Market Analysis, Insights and Forecast - by Therapeutic Area
- 11. North America Specialty Pharmaceuticals Market Analysis, Insights and Forecast, 2019-2031
- 11.1. Market Analysis, Insights and Forecast - By Country/Sub-region
- 11.1.1 United States
- 11.1.2 Canada
- 11.1.3 Mexico
- 12. Europe Specialty Pharmaceuticals Market Analysis, Insights and Forecast, 2019-2031
- 12.1. Market Analysis, Insights and Forecast - By Country/Sub-region
- 12.1.1 Germany
- 12.1.2 United Kingdom
- 12.1.3 France
- 12.1.4 Italy
- 12.1.5 Spain
- 12.1.6 Rest of Europe
- 13. Asia Pacific Specialty Pharmaceuticals Market Analysis, Insights and Forecast, 2019-2031
- 13.1. Market Analysis, Insights and Forecast - By Country/Sub-region
- 13.1.1 China
- 13.1.2 Japan
- 13.1.3 India
- 13.1.4 Australia
- 13.1.5 South Korea
- 13.1.6 Rest of Asia Pacific
- 14. Middle East and Africa Specialty Pharmaceuticals Market Analysis, Insights and Forecast, 2019-2031
- 14.1. Market Analysis, Insights and Forecast - By Country/Sub-region
- 14.1.1 GCC
- 14.1.2 South Africa
- 14.1.3 Rest of Middle East and Africa
- 15. South America Specialty Pharmaceuticals Market Analysis, Insights and Forecast, 2019-2031
- 15.1. Market Analysis, Insights and Forecast - By Country/Sub-region
- 15.1.1 Brazil
- 15.1.2 Argentina
- 15.1.3 Rest of South America
- 16. Competitive Analysis
- 16.1. Global Market Share Analysis 2024
- 16.2. Company Profiles
- 16.2.1 Pfizer
- 16.2.1.1. Overview
- 16.2.1.2. Products
- 16.2.1.3. SWOT Analysis
- 16.2.1.4. Recent Developments
- 16.2.1.5. Financials (Based on Availability)
- 16.2.2 Sanofi
- 16.2.2.1. Overview
- 16.2.2.2. Products
- 16.2.2.3. SWOT Analysis
- 16.2.2.4. Recent Developments
- 16.2.2.5. Financials (Based on Availability)
- 16.2.3 Novartis AG
- 16.2.3.1. Overview
- 16.2.3.2. Products
- 16.2.3.3. SWOT Analysis
- 16.2.3.4. Recent Developments
- 16.2.3.5. Financials (Based on Availability)
- 16.2.4 Amgen Inc
- 16.2.4.1. Overview
- 16.2.4.2. Products
- 16.2.4.3. SWOT Analysis
- 16.2.4.4. Recent Developments
- 16.2.4.5. Financials (Based on Availability)
- 16.2.5 Merck & Co Inc
- 16.2.5.1. Overview
- 16.2.5.2. Products
- 16.2.5.3. SWOT Analysis
- 16.2.5.4. Recent Developments
- 16.2.5.5. Financials (Based on Availability)
- 16.2.6 F Hoffmann-La Roche Ltd
- 16.2.6.1. Overview
- 16.2.6.2. Products
- 16.2.6.3. SWOT Analysis
- 16.2.6.4. Recent Developments
- 16.2.6.5. Financials (Based on Availability)
- 16.2.7 Johnson and Johnson
- 16.2.7.1. Overview
- 16.2.7.2. Products
- 16.2.7.3. SWOT Analysis
- 16.2.7.4. Recent Developments
- 16.2.7.5. Financials (Based on Availability)
- 16.2.8 Teva Pharmaceutical Industries Ltd
- 16.2.8.1. Overview
- 16.2.8.2. Products
- 16.2.8.3. SWOT Analysis
- 16.2.8.4. Recent Developments
- 16.2.8.5. Financials (Based on Availability)
- 16.2.9 Viatris
- 16.2.9.1. Overview
- 16.2.9.2. Products
- 16.2.9.3. SWOT Analysis
- 16.2.9.4. Recent Developments
- 16.2.9.5. Financials (Based on Availability)
- 16.2.10 AbbVie Inc
- 16.2.10.1. Overview
- 16.2.10.2. Products
- 16.2.10.3. SWOT Analysis
- 16.2.10.4. Recent Developments
- 16.2.10.5. Financials (Based on Availability)
- 16.2.11 Gilead Sciences Inc
- 16.2.11.1. Overview
- 16.2.11.2. Products
- 16.2.11.3. SWOT Analysis
- 16.2.11.4. Recent Developments
- 16.2.11.5. Financials (Based on Availability)
- 16.2.12 Bristol-Myers Squibb Company
- 16.2.12.1. Overview
- 16.2.12.2. Products
- 16.2.12.3. SWOT Analysis
- 16.2.12.4. Recent Developments
- 16.2.12.5. Financials (Based on Availability)
- 16.2.1 Pfizer
List of Figures
- Figure 1: Global Specialty Pharmaceuticals Market Revenue Breakdown (Million, %) by Region 2024 & 2032
- Figure 2: Global Specialty Pharmaceuticals Market Volume Breakdown (K Unit, %) by Region 2024 & 2032
- Figure 3: North America Specialty Pharmaceuticals Market Revenue (Million), by Country 2024 & 2032
- Figure 4: North America Specialty Pharmaceuticals Market Volume (K Unit), by Country 2024 & 2032
- Figure 5: North America Specialty Pharmaceuticals Market Revenue Share (%), by Country 2024 & 2032
- Figure 6: North America Specialty Pharmaceuticals Market Volume Share (%), by Country 2024 & 2032
- Figure 7: Europe Specialty Pharmaceuticals Market Revenue (Million), by Country 2024 & 2032
- Figure 8: Europe Specialty Pharmaceuticals Market Volume (K Unit), by Country 2024 & 2032
- Figure 9: Europe Specialty Pharmaceuticals Market Revenue Share (%), by Country 2024 & 2032
- Figure 10: Europe Specialty Pharmaceuticals Market Volume Share (%), by Country 2024 & 2032
- Figure 11: Asia Pacific Specialty Pharmaceuticals Market Revenue (Million), by Country 2024 & 2032
- Figure 12: Asia Pacific Specialty Pharmaceuticals Market Volume (K Unit), by Country 2024 & 2032
- Figure 13: Asia Pacific Specialty Pharmaceuticals Market Revenue Share (%), by Country 2024 & 2032
- Figure 14: Asia Pacific Specialty Pharmaceuticals Market Volume Share (%), by Country 2024 & 2032
- Figure 15: Middle East and Africa Specialty Pharmaceuticals Market Revenue (Million), by Country 2024 & 2032
- Figure 16: Middle East and Africa Specialty Pharmaceuticals Market Volume (K Unit), by Country 2024 & 2032
- Figure 17: Middle East and Africa Specialty Pharmaceuticals Market Revenue Share (%), by Country 2024 & 2032
- Figure 18: Middle East and Africa Specialty Pharmaceuticals Market Volume Share (%), by Country 2024 & 2032
- Figure 19: South America Specialty Pharmaceuticals Market Revenue (Million), by Country 2024 & 2032
- Figure 20: South America Specialty Pharmaceuticals Market Volume (K Unit), by Country 2024 & 2032
- Figure 21: South America Specialty Pharmaceuticals Market Revenue Share (%), by Country 2024 & 2032
- Figure 22: South America Specialty Pharmaceuticals Market Volume Share (%), by Country 2024 & 2032
- Figure 23: North America Specialty Pharmaceuticals Market Revenue (Million), by Therapeutic Area 2024 & 2032
- Figure 24: North America Specialty Pharmaceuticals Market Volume (K Unit), by Therapeutic Area 2024 & 2032
- Figure 25: North America Specialty Pharmaceuticals Market Revenue Share (%), by Therapeutic Area 2024 & 2032
- Figure 26: North America Specialty Pharmaceuticals Market Volume Share (%), by Therapeutic Area 2024 & 2032
- Figure 27: North America Specialty Pharmaceuticals Market Revenue (Million), by Route of Administration 2024 & 2032
- Figure 28: North America Specialty Pharmaceuticals Market Volume (K Unit), by Route of Administration 2024 & 2032
- Figure 29: North America Specialty Pharmaceuticals Market Revenue Share (%), by Route of Administration 2024 & 2032
- Figure 30: North America Specialty Pharmaceuticals Market Volume Share (%), by Route of Administration 2024 & 2032
- Figure 31: North America Specialty Pharmaceuticals Market Revenue (Million), by Distribution Channel 2024 & 2032
- Figure 32: North America Specialty Pharmaceuticals Market Volume (K Unit), by Distribution Channel 2024 & 2032
- Figure 33: North America Specialty Pharmaceuticals Market Revenue Share (%), by Distribution Channel 2024 & 2032
- Figure 34: North America Specialty Pharmaceuticals Market Volume Share (%), by Distribution Channel 2024 & 2032
- Figure 35: North America Specialty Pharmaceuticals Market Revenue (Million), by Country 2024 & 2032
- Figure 36: North America Specialty Pharmaceuticals Market Volume (K Unit), by Country 2024 & 2032
- Figure 37: North America Specialty Pharmaceuticals Market Revenue Share (%), by Country 2024 & 2032
- Figure 38: North America Specialty Pharmaceuticals Market Volume Share (%), by Country 2024 & 2032
- Figure 39: Europe Specialty Pharmaceuticals Market Revenue (Million), by Therapeutic Area 2024 & 2032
- Figure 40: Europe Specialty Pharmaceuticals Market Volume (K Unit), by Therapeutic Area 2024 & 2032
- Figure 41: Europe Specialty Pharmaceuticals Market Revenue Share (%), by Therapeutic Area 2024 & 2032
- Figure 42: Europe Specialty Pharmaceuticals Market Volume Share (%), by Therapeutic Area 2024 & 2032
- Figure 43: Europe Specialty Pharmaceuticals Market Revenue (Million), by Route of Administration 2024 & 2032
- Figure 44: Europe Specialty Pharmaceuticals Market Volume (K Unit), by Route of Administration 2024 & 2032
- Figure 45: Europe Specialty Pharmaceuticals Market Revenue Share (%), by Route of Administration 2024 & 2032
- Figure 46: Europe Specialty Pharmaceuticals Market Volume Share (%), by Route of Administration 2024 & 2032
- Figure 47: Europe Specialty Pharmaceuticals Market Revenue (Million), by Distribution Channel 2024 & 2032
- Figure 48: Europe Specialty Pharmaceuticals Market Volume (K Unit), by Distribution Channel 2024 & 2032
- Figure 49: Europe Specialty Pharmaceuticals Market Revenue Share (%), by Distribution Channel 2024 & 2032
- Figure 50: Europe Specialty Pharmaceuticals Market Volume Share (%), by Distribution Channel 2024 & 2032
- Figure 51: Europe Specialty Pharmaceuticals Market Revenue (Million), by Country 2024 & 2032
- Figure 52: Europe Specialty Pharmaceuticals Market Volume (K Unit), by Country 2024 & 2032
- Figure 53: Europe Specialty Pharmaceuticals Market Revenue Share (%), by Country 2024 & 2032
- Figure 54: Europe Specialty Pharmaceuticals Market Volume Share (%), by Country 2024 & 2032
- Figure 55: Asia Pacific Specialty Pharmaceuticals Market Revenue (Million), by Therapeutic Area 2024 & 2032
- Figure 56: Asia Pacific Specialty Pharmaceuticals Market Volume (K Unit), by Therapeutic Area 2024 & 2032
- Figure 57: Asia Pacific Specialty Pharmaceuticals Market Revenue Share (%), by Therapeutic Area 2024 & 2032
- Figure 58: Asia Pacific Specialty Pharmaceuticals Market Volume Share (%), by Therapeutic Area 2024 & 2032
- Figure 59: Asia Pacific Specialty Pharmaceuticals Market Revenue (Million), by Route of Administration 2024 & 2032
- Figure 60: Asia Pacific Specialty Pharmaceuticals Market Volume (K Unit), by Route of Administration 2024 & 2032
- Figure 61: Asia Pacific Specialty Pharmaceuticals Market Revenue Share (%), by Route of Administration 2024 & 2032
- Figure 62: Asia Pacific Specialty Pharmaceuticals Market Volume Share (%), by Route of Administration 2024 & 2032
- Figure 63: Asia Pacific Specialty Pharmaceuticals Market Revenue (Million), by Distribution Channel 2024 & 2032
- Figure 64: Asia Pacific Specialty Pharmaceuticals Market Volume (K Unit), by Distribution Channel 2024 & 2032
- Figure 65: Asia Pacific Specialty Pharmaceuticals Market Revenue Share (%), by Distribution Channel 2024 & 2032
- Figure 66: Asia Pacific Specialty Pharmaceuticals Market Volume Share (%), by Distribution Channel 2024 & 2032
- Figure 67: Asia Pacific Specialty Pharmaceuticals Market Revenue (Million), by Country 2024 & 2032
- Figure 68: Asia Pacific Specialty Pharmaceuticals Market Volume (K Unit), by Country 2024 & 2032
- Figure 69: Asia Pacific Specialty Pharmaceuticals Market Revenue Share (%), by Country 2024 & 2032
- Figure 70: Asia Pacific Specialty Pharmaceuticals Market Volume Share (%), by Country 2024 & 2032
- Figure 71: Middle East and Africa Specialty Pharmaceuticals Market Revenue (Million), by Therapeutic Area 2024 & 2032
- Figure 72: Middle East and Africa Specialty Pharmaceuticals Market Volume (K Unit), by Therapeutic Area 2024 & 2032
- Figure 73: Middle East and Africa Specialty Pharmaceuticals Market Revenue Share (%), by Therapeutic Area 2024 & 2032
- Figure 74: Middle East and Africa Specialty Pharmaceuticals Market Volume Share (%), by Therapeutic Area 2024 & 2032
- Figure 75: Middle East and Africa Specialty Pharmaceuticals Market Revenue (Million), by Route of Administration 2024 & 2032
- Figure 76: Middle East and Africa Specialty Pharmaceuticals Market Volume (K Unit), by Route of Administration 2024 & 2032
- Figure 77: Middle East and Africa Specialty Pharmaceuticals Market Revenue Share (%), by Route of Administration 2024 & 2032
- Figure 78: Middle East and Africa Specialty Pharmaceuticals Market Volume Share (%), by Route of Administration 2024 & 2032
- Figure 79: Middle East and Africa Specialty Pharmaceuticals Market Revenue (Million), by Distribution Channel 2024 & 2032
- Figure 80: Middle East and Africa Specialty Pharmaceuticals Market Volume (K Unit), by Distribution Channel 2024 & 2032
- Figure 81: Middle East and Africa Specialty Pharmaceuticals Market Revenue Share (%), by Distribution Channel 2024 & 2032
- Figure 82: Middle East and Africa Specialty Pharmaceuticals Market Volume Share (%), by Distribution Channel 2024 & 2032
- Figure 83: Middle East and Africa Specialty Pharmaceuticals Market Revenue (Million), by Country 2024 & 2032
- Figure 84: Middle East and Africa Specialty Pharmaceuticals Market Volume (K Unit), by Country 2024 & 2032
- Figure 85: Middle East and Africa Specialty Pharmaceuticals Market Revenue Share (%), by Country 2024 & 2032
- Figure 86: Middle East and Africa Specialty Pharmaceuticals Market Volume Share (%), by Country 2024 & 2032
- Figure 87: South America Specialty Pharmaceuticals Market Revenue (Million), by Therapeutic Area 2024 & 2032
- Figure 88: South America Specialty Pharmaceuticals Market Volume (K Unit), by Therapeutic Area 2024 & 2032
- Figure 89: South America Specialty Pharmaceuticals Market Revenue Share (%), by Therapeutic Area 2024 & 2032
- Figure 90: South America Specialty Pharmaceuticals Market Volume Share (%), by Therapeutic Area 2024 & 2032
- Figure 91: South America Specialty Pharmaceuticals Market Revenue (Million), by Route of Administration 2024 & 2032
- Figure 92: South America Specialty Pharmaceuticals Market Volume (K Unit), by Route of Administration 2024 & 2032
- Figure 93: South America Specialty Pharmaceuticals Market Revenue Share (%), by Route of Administration 2024 & 2032
- Figure 94: South America Specialty Pharmaceuticals Market Volume Share (%), by Route of Administration 2024 & 2032
- Figure 95: South America Specialty Pharmaceuticals Market Revenue (Million), by Distribution Channel 2024 & 2032
- Figure 96: South America Specialty Pharmaceuticals Market Volume (K Unit), by Distribution Channel 2024 & 2032
- Figure 97: South America Specialty Pharmaceuticals Market Revenue Share (%), by Distribution Channel 2024 & 2032
- Figure 98: South America Specialty Pharmaceuticals Market Volume Share (%), by Distribution Channel 2024 & 2032
- Figure 99: South America Specialty Pharmaceuticals Market Revenue (Million), by Country 2024 & 2032
- Figure 100: South America Specialty Pharmaceuticals Market Volume (K Unit), by Country 2024 & 2032
- Figure 101: South America Specialty Pharmaceuticals Market Revenue Share (%), by Country 2024 & 2032
- Figure 102: South America Specialty Pharmaceuticals Market Volume Share (%), by Country 2024 & 2032
List of Tables
- Table 1: Global Specialty Pharmaceuticals Market Revenue Million Forecast, by Region 2019 & 2032
- Table 2: Global Specialty Pharmaceuticals Market Volume K Unit Forecast, by Region 2019 & 2032
- Table 3: Global Specialty Pharmaceuticals Market Revenue Million Forecast, by Therapeutic Area 2019 & 2032
- Table 4: Global Specialty Pharmaceuticals Market Volume K Unit Forecast, by Therapeutic Area 2019 & 2032
- Table 5: Global Specialty Pharmaceuticals Market Revenue Million Forecast, by Route of Administration 2019 & 2032
- Table 6: Global Specialty Pharmaceuticals Market Volume K Unit Forecast, by Route of Administration 2019 & 2032
- Table 7: Global Specialty Pharmaceuticals Market Revenue Million Forecast, by Distribution Channel 2019 & 2032
- Table 8: Global Specialty Pharmaceuticals Market Volume K Unit Forecast, by Distribution Channel 2019 & 2032
- Table 9: Global Specialty Pharmaceuticals Market Revenue Million Forecast, by Region 2019 & 2032
- Table 10: Global Specialty Pharmaceuticals Market Volume K Unit Forecast, by Region 2019 & 2032
- Table 11: Global Specialty Pharmaceuticals Market Revenue Million Forecast, by Country 2019 & 2032
- Table 12: Global Specialty Pharmaceuticals Market Volume K Unit Forecast, by Country 2019 & 2032
- Table 13: United States Specialty Pharmaceuticals Market Revenue (Million) Forecast, by Application 2019 & 2032
- Table 14: United States Specialty Pharmaceuticals Market Volume (K Unit) Forecast, by Application 2019 & 2032
- Table 15: Canada Specialty Pharmaceuticals Market Revenue (Million) Forecast, by Application 2019 & 2032
- Table 16: Canada Specialty Pharmaceuticals Market Volume (K Unit) Forecast, by Application 2019 & 2032
- Table 17: Mexico Specialty Pharmaceuticals Market Revenue (Million) Forecast, by Application 2019 & 2032
- Table 18: Mexico Specialty Pharmaceuticals Market Volume (K Unit) Forecast, by Application 2019 & 2032
- Table 19: Global Specialty Pharmaceuticals Market Revenue Million Forecast, by Country 2019 & 2032
- Table 20: Global Specialty Pharmaceuticals Market Volume K Unit Forecast, by Country 2019 & 2032
- Table 21: Germany Specialty Pharmaceuticals Market Revenue (Million) Forecast, by Application 2019 & 2032
- Table 22: Germany Specialty Pharmaceuticals Market Volume (K Unit) Forecast, by Application 2019 & 2032
- Table 23: United Kingdom Specialty Pharmaceuticals Market Revenue (Million) Forecast, by Application 2019 & 2032
- Table 24: United Kingdom Specialty Pharmaceuticals Market Volume (K Unit) Forecast, by Application 2019 & 2032
- Table 25: France Specialty Pharmaceuticals Market Revenue (Million) Forecast, by Application 2019 & 2032
- Table 26: France Specialty Pharmaceuticals Market Volume (K Unit) Forecast, by Application 2019 & 2032
- Table 27: Italy Specialty Pharmaceuticals Market Revenue (Million) Forecast, by Application 2019 & 2032
- Table 28: Italy Specialty Pharmaceuticals Market Volume (K Unit) Forecast, by Application 2019 & 2032
- Table 29: Spain Specialty Pharmaceuticals Market Revenue (Million) Forecast, by Application 2019 & 2032
- Table 30: Spain Specialty Pharmaceuticals Market Volume (K Unit) Forecast, by Application 2019 & 2032
- Table 31: Rest of Europe Specialty Pharmaceuticals Market Revenue (Million) Forecast, by Application 2019 & 2032
- Table 32: Rest of Europe Specialty Pharmaceuticals Market Volume (K Unit) Forecast, by Application 2019 & 2032
- Table 33: Global Specialty Pharmaceuticals Market Revenue Million Forecast, by Country 2019 & 2032
- Table 34: Global Specialty Pharmaceuticals Market Volume K Unit Forecast, by Country 2019 & 2032
- Table 35: China Specialty Pharmaceuticals Market Revenue (Million) Forecast, by Application 2019 & 2032
- Table 36: China Specialty Pharmaceuticals Market Volume (K Unit) Forecast, by Application 2019 & 2032
- Table 37: Japan Specialty Pharmaceuticals Market Revenue (Million) Forecast, by Application 2019 & 2032
- Table 38: Japan Specialty Pharmaceuticals Market Volume (K Unit) Forecast, by Application 2019 & 2032
- Table 39: India Specialty Pharmaceuticals Market Revenue (Million) Forecast, by Application 2019 & 2032
- Table 40: India Specialty Pharmaceuticals Market Volume (K Unit) Forecast, by Application 2019 & 2032
- Table 41: Australia Specialty Pharmaceuticals Market Revenue (Million) Forecast, by Application 2019 & 2032
- Table 42: Australia Specialty Pharmaceuticals Market Volume (K Unit) Forecast, by Application 2019 & 2032
- Table 43: South Korea Specialty Pharmaceuticals Market Revenue (Million) Forecast, by Application 2019 & 2032
- Table 44: South Korea Specialty Pharmaceuticals Market Volume (K Unit) Forecast, by Application 2019 & 2032
- Table 45: Rest of Asia Pacific Specialty Pharmaceuticals Market Revenue (Million) Forecast, by Application 2019 & 2032
- Table 46: Rest of Asia Pacific Specialty Pharmaceuticals Market Volume (K Unit) Forecast, by Application 2019 & 2032
- Table 47: Global Specialty Pharmaceuticals Market Revenue Million Forecast, by Country 2019 & 2032
- Table 48: Global Specialty Pharmaceuticals Market Volume K Unit Forecast, by Country 2019 & 2032
- Table 49: GCC Specialty Pharmaceuticals Market Revenue (Million) Forecast, by Application 2019 & 2032
- Table 50: GCC Specialty Pharmaceuticals Market Volume (K Unit) Forecast, by Application 2019 & 2032
- Table 51: South Africa Specialty Pharmaceuticals Market Revenue (Million) Forecast, by Application 2019 & 2032
- Table 52: South Africa Specialty Pharmaceuticals Market Volume (K Unit) Forecast, by Application 2019 & 2032
- Table 53: Rest of Middle East and Africa Specialty Pharmaceuticals Market Revenue (Million) Forecast, by Application 2019 & 2032
- Table 54: Rest of Middle East and Africa Specialty Pharmaceuticals Market Volume (K Unit) Forecast, by Application 2019 & 2032
- Table 55: Global Specialty Pharmaceuticals Market Revenue Million Forecast, by Country 2019 & 2032
- Table 56: Global Specialty Pharmaceuticals Market Volume K Unit Forecast, by Country 2019 & 2032
- Table 57: Brazil Specialty Pharmaceuticals Market Revenue (Million) Forecast, by Application 2019 & 2032
- Table 58: Brazil Specialty Pharmaceuticals Market Volume (K Unit) Forecast, by Application 2019 & 2032
- Table 59: Argentina Specialty Pharmaceuticals Market Revenue (Million) Forecast, by Application 2019 & 2032
- Table 60: Argentina Specialty Pharmaceuticals Market Volume (K Unit) Forecast, by Application 2019 & 2032
- Table 61: Rest of South America Specialty Pharmaceuticals Market Revenue (Million) Forecast, by Application 2019 & 2032
- Table 62: Rest of South America Specialty Pharmaceuticals Market Volume (K Unit) Forecast, by Application 2019 & 2032
- Table 63: Global Specialty Pharmaceuticals Market Revenue Million Forecast, by Therapeutic Area 2019 & 2032
- Table 64: Global Specialty Pharmaceuticals Market Volume K Unit Forecast, by Therapeutic Area 2019 & 2032
- Table 65: Global Specialty Pharmaceuticals Market Revenue Million Forecast, by Route of Administration 2019 & 2032
- Table 66: Global Specialty Pharmaceuticals Market Volume K Unit Forecast, by Route of Administration 2019 & 2032
- Table 67: Global Specialty Pharmaceuticals Market Revenue Million Forecast, by Distribution Channel 2019 & 2032
- Table 68: Global Specialty Pharmaceuticals Market Volume K Unit Forecast, by Distribution Channel 2019 & 2032
- Table 69: Global Specialty Pharmaceuticals Market Revenue Million Forecast, by Country 2019 & 2032
- Table 70: Global Specialty Pharmaceuticals Market Volume K Unit Forecast, by Country 2019 & 2032
- Table 71: United States Specialty Pharmaceuticals Market Revenue (Million) Forecast, by Application 2019 & 2032
- Table 72: United States Specialty Pharmaceuticals Market Volume (K Unit) Forecast, by Application 2019 & 2032
- Table 73: Canada Specialty Pharmaceuticals Market Revenue (Million) Forecast, by Application 2019 & 2032
- Table 74: Canada Specialty Pharmaceuticals Market Volume (K Unit) Forecast, by Application 2019 & 2032
- Table 75: Mexico Specialty Pharmaceuticals Market Revenue (Million) Forecast, by Application 2019 & 2032
- Table 76: Mexico Specialty Pharmaceuticals Market Volume (K Unit) Forecast, by Application 2019 & 2032
- Table 77: Global Specialty Pharmaceuticals Market Revenue Million Forecast, by Therapeutic Area 2019 & 2032
- Table 78: Global Specialty Pharmaceuticals Market Volume K Unit Forecast, by Therapeutic Area 2019 & 2032
- Table 79: Global Specialty Pharmaceuticals Market Revenue Million Forecast, by Route of Administration 2019 & 2032
- Table 80: Global Specialty Pharmaceuticals Market Volume K Unit Forecast, by Route of Administration 2019 & 2032
- Table 81: Global Specialty Pharmaceuticals Market Revenue Million Forecast, by Distribution Channel 2019 & 2032
- Table 82: Global Specialty Pharmaceuticals Market Volume K Unit Forecast, by Distribution Channel 2019 & 2032
- Table 83: Global Specialty Pharmaceuticals Market Revenue Million Forecast, by Country 2019 & 2032
- Table 84: Global Specialty Pharmaceuticals Market Volume K Unit Forecast, by Country 2019 & 2032
- Table 85: Germany Specialty Pharmaceuticals Market Revenue (Million) Forecast, by Application 2019 & 2032
- Table 86: Germany Specialty Pharmaceuticals Market Volume (K Unit) Forecast, by Application 2019 & 2032
- Table 87: United Kingdom Specialty Pharmaceuticals Market Revenue (Million) Forecast, by Application 2019 & 2032
- Table 88: United Kingdom Specialty Pharmaceuticals Market Volume (K Unit) Forecast, by Application 2019 & 2032
- Table 89: France Specialty Pharmaceuticals Market Revenue (Million) Forecast, by Application 2019 & 2032
- Table 90: France Specialty Pharmaceuticals Market Volume (K Unit) Forecast, by Application 2019 & 2032
- Table 91: Italy Specialty Pharmaceuticals Market Revenue (Million) Forecast, by Application 2019 & 2032
- Table 92: Italy Specialty Pharmaceuticals Market Volume (K Unit) Forecast, by Application 2019 & 2032
- Table 93: Spain Specialty Pharmaceuticals Market Revenue (Million) Forecast, by Application 2019 & 2032
- Table 94: Spain Specialty Pharmaceuticals Market Volume (K Unit) Forecast, by Application 2019 & 2032
- Table 95: Rest of Europe Specialty Pharmaceuticals Market Revenue (Million) Forecast, by Application 2019 & 2032
- Table 96: Rest of Europe Specialty Pharmaceuticals Market Volume (K Unit) Forecast, by Application 2019 & 2032
- Table 97: Global Specialty Pharmaceuticals Market Revenue Million Forecast, by Therapeutic Area 2019 & 2032
- Table 98: Global Specialty Pharmaceuticals Market Volume K Unit Forecast, by Therapeutic Area 2019 & 2032
- Table 99: Global Specialty Pharmaceuticals Market Revenue Million Forecast, by Route of Administration 2019 & 2032
- Table 100: Global Specialty Pharmaceuticals Market Volume K Unit Forecast, by Route of Administration 2019 & 2032
- Table 101: Global Specialty Pharmaceuticals Market Revenue Million Forecast, by Distribution Channel 2019 & 2032
- Table 102: Global Specialty Pharmaceuticals Market Volume K Unit Forecast, by Distribution Channel 2019 & 2032
- Table 103: Global Specialty Pharmaceuticals Market Revenue Million Forecast, by Country 2019 & 2032
- Table 104: Global Specialty Pharmaceuticals Market Volume K Unit Forecast, by Country 2019 & 2032
- Table 105: China Specialty Pharmaceuticals Market Revenue (Million) Forecast, by Application 2019 & 2032
- Table 106: China Specialty Pharmaceuticals Market Volume (K Unit) Forecast, by Application 2019 & 2032
- Table 107: Japan Specialty Pharmaceuticals Market Revenue (Million) Forecast, by Application 2019 & 2032
- Table 108: Japan Specialty Pharmaceuticals Market Volume (K Unit) Forecast, by Application 2019 & 2032
- Table 109: India Specialty Pharmaceuticals Market Revenue (Million) Forecast, by Application 2019 & 2032
- Table 110: India Specialty Pharmaceuticals Market Volume (K Unit) Forecast, by Application 2019 & 2032
- Table 111: Australia Specialty Pharmaceuticals Market Revenue (Million) Forecast, by Application 2019 & 2032
- Table 112: Australia Specialty Pharmaceuticals Market Volume (K Unit) Forecast, by Application 2019 & 2032
- Table 113: South Korea Specialty Pharmaceuticals Market Revenue (Million) Forecast, by Application 2019 & 2032
- Table 114: South Korea Specialty Pharmaceuticals Market Volume (K Unit) Forecast, by Application 2019 & 2032
- Table 115: Rest of Asia Pacific Specialty Pharmaceuticals Market Revenue (Million) Forecast, by Application 2019 & 2032
- Table 116: Rest of Asia Pacific Specialty Pharmaceuticals Market Volume (K Unit) Forecast, by Application 2019 & 2032
- Table 117: Global Specialty Pharmaceuticals Market Revenue Million Forecast, by Therapeutic Area 2019 & 2032
- Table 118: Global Specialty Pharmaceuticals Market Volume K Unit Forecast, by Therapeutic Area 2019 & 2032
- Table 119: Global Specialty Pharmaceuticals Market Revenue Million Forecast, by Route of Administration 2019 & 2032
- Table 120: Global Specialty Pharmaceuticals Market Volume K Unit Forecast, by Route of Administration 2019 & 2032
- Table 121: Global Specialty Pharmaceuticals Market Revenue Million Forecast, by Distribution Channel 2019 & 2032
- Table 122: Global Specialty Pharmaceuticals Market Volume K Unit Forecast, by Distribution Channel 2019 & 2032
- Table 123: Global Specialty Pharmaceuticals Market Revenue Million Forecast, by Country 2019 & 2032
- Table 124: Global Specialty Pharmaceuticals Market Volume K Unit Forecast, by Country 2019 & 2032
- Table 125: GCC Specialty Pharmaceuticals Market Revenue (Million) Forecast, by Application 2019 & 2032
- Table 126: GCC Specialty Pharmaceuticals Market Volume (K Unit) Forecast, by Application 2019 & 2032
- Table 127: South Africa Specialty Pharmaceuticals Market Revenue (Million) Forecast, by Application 2019 & 2032
- Table 128: South Africa Specialty Pharmaceuticals Market Volume (K Unit) Forecast, by Application 2019 & 2032
- Table 129: Rest of Middle East and Africa Specialty Pharmaceuticals Market Revenue (Million) Forecast, by Application 2019 & 2032
- Table 130: Rest of Middle East and Africa Specialty Pharmaceuticals Market Volume (K Unit) Forecast, by Application 2019 & 2032
- Table 131: Global Specialty Pharmaceuticals Market Revenue Million Forecast, by Therapeutic Area 2019 & 2032
- Table 132: Global Specialty Pharmaceuticals Market Volume K Unit Forecast, by Therapeutic Area 2019 & 2032
- Table 133: Global Specialty Pharmaceuticals Market Revenue Million Forecast, by Route of Administration 2019 & 2032
- Table 134: Global Specialty Pharmaceuticals Market Volume K Unit Forecast, by Route of Administration 2019 & 2032
- Table 135: Global Specialty Pharmaceuticals Market Revenue Million Forecast, by Distribution Channel 2019 & 2032
- Table 136: Global Specialty Pharmaceuticals Market Volume K Unit Forecast, by Distribution Channel 2019 & 2032
- Table 137: Global Specialty Pharmaceuticals Market Revenue Million Forecast, by Country 2019 & 2032
- Table 138: Global Specialty Pharmaceuticals Market Volume K Unit Forecast, by Country 2019 & 2032
- Table 139: Brazil Specialty Pharmaceuticals Market Revenue (Million) Forecast, by Application 2019 & 2032
- Table 140: Brazil Specialty Pharmaceuticals Market Volume (K Unit) Forecast, by Application 2019 & 2032
- Table 141: Argentina Specialty Pharmaceuticals Market Revenue (Million) Forecast, by Application 2019 & 2032
- Table 142: Argentina Specialty Pharmaceuticals Market Volume (K Unit) Forecast, by Application 2019 & 2032
- Table 143: Rest of South America Specialty Pharmaceuticals Market Revenue (Million) Forecast, by Application 2019 & 2032
- Table 144: Rest of South America Specialty Pharmaceuticals Market Volume (K Unit) Forecast, by Application 2019 & 2032
Frequently Asked Questions
1. What is the projected Compound Annual Growth Rate (CAGR) of the Specialty Pharmaceuticals Market?
The projected CAGR is approximately 35.40%.
2. Which companies are prominent players in the Specialty Pharmaceuticals Market?
Key companies in the market include Pfizer, Sanofi, Novartis AG, Amgen Inc, Merck & Co Inc, F Hoffmann-La Roche Ltd, Johnson and Johnson, Teva Pharmaceutical Industries Ltd, Viatris, AbbVie Inc, Gilead Sciences Inc, Bristol-Myers Squibb Company.
3. What are the main segments of the Specialty Pharmaceuticals Market?
The market segments include Therapeutic Area, Route of Administration, Distribution Channel.
4. Can you provide details about the market size?
The market size is estimated to be USD XX Million as of 2022.
5. What are some drivers contributing to market growth?
Increasing Burden of Chronic and Rare Diseases; Growing Research and Development Activities.
6. What are the notable trends driving market growth?
Oncology Segment is Expected to Account for the Large Market Share Over the Forecast Period.
7. Are there any restraints impacting market growth?
High Cost of Drugs.
8. Can you provide examples of recent developments in the market?
In March 2022, Intellia Therapeutics, Inc. received US Food and Drug Administration (FDA) orphan drug designation for Intellia's ex vivo investigational T cell receptor (TCR)-T cell therapy, NTLA-5001, for the treatment of acute myeloid leukemia (AML).
9. What pricing options are available for accessing the report?
Pricing options include single-user, multi-user, and enterprise licenses priced at USD 4750, USD 5250, and USD 8750 respectively.
10. Is the market size provided in terms of value or volume?
The market size is provided in terms of value, measured in Million and volume, measured in K Unit.
11. Are there any specific market keywords associated with the report?
Yes, the market keyword associated with the report is "Specialty Pharmaceuticals Market," which aids in identifying and referencing the specific market segment covered.
12. How do I determine which pricing option suits my needs best?
The pricing options vary based on user requirements and access needs. Individual users may opt for single-user licenses, while businesses requiring broader access may choose multi-user or enterprise licenses for cost-effective access to the report.
13. Are there any additional resources or data provided in the Specialty Pharmaceuticals Market report?
While the report offers comprehensive insights, it's advisable to review the specific contents or supplementary materials provided to ascertain if additional resources or data are available.
14. How can I stay updated on further developments or reports in the Specialty Pharmaceuticals Market?
To stay informed about further developments, trends, and reports in the Specialty Pharmaceuticals Market, consider subscribing to industry newsletters, following relevant companies and organizations, or regularly checking reputable industry news sources and publications.
Methodology
Step 1 - Identification of Relevant Samples Size from Population Database


Step 2 - Approaches for Defining Global Market Size (Value, Volume* & Price*)

Note*: In applicable scenarios
Step 3 - Data Sources
Primary Research
- Web Analytics
- Survey Reports
- Research Institute
- Latest Research Reports
- Opinion Leaders
Secondary Research
- Annual Reports
- White Paper
- Latest Press Release
- Industry Association
- Paid Database
- Investor Presentations

Step 4 - Data Triangulation
Involves using different sources of information in order to increase the validity of a study
These sources are likely to be stakeholders in a program - participants, other researchers, program staff, other community members, and so on.
Then we put all data in single framework & apply various statistical tools to find out the dynamic on the market.
During the analysis stage, feedback from the stakeholder groups would be compared to determine areas of agreement as well as areas of divergence


