

Key Insights
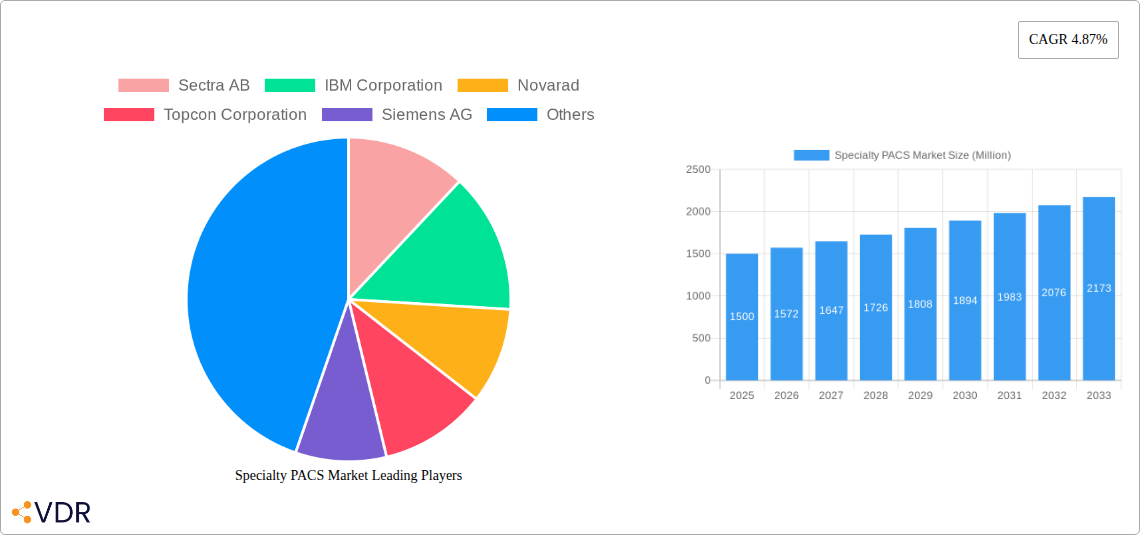
The global Specialty PACS market, encompassing crucial segments like cardiovascular, orthopedic, and oncology imaging, is poised for significant expansion. Projected to reach 5.31 billion by 2025, the market is expected to grow at a Compound Annual Growth Rate (CAGR) of 8.5%. This robust growth is propelled by the increasing burden of chronic diseases, driving the demand for advanced diagnostic imaging and streamlined image management. The widespread adoption of cloud-based PACS solutions further fuels market momentum, offering enhanced accessibility, scalability, and reduced IT overheads. Technological advancements, including AI-powered image analysis and superior interoperability, are continually enhancing Specialty PACS capabilities, making them indispensable tools in modern healthcare. The market is segmented by type (cardiovascular, orthopedic, oncology, etc.), component (software, services, hardware), deployment (on-premise, cloud-based), and end-user (hospitals, diagnostic centers).
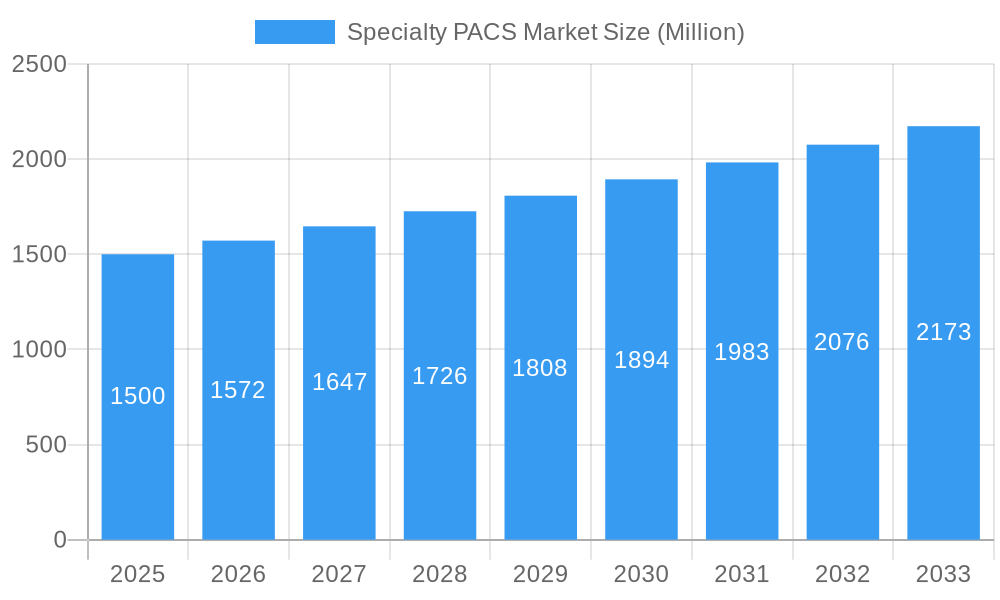
Specialty PACS Market Market Size (In Billion)
North America leads the market, driven by substantial healthcare investments and rapid technological adoption. However, the Asia Pacific region is projected to experience considerable growth, fueled by expanding healthcare infrastructure and rising disposable incomes. Intense competition exists among established players such as Sectra, IBM, Novarad, and Siemens, alongside emerging key contributors. While regulatory frameworks and data privacy present challenges, the overall market outlook remains highly optimistic.
Specialty PACS Market Company Market Share
The evolution of Specialty PACS aligns with the shift towards value-based care, emphasizing improved workflow efficiency and diagnostic precision. Continuous innovation in image processing and AI integration promises to reshape the market landscape. The growth of telehealth and remote diagnostics also presents significant opportunities, as Specialty PACS becomes vital for seamless image sharing and cross-location collaboration among healthcare providers. Despite initial implementation costs, the long-term benefits of operational efficiency, enhanced diagnostic accuracy, and cost reduction position Specialty PACS as a strategic investment for healthcare organizations. Ongoing efforts in interoperability and standardization will facilitate deeper integration with existing healthcare IT systems, further catalyzing market expansion.
Specialty PACS Market: A Comprehensive Market Report (2019-2033)
This in-depth report provides a comprehensive analysis of the Specialty PACS market, encompassing market dynamics, growth trends, regional analysis, product landscape, key players, and future outlook. The report covers the historical period (2019-2024), base year (2025), and forecast period (2025-2033), offering invaluable insights for industry professionals, investors, and strategic decision-makers. The total market value in 2025 is estimated at xx Million. The parent market is the broader PACS market, and child markets include Cardiovascular, Orthopedic, and Oncology PACS systems.
Specialty PACS Market Dynamics & Structure
The Specialty PACS market is characterized by a moderately concentrated landscape with key players holding significant market share. Technological innovation, particularly in areas like AI-powered image analysis and cloud-based solutions, is a major driver. Stringent regulatory frameworks governing medical device safety and data privacy influence market dynamics. Competition from other medical imaging solutions, such as standalone modality-specific viewers, creates competitive pressure. The end-user demographics are primarily hospitals and diagnostic centers, with a growing contribution from other end-users such as private clinics. M&A activity has been moderate, with xx major deals recorded between 2019 and 2024, reflecting consolidation efforts within the industry.
- Market Concentration: Top 5 players hold approximately xx% of the market share in 2025.
- Technological Innovation: AI-powered image analysis, cloud-based solutions, and improved interoperability are key drivers.
- Regulatory Landscape: Compliance with HIPAA, GDPR, and other relevant regulations is crucial.
- Competitive Substitutes: Standalone modality viewers and other image management systems pose competitive challenges.
- End-User Demographics: Hospitals and diagnostic centers dominate the market, with a growing share from other end-users.
- M&A Activity: xx major mergers and acquisitions occurred between 2019 and 2024.
Specialty PACS Market Growth Trends & Insights
The Specialty PACS market experienced robust growth during the historical period (2019-2024), driven by increasing adoption of digital imaging, rising prevalence of chronic diseases necessitating advanced diagnostics, and expanding healthcare infrastructure globally. The market size is projected to reach xx Million by 2033, exhibiting a CAGR of xx% during the forecast period (2025-2033). This growth is fueled by technological advancements, such as the integration of AI and machine learning for improved diagnostics and streamlined workflows. A significant shift toward cloud-based solutions is observed, driven by enhanced scalability, cost-effectiveness, and accessibility. Consumer behavior is increasingly favoring solutions that improve efficiency, reduce operational costs, and offer better collaboration capabilities. Market penetration within underserved regions is expected to contribute significantly to market expansion.
Dominant Regions, Countries, or Segments in Specialty PACS Market
North America holds the largest market share, driven by high adoption rates, advanced healthcare infrastructure, and robust funding for healthcare IT. Europe follows as a significant market, with steady growth propelled by government initiatives to enhance healthcare digitalization. Within segments, the Cardiovascular PACS market enjoys the largest share due to the high volume of cardiac imaging procedures. The software component commands the largest share within the product segment, owing to the increasing demand for advanced image analysis and workflow management tools. Hospitals remain the dominant end-users, accounting for a significant portion of market revenue. Web/Cloud-based Specialty PACS is experiencing rapid adoption, surpassing On-premise solutions due to its scalability and cost-effectiveness.
- Key Drivers:
- North America: High healthcare expenditure, advanced technology adoption.
- Europe: Government initiatives, increasing digitization in healthcare.
- Asia-Pacific: Growing healthcare infrastructure, rising disposable income.
- Dominant Segments:
- Type: Cardiovascular PACS
- Component: Software
- Development: Web/Cloud-based Specialty PACS
- End User: Hospitals
Specialty PACS Market Product Landscape
Specialty PACS systems are constantly evolving, incorporating advanced features like AI-driven image analysis, improved workflow optimization, and enhanced interoperability with other medical imaging systems. Modern systems offer sophisticated tools for image processing, viewing, storage, and retrieval, tailored to specific specialties. Unique selling propositions frequently include the speed and efficiency of image interpretation, advanced visualization capabilities, and seamless integration with existing healthcare IT infrastructure. Key technological advancements include advancements in cloud computing, artificial intelligence, and improved user interface design.
Key Drivers, Barriers & Challenges in Specialty PACS Market
Key Drivers: The increasing prevalence of chronic diseases, the growing adoption of digital imaging techniques, the rising demand for efficient workflow management, and the need for improved diagnostic accuracy are major market drivers. Government initiatives promoting healthcare IT modernization further accelerate market growth.
Challenges & Restraints: High initial investment costs, complex integration with existing systems, the need for skilled professionals to operate and maintain the systems, and data security concerns are major challenges. Regulatory hurdles, including compliance requirements and data privacy regulations, add to the complexity. Competition from established players and emerging entrants also creates pressure. Supply chain disruptions can impact the availability of hardware components, affecting market growth.
Emerging Opportunities in Specialty PACS Market
Untapped markets in developing economies present significant growth potential. The integration of AI and machine learning for automated image analysis opens doors for enhanced diagnostic capabilities and improved clinical decision-making. Growing demand for telehealth solutions is creating opportunities for cloud-based PACS systems to support remote access and collaboration. Integration with other healthcare IT systems, such as EHRs and RIS, is driving the need for seamless interoperability and data exchange.
Growth Accelerators in the Specialty PACS Market Industry
Technological advancements, particularly in AI and cloud computing, will continue to propel market growth. Strategic partnerships between PACS vendors and healthcare providers are facilitating wider adoption and integration. Expansion into emerging markets and growing adoption of specialized PACS systems for various clinical specialties, like oncology and orthopedics, will further accelerate market expansion. The growing focus on improving efficiency and reducing costs within healthcare systems is driving the adoption of cloud-based solutions.
Key Players Shaping the Specialty PACS Market Market
Notable Milestones in Specialty PACS Market Sector
- April 2022: FUJIFILM Healthcare Americas Corporation installed Fujifilm's Synapse Cardiology PACS version 7 throughout Emory Healthcare facilities. This highlights the growing adoption of advanced cardiology PACS solutions in major healthcare systems.
- March 2022: Intelerad Medical Systems launched its new Enterprise Imaging and Informatics Suite. This demonstrates the increasing trend towards integrated imaging solutions designed to improve data management and interoperability across healthcare organizations.
In-Depth Specialty PACS Market Market Outlook
The Specialty PACS market is poised for continued growth, driven by technological innovations, expanding healthcare IT infrastructure, and a rising demand for efficient and accurate diagnostic solutions. Strategic partnerships, market expansions into emerging economies, and the continued adoption of cloud-based solutions will shape the future landscape. The focus on AI-powered image analysis and improved interoperability will be key differentiators for market players. The market presents significant opportunities for companies offering innovative, cost-effective, and secure solutions that meet the evolving needs of healthcare providers.
Specialty PACS Market Segmentation
-
1. Type
- 1.1. Cardiovascular PACS
- 1.2. Orthopedic PACS
- 1.3. Oncology PACS
- 1.4. Other Types
-
2. Component
- 2.1. Software
- 2.2. Services
- 2.3. Hardware
-
3. Development
- 3.1. On-premise Specialty PACS
- 3.2. Web/Cloud-based Specialty PACS
-
4. End User
- 4.1. Hospitals
- 4.2. Diagnostic Centers
- 4.3. Other End Users
Specialty PACS Market Segmentation By Geography
-
1. North America
- 1.1. United States
- 1.2. Canada
- 1.3. Mexico
-
2. Europe
- 2.1. Germany
- 2.2. United Kingdom
- 2.3. France
- 2.4. Italy
- 2.5. Spain
- 2.6. Rest of Europe
-
3. Asia Pacific
- 3.1. China
- 3.2. Japan
- 3.3. India
- 3.4. Australia
- 3.5. South Korea
- 3.6. Rest of Asia Pacific
-
4. Middle East and Africa
- 4.1. GCC
- 4.2. South Africa
- 4.3. Rest of Middle East and Africa
-
5. South America
- 5.1. Brazil
- 5.2. Argentina
- 5.3. Rest of South America
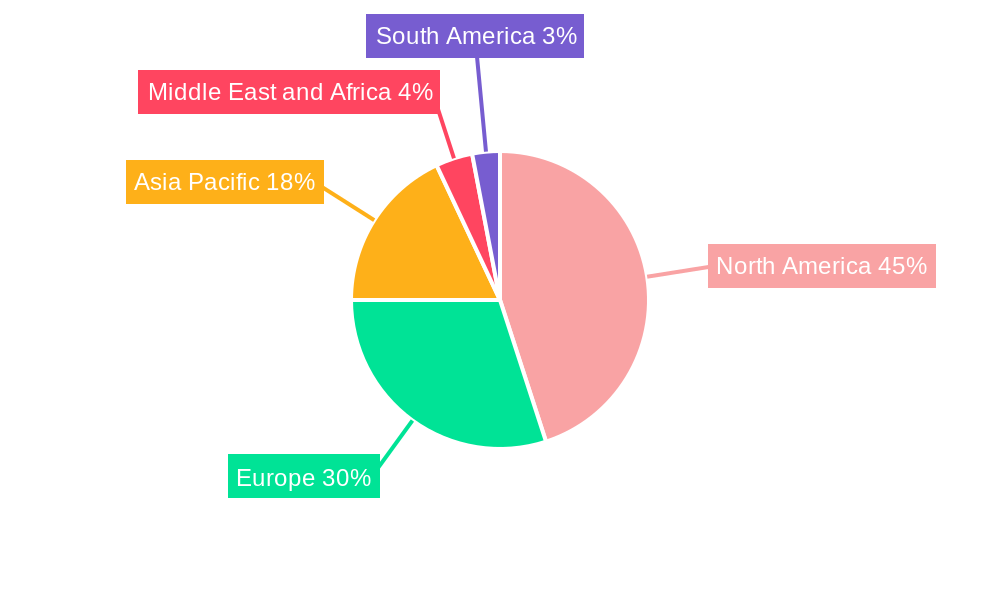
Specialty PACS Market Regional Market Share
Geographic Coverage of Specialty PACS Market
Specialty PACS Market REPORT HIGHLIGHTS
| Aspects | Details |
|---|---|
| Study Period | 2020-2034 |
| Base Year | 2025 |
| Estimated Year | 2026 |
| Forecast Period | 2026-2034 |
| Historical Period | 2020-2025 |
| Growth Rate | CAGR of 8.5% from 2020-2034 |
| Segmentation |
|
Table of Contents
- 1. Introduction
- 1.1. Research Scope
- 1.2. Market Segmentation
- 1.3. Research Objective
- 1.4. Definitions and Assumptions
- 2. Executive Summary
- 2.1. Market Snapshot
- 3. Market Dynamics
- 3.1. Market Drivers
- 3.2. Market Restrains
- 3.3. Market Trends
- 3.4. Market Opportunities
- 4. Market Factor Analysis
- 4.1. Porters Five Forces
- 4.1.1. Bargaining Power of Suppliers
- 4.1.2. Bargaining Power of Buyers
- 4.1.3. Threat of New Entrants
- 4.1.4. Threat of Substitutes
- 4.1.5. Competitive Rivalry
- 4.2. PESTEL analysis
- 4.3. BCG Analysis
- 4.3.1. Stars (High Growth, High Market Share)
- 4.3.2. Cash Cows (Low Growth, High Market Share)
- 4.3.3. Question Mark (High Growth, Low Market Share)
- 4.3.4. Dogs (Low Growth, Low Market Share)
- 4.4. Ansoff Matrix Analysis
- 4.5. Supply Chain Analysis
- 4.6. Regulatory Landscape
- 4.7. Current Market Potential and Opportunity Assessment (TAM–SAM–SOM Framework)
- 4.8. VDR Analyst Note
- 4.1. Porters Five Forces
- 5. Market Analysis, Insights and Forecast 2021-2033
- 5.1. Market Analysis, Insights and Forecast - by Type
- 5.1.1. Cardiovascular PACS
- 5.1.2. Orthopedic PACS
- 5.1.3. Oncology PACS
- 5.1.4. Other Types
- 5.2. Market Analysis, Insights and Forecast - by Component
- 5.2.1. Software
- 5.2.2. Services
- 5.2.3. Hardware
- 5.3. Market Analysis, Insights and Forecast - by Development
- 5.3.1. On-premise Specialty PACS
- 5.3.2. Web/Cloud-based Specialty PACS
- 5.4. Market Analysis, Insights and Forecast - by End User
- 5.4.1. Hospitals
- 5.4.2. Diagnostic Centers
- 5.4.3. Other End Users
- 5.5. Market Analysis, Insights and Forecast - by Region
- 5.5.1. North America
- 5.5.2. Europe
- 5.5.3. Asia Pacific
- 5.5.4. Middle East and Africa
- 5.5.5. South America
- 5.1. Market Analysis, Insights and Forecast - by Type
- 6. Global Specialty PACS Market Analysis, Insights and Forecast, 2021-2033
- 6.1. Market Analysis, Insights and Forecast - by Type
- 6.1.1. Cardiovascular PACS
- 6.1.2. Orthopedic PACS
- 6.1.3. Oncology PACS
- 6.1.4. Other Types
- 6.2. Market Analysis, Insights and Forecast - by Component
- 6.2.1. Software
- 6.2.2. Services
- 6.2.3. Hardware
- 6.3. Market Analysis, Insights and Forecast - by Development
- 6.3.1. On-premise Specialty PACS
- 6.3.2. Web/Cloud-based Specialty PACS
- 6.4. Market Analysis, Insights and Forecast - by End User
- 6.4.1. Hospitals
- 6.4.2. Diagnostic Centers
- 6.4.3. Other End Users
- 6.1. Market Analysis, Insights and Forecast - by Type
- 7. North America Specialty PACS Market Analysis, Insights and Forecast, 2021-2033
- 7.1. Market Analysis, Insights and Forecast - by Type
- 7.1.1. Cardiovascular PACS
- 7.1.2. Orthopedic PACS
- 7.1.3. Oncology PACS
- 7.1.4. Other Types
- 7.2. Market Analysis, Insights and Forecast - by Component
- 7.2.1. Software
- 7.2.2. Services
- 7.2.3. Hardware
- 7.3. Market Analysis, Insights and Forecast - by Development
- 7.3.1. On-premise Specialty PACS
- 7.3.2. Web/Cloud-based Specialty PACS
- 7.4. Market Analysis, Insights and Forecast - by End User
- 7.4.1. Hospitals
- 7.4.2. Diagnostic Centers
- 7.4.3. Other End Users
- 7.1. Market Analysis, Insights and Forecast - by Type
- 8. Europe Specialty PACS Market Analysis, Insights and Forecast, 2021-2033
- 8.1. Market Analysis, Insights and Forecast - by Type
- 8.1.1. Cardiovascular PACS
- 8.1.2. Orthopedic PACS
- 8.1.3. Oncology PACS
- 8.1.4. Other Types
- 8.2. Market Analysis, Insights and Forecast - by Component
- 8.2.1. Software
- 8.2.2. Services
- 8.2.3. Hardware
- 8.3. Market Analysis, Insights and Forecast - by Development
- 8.3.1. On-premise Specialty PACS
- 8.3.2. Web/Cloud-based Specialty PACS
- 8.4. Market Analysis, Insights and Forecast - by End User
- 8.4.1. Hospitals
- 8.4.2. Diagnostic Centers
- 8.4.3. Other End Users
- 8.1. Market Analysis, Insights and Forecast - by Type
- 9. Asia Pacific Specialty PACS Market Analysis, Insights and Forecast, 2021-2033
- 9.1. Market Analysis, Insights and Forecast - by Type
- 9.1.1. Cardiovascular PACS
- 9.1.2. Orthopedic PACS
- 9.1.3. Oncology PACS
- 9.1.4. Other Types
- 9.2. Market Analysis, Insights and Forecast - by Component
- 9.2.1. Software
- 9.2.2. Services
- 9.2.3. Hardware
- 9.3. Market Analysis, Insights and Forecast - by Development
- 9.3.1. On-premise Specialty PACS
- 9.3.2. Web/Cloud-based Specialty PACS
- 9.4. Market Analysis, Insights and Forecast - by End User
- 9.4.1. Hospitals
- 9.4.2. Diagnostic Centers
- 9.4.3. Other End Users
- 9.1. Market Analysis, Insights and Forecast - by Type
- 10. Middle East and Africa Specialty PACS Market Analysis, Insights and Forecast, 2021-2033
- 10.1. Market Analysis, Insights and Forecast - by Type
- 10.1.1. Cardiovascular PACS
- 10.1.2. Orthopedic PACS
- 10.1.3. Oncology PACS
- 10.1.4. Other Types
- 10.2. Market Analysis, Insights and Forecast - by Component
- 10.2.1. Software
- 10.2.2. Services
- 10.2.3. Hardware
- 10.3. Market Analysis, Insights and Forecast - by Development
- 10.3.1. On-premise Specialty PACS
- 10.3.2. Web/Cloud-based Specialty PACS
- 10.4. Market Analysis, Insights and Forecast - by End User
- 10.4.1. Hospitals
- 10.4.2. Diagnostic Centers
- 10.4.3. Other End Users
- 10.1. Market Analysis, Insights and Forecast - by Type
- 11. South America Specialty PACS Market Analysis, Insights and Forecast, 2021-2033
- 11.1. Market Analysis, Insights and Forecast - by Type
- 11.1.1. Cardiovascular PACS
- 11.1.2. Orthopedic PACS
- 11.1.3. Oncology PACS
- 11.1.4. Other Types
- 11.2. Market Analysis, Insights and Forecast - by Component
- 11.2.1. Software
- 11.2.2. Services
- 11.2.3. Hardware
- 11.3. Market Analysis, Insights and Forecast - by Development
- 11.3.1. On-premise Specialty PACS
- 11.3.2. Web/Cloud-based Specialty PACS
- 11.4. Market Analysis, Insights and Forecast - by End User
- 11.4.1. Hospitals
- 11.4.2. Diagnostic Centers
- 11.4.3. Other End Users
- 11.1. Market Analysis, Insights and Forecast - by Type
- 12. Competitive Analysis
- 12.1. Company Profiles
- 12.1.1 Sectra AB
- 12.1.1.1. Company Overview
- 12.1.1.2. Products
- 12.1.1.3. Company Financials
- 12.1.1.4. SWOT Analysis
- 12.1.2 IBM Corporation
- 12.1.2.1. Company Overview
- 12.1.2.2. Products
- 12.1.2.3. Company Financials
- 12.1.2.4. SWOT Analysis
- 12.1.3 Novarad
- 12.1.3.1. Company Overview
- 12.1.3.2. Products
- 12.1.3.3. Company Financials
- 12.1.3.4. SWOT Analysis
- 12.1.4 Topcon Corporation
- 12.1.4.1. Company Overview
- 12.1.4.2. Products
- 12.1.4.3. Company Financials
- 12.1.4.4. SWOT Analysis
- 12.1.5 Siemens AG
- 12.1.5.1. Company Overview
- 12.1.5.2. Products
- 12.1.5.3. Company Financials
- 12.1.5.4. SWOT Analysis
- 12.1.6 Philips Healthcare
- 12.1.6.1. Company Overview
- 12.1.6.2. Products
- 12.1.6.3. Company Financials
- 12.1.6.4. SWOT Analysis
- 12.1.7 Canon USA Inc
- 12.1.7.1. Company Overview
- 12.1.7.2. Products
- 12.1.7.3. Company Financials
- 12.1.7.4. SWOT Analysis
- 12.1.8 Agfa Healthcare
- 12.1.8.1. Company Overview
- 12.1.8.2. Products
- 12.1.8.3. Company Financials
- 12.1.8.4. SWOT Analysis
- 12.1.9 McKesson Corporation
- 12.1.9.1. Company Overview
- 12.1.9.2. Products
- 12.1.9.3. Company Financials
- 12.1.9.4. SWOT Analysis
- 12.1.10 Fujifilm Holdings Corporation (Fujifilm Medical Systems)
- 12.1.10.1. Company Overview
- 12.1.10.2. Products
- 12.1.10.3. Company Financials
- 12.1.10.4. SWOT Analysis
- 12.1.1 Sectra AB
- 12.2. Market Entropy
- 12.2.1 Company's Key Areas Served
- 12.2.2 Recent Developments
- 12.3. Company Market Share Analysis 2025
- 12.3.1 Top 5 Companies Market Share Analysis
- 12.3.2 Top 3 Companies Market Share Analysis
- 12.4. List of Potential Customers
- 13. Research Methodology
List of Figures
- Figure 1: Global Specialty PACS Market Revenue Breakdown (billion, %) by Region 2025 & 2033
- Figure 2: Global Specialty PACS Market Volume Breakdown (K Unit, %) by Region 2025 & 2033
- Figure 3: North America Specialty PACS Market Revenue (billion), by Type 2025 & 2033
- Figure 4: North America Specialty PACS Market Volume (K Unit), by Type 2025 & 2033
- Figure 5: North America Specialty PACS Market Revenue Share (%), by Type 2025 & 2033
- Figure 6: North America Specialty PACS Market Volume Share (%), by Type 2025 & 2033
- Figure 7: North America Specialty PACS Market Revenue (billion), by Component 2025 & 2033
- Figure 8: North America Specialty PACS Market Volume (K Unit), by Component 2025 & 2033
- Figure 9: North America Specialty PACS Market Revenue Share (%), by Component 2025 & 2033
- Figure 10: North America Specialty PACS Market Volume Share (%), by Component 2025 & 2033
- Figure 11: North America Specialty PACS Market Revenue (billion), by Development 2025 & 2033
- Figure 12: North America Specialty PACS Market Volume (K Unit), by Development 2025 & 2033
- Figure 13: North America Specialty PACS Market Revenue Share (%), by Development 2025 & 2033
- Figure 14: North America Specialty PACS Market Volume Share (%), by Development 2025 & 2033
- Figure 15: North America Specialty PACS Market Revenue (billion), by End User 2025 & 2033
- Figure 16: North America Specialty PACS Market Volume (K Unit), by End User 2025 & 2033
- Figure 17: North America Specialty PACS Market Revenue Share (%), by End User 2025 & 2033
- Figure 18: North America Specialty PACS Market Volume Share (%), by End User 2025 & 2033
- Figure 19: North America Specialty PACS Market Revenue (billion), by Country 2025 & 2033
- Figure 20: North America Specialty PACS Market Volume (K Unit), by Country 2025 & 2033
- Figure 21: North America Specialty PACS Market Revenue Share (%), by Country 2025 & 2033
- Figure 22: North America Specialty PACS Market Volume Share (%), by Country 2025 & 2033
- Figure 23: Europe Specialty PACS Market Revenue (billion), by Type 2025 & 2033
- Figure 24: Europe Specialty PACS Market Volume (K Unit), by Type 2025 & 2033
- Figure 25: Europe Specialty PACS Market Revenue Share (%), by Type 2025 & 2033
- Figure 26: Europe Specialty PACS Market Volume Share (%), by Type 2025 & 2033
- Figure 27: Europe Specialty PACS Market Revenue (billion), by Component 2025 & 2033
- Figure 28: Europe Specialty PACS Market Volume (K Unit), by Component 2025 & 2033
- Figure 29: Europe Specialty PACS Market Revenue Share (%), by Component 2025 & 2033
- Figure 30: Europe Specialty PACS Market Volume Share (%), by Component 2025 & 2033
- Figure 31: Europe Specialty PACS Market Revenue (billion), by Development 2025 & 2033
- Figure 32: Europe Specialty PACS Market Volume (K Unit), by Development 2025 & 2033
- Figure 33: Europe Specialty PACS Market Revenue Share (%), by Development 2025 & 2033
- Figure 34: Europe Specialty PACS Market Volume Share (%), by Development 2025 & 2033
- Figure 35: Europe Specialty PACS Market Revenue (billion), by End User 2025 & 2033
- Figure 36: Europe Specialty PACS Market Volume (K Unit), by End User 2025 & 2033
- Figure 37: Europe Specialty PACS Market Revenue Share (%), by End User 2025 & 2033
- Figure 38: Europe Specialty PACS Market Volume Share (%), by End User 2025 & 2033
- Figure 39: Europe Specialty PACS Market Revenue (billion), by Country 2025 & 2033
- Figure 40: Europe Specialty PACS Market Volume (K Unit), by Country 2025 & 2033
- Figure 41: Europe Specialty PACS Market Revenue Share (%), by Country 2025 & 2033
- Figure 42: Europe Specialty PACS Market Volume Share (%), by Country 2025 & 2033
- Figure 43: Asia Pacific Specialty PACS Market Revenue (billion), by Type 2025 & 2033
- Figure 44: Asia Pacific Specialty PACS Market Volume (K Unit), by Type 2025 & 2033
- Figure 45: Asia Pacific Specialty PACS Market Revenue Share (%), by Type 2025 & 2033
- Figure 46: Asia Pacific Specialty PACS Market Volume Share (%), by Type 2025 & 2033
- Figure 47: Asia Pacific Specialty PACS Market Revenue (billion), by Component 2025 & 2033
- Figure 48: Asia Pacific Specialty PACS Market Volume (K Unit), by Component 2025 & 2033
- Figure 49: Asia Pacific Specialty PACS Market Revenue Share (%), by Component 2025 & 2033
- Figure 50: Asia Pacific Specialty PACS Market Volume Share (%), by Component 2025 & 2033
- Figure 51: Asia Pacific Specialty PACS Market Revenue (billion), by Development 2025 & 2033
- Figure 52: Asia Pacific Specialty PACS Market Volume (K Unit), by Development 2025 & 2033
- Figure 53: Asia Pacific Specialty PACS Market Revenue Share (%), by Development 2025 & 2033
- Figure 54: Asia Pacific Specialty PACS Market Volume Share (%), by Development 2025 & 2033
- Figure 55: Asia Pacific Specialty PACS Market Revenue (billion), by End User 2025 & 2033
- Figure 56: Asia Pacific Specialty PACS Market Volume (K Unit), by End User 2025 & 2033
- Figure 57: Asia Pacific Specialty PACS Market Revenue Share (%), by End User 2025 & 2033
- Figure 58: Asia Pacific Specialty PACS Market Volume Share (%), by End User 2025 & 2033
- Figure 59: Asia Pacific Specialty PACS Market Revenue (billion), by Country 2025 & 2033
- Figure 60: Asia Pacific Specialty PACS Market Volume (K Unit), by Country 2025 & 2033
- Figure 61: Asia Pacific Specialty PACS Market Revenue Share (%), by Country 2025 & 2033
- Figure 62: Asia Pacific Specialty PACS Market Volume Share (%), by Country 2025 & 2033
- Figure 63: Middle East and Africa Specialty PACS Market Revenue (billion), by Type 2025 & 2033
- Figure 64: Middle East and Africa Specialty PACS Market Volume (K Unit), by Type 2025 & 2033
- Figure 65: Middle East and Africa Specialty PACS Market Revenue Share (%), by Type 2025 & 2033
- Figure 66: Middle East and Africa Specialty PACS Market Volume Share (%), by Type 2025 & 2033
- Figure 67: Middle East and Africa Specialty PACS Market Revenue (billion), by Component 2025 & 2033
- Figure 68: Middle East and Africa Specialty PACS Market Volume (K Unit), by Component 2025 & 2033
- Figure 69: Middle East and Africa Specialty PACS Market Revenue Share (%), by Component 2025 & 2033
- Figure 70: Middle East and Africa Specialty PACS Market Volume Share (%), by Component 2025 & 2033
- Figure 71: Middle East and Africa Specialty PACS Market Revenue (billion), by Development 2025 & 2033
- Figure 72: Middle East and Africa Specialty PACS Market Volume (K Unit), by Development 2025 & 2033
- Figure 73: Middle East and Africa Specialty PACS Market Revenue Share (%), by Development 2025 & 2033
- Figure 74: Middle East and Africa Specialty PACS Market Volume Share (%), by Development 2025 & 2033
- Figure 75: Middle East and Africa Specialty PACS Market Revenue (billion), by End User 2025 & 2033
- Figure 76: Middle East and Africa Specialty PACS Market Volume (K Unit), by End User 2025 & 2033
- Figure 77: Middle East and Africa Specialty PACS Market Revenue Share (%), by End User 2025 & 2033
- Figure 78: Middle East and Africa Specialty PACS Market Volume Share (%), by End User 2025 & 2033
- Figure 79: Middle East and Africa Specialty PACS Market Revenue (billion), by Country 2025 & 2033
- Figure 80: Middle East and Africa Specialty PACS Market Volume (K Unit), by Country 2025 & 2033
- Figure 81: Middle East and Africa Specialty PACS Market Revenue Share (%), by Country 2025 & 2033
- Figure 82: Middle East and Africa Specialty PACS Market Volume Share (%), by Country 2025 & 2033
- Figure 83: South America Specialty PACS Market Revenue (billion), by Type 2025 & 2033
- Figure 84: South America Specialty PACS Market Volume (K Unit), by Type 2025 & 2033
- Figure 85: South America Specialty PACS Market Revenue Share (%), by Type 2025 & 2033
- Figure 86: South America Specialty PACS Market Volume Share (%), by Type 2025 & 2033
- Figure 87: South America Specialty PACS Market Revenue (billion), by Component 2025 & 2033
- Figure 88: South America Specialty PACS Market Volume (K Unit), by Component 2025 & 2033
- Figure 89: South America Specialty PACS Market Revenue Share (%), by Component 2025 & 2033
- Figure 90: South America Specialty PACS Market Volume Share (%), by Component 2025 & 2033
- Figure 91: South America Specialty PACS Market Revenue (billion), by Development 2025 & 2033
- Figure 92: South America Specialty PACS Market Volume (K Unit), by Development 2025 & 2033
- Figure 93: South America Specialty PACS Market Revenue Share (%), by Development 2025 & 2033
- Figure 94: South America Specialty PACS Market Volume Share (%), by Development 2025 & 2033
- Figure 95: South America Specialty PACS Market Revenue (billion), by End User 2025 & 2033
- Figure 96: South America Specialty PACS Market Volume (K Unit), by End User 2025 & 2033
- Figure 97: South America Specialty PACS Market Revenue Share (%), by End User 2025 & 2033
- Figure 98: South America Specialty PACS Market Volume Share (%), by End User 2025 & 2033
- Figure 99: South America Specialty PACS Market Revenue (billion), by Country 2025 & 2033
- Figure 100: South America Specialty PACS Market Volume (K Unit), by Country 2025 & 2033
- Figure 101: South America Specialty PACS Market Revenue Share (%), by Country 2025 & 2033
- Figure 102: South America Specialty PACS Market Volume Share (%), by Country 2025 & 2033
List of Tables
- Table 1: Global Specialty PACS Market Revenue billion Forecast, by Type 2020 & 2033
- Table 2: Global Specialty PACS Market Volume K Unit Forecast, by Type 2020 & 2033
- Table 3: Global Specialty PACS Market Revenue billion Forecast, by Component 2020 & 2033
- Table 4: Global Specialty PACS Market Volume K Unit Forecast, by Component 2020 & 2033
- Table 5: Global Specialty PACS Market Revenue billion Forecast, by Development 2020 & 2033
- Table 6: Global Specialty PACS Market Volume K Unit Forecast, by Development 2020 & 2033
- Table 7: Global Specialty PACS Market Revenue billion Forecast, by End User 2020 & 2033
- Table 8: Global Specialty PACS Market Volume K Unit Forecast, by End User 2020 & 2033
- Table 9: Global Specialty PACS Market Revenue billion Forecast, by Region 2020 & 2033
- Table 10: Global Specialty PACS Market Volume K Unit Forecast, by Region 2020 & 2033
- Table 11: Global Specialty PACS Market Revenue billion Forecast, by Type 2020 & 2033
- Table 12: Global Specialty PACS Market Volume K Unit Forecast, by Type 2020 & 2033
- Table 13: Global Specialty PACS Market Revenue billion Forecast, by Component 2020 & 2033
- Table 14: Global Specialty PACS Market Volume K Unit Forecast, by Component 2020 & 2033
- Table 15: Global Specialty PACS Market Revenue billion Forecast, by Development 2020 & 2033
- Table 16: Global Specialty PACS Market Volume K Unit Forecast, by Development 2020 & 2033
- Table 17: Global Specialty PACS Market Revenue billion Forecast, by End User 2020 & 2033
- Table 18: Global Specialty PACS Market Volume K Unit Forecast, by End User 2020 & 2033
- Table 19: Global Specialty PACS Market Revenue billion Forecast, by Country 2020 & 2033
- Table 20: Global Specialty PACS Market Volume K Unit Forecast, by Country 2020 & 2033
- Table 21: United States Specialty PACS Market Revenue (billion) Forecast, by Application 2020 & 2033
- Table 22: United States Specialty PACS Market Volume (K Unit) Forecast, by Application 2020 & 2033
- Table 23: Canada Specialty PACS Market Revenue (billion) Forecast, by Application 2020 & 2033
- Table 24: Canada Specialty PACS Market Volume (K Unit) Forecast, by Application 2020 & 2033
- Table 25: Mexico Specialty PACS Market Revenue (billion) Forecast, by Application 2020 & 2033
- Table 26: Mexico Specialty PACS Market Volume (K Unit) Forecast, by Application 2020 & 2033
- Table 27: Global Specialty PACS Market Revenue billion Forecast, by Type 2020 & 2033
- Table 28: Global Specialty PACS Market Volume K Unit Forecast, by Type 2020 & 2033
- Table 29: Global Specialty PACS Market Revenue billion Forecast, by Component 2020 & 2033
- Table 30: Global Specialty PACS Market Volume K Unit Forecast, by Component 2020 & 2033
- Table 31: Global Specialty PACS Market Revenue billion Forecast, by Development 2020 & 2033
- Table 32: Global Specialty PACS Market Volume K Unit Forecast, by Development 2020 & 2033
- Table 33: Global Specialty PACS Market Revenue billion Forecast, by End User 2020 & 2033
- Table 34: Global Specialty PACS Market Volume K Unit Forecast, by End User 2020 & 2033
- Table 35: Global Specialty PACS Market Revenue billion Forecast, by Country 2020 & 2033
- Table 36: Global Specialty PACS Market Volume K Unit Forecast, by Country 2020 & 2033
- Table 37: Germany Specialty PACS Market Revenue (billion) Forecast, by Application 2020 & 2033
- Table 38: Germany Specialty PACS Market Volume (K Unit) Forecast, by Application 2020 & 2033
- Table 39: United Kingdom Specialty PACS Market Revenue (billion) Forecast, by Application 2020 & 2033
- Table 40: United Kingdom Specialty PACS Market Volume (K Unit) Forecast, by Application 2020 & 2033
- Table 41: France Specialty PACS Market Revenue (billion) Forecast, by Application 2020 & 2033
- Table 42: France Specialty PACS Market Volume (K Unit) Forecast, by Application 2020 & 2033
- Table 43: Italy Specialty PACS Market Revenue (billion) Forecast, by Application 2020 & 2033
- Table 44: Italy Specialty PACS Market Volume (K Unit) Forecast, by Application 2020 & 2033
- Table 45: Spain Specialty PACS Market Revenue (billion) Forecast, by Application 2020 & 2033
- Table 46: Spain Specialty PACS Market Volume (K Unit) Forecast, by Application 2020 & 2033
- Table 47: Rest of Europe Specialty PACS Market Revenue (billion) Forecast, by Application 2020 & 2033
- Table 48: Rest of Europe Specialty PACS Market Volume (K Unit) Forecast, by Application 2020 & 2033
- Table 49: Global Specialty PACS Market Revenue billion Forecast, by Type 2020 & 2033
- Table 50: Global Specialty PACS Market Volume K Unit Forecast, by Type 2020 & 2033
- Table 51: Global Specialty PACS Market Revenue billion Forecast, by Component 2020 & 2033
- Table 52: Global Specialty PACS Market Volume K Unit Forecast, by Component 2020 & 2033
- Table 53: Global Specialty PACS Market Revenue billion Forecast, by Development 2020 & 2033
- Table 54: Global Specialty PACS Market Volume K Unit Forecast, by Development 2020 & 2033
- Table 55: Global Specialty PACS Market Revenue billion Forecast, by End User 2020 & 2033
- Table 56: Global Specialty PACS Market Volume K Unit Forecast, by End User 2020 & 2033
- Table 57: Global Specialty PACS Market Revenue billion Forecast, by Country 2020 & 2033
- Table 58: Global Specialty PACS Market Volume K Unit Forecast, by Country 2020 & 2033
- Table 59: China Specialty PACS Market Revenue (billion) Forecast, by Application 2020 & 2033
- Table 60: China Specialty PACS Market Volume (K Unit) Forecast, by Application 2020 & 2033
- Table 61: Japan Specialty PACS Market Revenue (billion) Forecast, by Application 2020 & 2033
- Table 62: Japan Specialty PACS Market Volume (K Unit) Forecast, by Application 2020 & 2033
- Table 63: India Specialty PACS Market Revenue (billion) Forecast, by Application 2020 & 2033
- Table 64: India Specialty PACS Market Volume (K Unit) Forecast, by Application 2020 & 2033
- Table 65: Australia Specialty PACS Market Revenue (billion) Forecast, by Application 2020 & 2033
- Table 66: Australia Specialty PACS Market Volume (K Unit) Forecast, by Application 2020 & 2033
- Table 67: South Korea Specialty PACS Market Revenue (billion) Forecast, by Application 2020 & 2033
- Table 68: South Korea Specialty PACS Market Volume (K Unit) Forecast, by Application 2020 & 2033
- Table 69: Rest of Asia Pacific Specialty PACS Market Revenue (billion) Forecast, by Application 2020 & 2033
- Table 70: Rest of Asia Pacific Specialty PACS Market Volume (K Unit) Forecast, by Application 2020 & 2033
- Table 71: Global Specialty PACS Market Revenue billion Forecast, by Type 2020 & 2033
- Table 72: Global Specialty PACS Market Volume K Unit Forecast, by Type 2020 & 2033
- Table 73: Global Specialty PACS Market Revenue billion Forecast, by Component 2020 & 2033
- Table 74: Global Specialty PACS Market Volume K Unit Forecast, by Component 2020 & 2033
- Table 75: Global Specialty PACS Market Revenue billion Forecast, by Development 2020 & 2033
- Table 76: Global Specialty PACS Market Volume K Unit Forecast, by Development 2020 & 2033
- Table 77: Global Specialty PACS Market Revenue billion Forecast, by End User 2020 & 2033
- Table 78: Global Specialty PACS Market Volume K Unit Forecast, by End User 2020 & 2033
- Table 79: Global Specialty PACS Market Revenue billion Forecast, by Country 2020 & 2033
- Table 80: Global Specialty PACS Market Volume K Unit Forecast, by Country 2020 & 2033
- Table 81: GCC Specialty PACS Market Revenue (billion) Forecast, by Application 2020 & 2033
- Table 82: GCC Specialty PACS Market Volume (K Unit) Forecast, by Application 2020 & 2033
- Table 83: South Africa Specialty PACS Market Revenue (billion) Forecast, by Application 2020 & 2033
- Table 84: South Africa Specialty PACS Market Volume (K Unit) Forecast, by Application 2020 & 2033
- Table 85: Rest of Middle East and Africa Specialty PACS Market Revenue (billion) Forecast, by Application 2020 & 2033
- Table 86: Rest of Middle East and Africa Specialty PACS Market Volume (K Unit) Forecast, by Application 2020 & 2033
- Table 87: Global Specialty PACS Market Revenue billion Forecast, by Type 2020 & 2033
- Table 88: Global Specialty PACS Market Volume K Unit Forecast, by Type 2020 & 2033
- Table 89: Global Specialty PACS Market Revenue billion Forecast, by Component 2020 & 2033
- Table 90: Global Specialty PACS Market Volume K Unit Forecast, by Component 2020 & 2033
- Table 91: Global Specialty PACS Market Revenue billion Forecast, by Development 2020 & 2033
- Table 92: Global Specialty PACS Market Volume K Unit Forecast, by Development 2020 & 2033
- Table 93: Global Specialty PACS Market Revenue billion Forecast, by End User 2020 & 2033
- Table 94: Global Specialty PACS Market Volume K Unit Forecast, by End User 2020 & 2033
- Table 95: Global Specialty PACS Market Revenue billion Forecast, by Country 2020 & 2033
- Table 96: Global Specialty PACS Market Volume K Unit Forecast, by Country 2020 & 2033
- Table 97: Brazil Specialty PACS Market Revenue (billion) Forecast, by Application 2020 & 2033
- Table 98: Brazil Specialty PACS Market Volume (K Unit) Forecast, by Application 2020 & 2033
- Table 99: Argentina Specialty PACS Market Revenue (billion) Forecast, by Application 2020 & 2033
- Table 100: Argentina Specialty PACS Market Volume (K Unit) Forecast, by Application 2020 & 2033
- Table 101: Rest of South America Specialty PACS Market Revenue (billion) Forecast, by Application 2020 & 2033
- Table 102: Rest of South America Specialty PACS Market Volume (K Unit) Forecast, by Application 2020 & 2033
Frequently Asked Questions
1. What is the projected Compound Annual Growth Rate (CAGR) of the Specialty PACS Market?
The projected CAGR is approximately 8.5%.
2. Which companies are prominent players in the Specialty PACS Market?
Key companies in the market include Sectra AB, IBM Corporation, Novarad, Topcon Corporation, Siemens AG, Philips Healthcare, Canon USA Inc, Agfa Healthcare, McKesson Corporation, Fujifilm Holdings Corporation (Fujifilm Medical Systems).
3. What are the main segments of the Specialty PACS Market?
The market segments include Type, Component, Development, End User.
4. Can you provide details about the market size?
The market size is estimated to be USD 5.31 billion as of 2022.
5. What are some drivers contributing to market growth?
Growing Use of Imaging Devices; Growing Burden of Chronic Diseases.
6. What are the notable trends driving market growth?
On-premise Specialty PACS are Expected to Hold the Largest Market Share in the Specialty PACS Market.
7. Are there any restraints impacting market growth?
Data Security and Privacy Issues.
8. Can you provide examples of recent developments in the market?
April 2022: FUJIFILM Healthcare Americas Corporation installed Fujifilm's Synapse Cardiology PACS version 7 throughout Emory Healthcare facilities to store, process, and analyze heart and vascular imaging. Emory Healthcare is the most comprehensive academic health system in Georgia.
9. What pricing options are available for accessing the report?
Pricing options include single-user, multi-user, and enterprise licenses priced at USD 4750, USD 5250, and USD 8750 respectively.
10. Is the market size provided in terms of value or volume?
The market size is provided in terms of value, measured in billion and volume, measured in K Unit.
11. Are there any specific market keywords associated with the report?
Yes, the market keyword associated with the report is "Specialty PACS Market," which aids in identifying and referencing the specific market segment covered.
12. How do I determine which pricing option suits my needs best?
The pricing options vary based on user requirements and access needs. Individual users may opt for single-user licenses, while businesses requiring broader access may choose multi-user or enterprise licenses for cost-effective access to the report.
13. Are there any additional resources or data provided in the Specialty PACS Market report?
While the report offers comprehensive insights, it's advisable to review the specific contents or supplementary materials provided to ascertain if additional resources or data are available.
14. How can I stay updated on further developments or reports in the Specialty PACS Market?
To stay informed about further developments, trends, and reports in the Specialty PACS Market, consider subscribing to industry newsletters, following relevant companies and organizations, or regularly checking reputable industry news sources and publications.
Methodology
Step 1 - Identification of Relevant Samples Size from Population Database


Step 2 - Approaches for Defining Global Market Size (Value, Volume* & Price*)

Note*: In applicable scenarios
Step 3 - Data Sources
Primary Research
- Web Analytics
- Survey Reports
- Research Institute
- Latest Research Reports
- Opinion Leaders
Secondary Research
- Annual Reports
- White Paper
- Latest Press Release
- Industry Association
- Paid Database
- Investor Presentations

Step 4 - Data Triangulation
Involves using different sources of information in order to increase the validity of a study
These sources are likely to be stakeholders in a program - participants, other researchers, program staff, other community members, and so on.
Then we put all data in single framework & apply various statistical tools to find out the dynamic on the market.
During the analysis stage, feedback from the stakeholder groups would be compared to determine areas of agreement as well as areas of divergence